Oviond Blog
6 Essential Features to Look for in Custom Reporting Tools
Unlock deeper insights than ever before with custom reporting tools. Tailor analytics to your most burning questions, visualize complex data clearly, and embed projections directly into workflows – specialized reporting supercharges decisions.


Unlock the Superpowers of Custom Reporting Tools
As reporting continues its rise to becoming one of the highest ROI technologies in business, custom reporting tools empower users to derive value tailored to their unique metrics and objectives. Per Gartner, organizations leverage reporting and data analytics to drive an average 14% boost in annual revenue. With 90% of data created in just the last 2 years, specialized reporting is crucial to staying competitive.
This article spotlights the 5 must-have superpowers custom reporting tools place at your fingertips – accelerating decisions, bolstering efficiency, and enhancing performance across the enterprise. Key capabilities provide the power to:
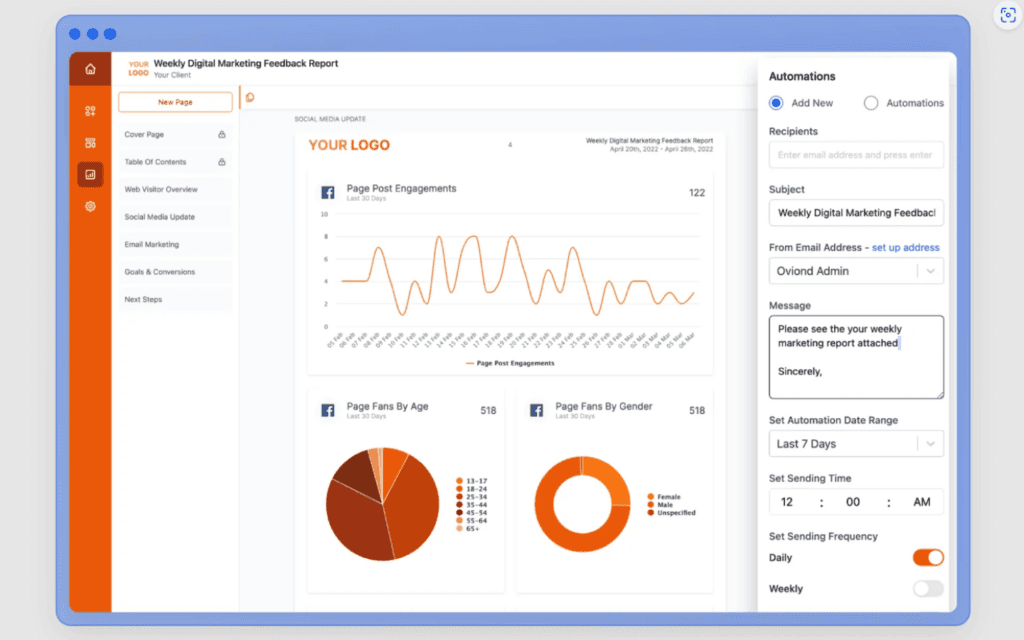
Generate Automated Reports
Look for custom reporting tools that simplify building recurring reports with easy scheduling, formatting, and distribution to relevant stakeholders. Automating repetitive manual reporting saves significant time (estimated at 14 hours per month for the average finance team). Added benefits include:
- Hands-free recurring report delivery ensures data is fresh without added workload
- Formatting alignment guarantees branding consistency across all reports
- Scaling distribution as audience size grows is seamless
- Complete audit trail for regulatory compliance needs
- Change report parameters rapidly as business requirements shift
- Reduce reporting backlog buildup for IT teams via self-service
The capacity to automate reporting workflows provides measurable time and efficiency gains while also enhancing consistency, transparency and flexibility. For ad-hoc analysis needs, the strongest tools combine this with simple ad hoc customization as well.
Custom Visualizations
Visual appeal matters tremendously in drawing audience attention to the most impactful insights. Select tools with robust graphical capabilities via interactive charts, graphs, gauges and pivot tables to spotlight trends and patterns. Dynamic visualizations should allow drilling down into dimensions of interest. Benefits of powerful visualization include:
- Improved comprehension of complex data relationships
- Faster insight discovery through visual data exploration
- Increased report readership and stickiness
- Thought leadership positioning with cutting-edge graphics
- Branding consistency when matched to style guidelines
- Storytelling capacity to showcase performance gains
Augmented analytics capabilities provided by some solutions guide users on best graphs to illustrate key findings as well.
Data Integrations
A top priority feature is the ability to consolidate, blend, and analyze data from diverse sources across the business – from CRM and ERP to cloud storage and beyond. The best tools provide connector flexibility, with some exceeding integrations with over 100+ platforms. Benefits include:
- Single source of truth increasing report consistency
- More comprehensive insights from blended data
- Reduced reliance on IT teams for data wrangling
- Scalability as new data sources emerge
- Overcoming data silos that limit visibility
- Monitoring KPIs with up-to-date accuracy
- Automating data refreshes and transformations
As businesses embrace more data sources and types, versatile integrations are crucial to holistic intelligence.
Self-Service Access
Putting direct control into the hands of business teams amplifies insights and reduces bottlenecking for overburdened IT staff. Select tools with highly intuitive interfaces such as drag-and-drop report builders requiring no specialized technical skills. Benefits of expanded self-service access include:
- Faster time-to-insight by eliminating reporting backlog
- Improved productivity and ownership for business teams
- Agility adjusting analysis whenever business needs shift
- Deeper data literacy building analytical muscles
- Frees up IT staff for higher value technology initiatives
- Cost savings from better leveraging software licenses
Leading solutions enable users across any levels of data proficiency to assemble rich, interactive reports. As analytics continues permeating throughout organizations, ease-of-use is paramount to success.
Ad Hoc Reporting
Agility is key with business needs constantly evolving. Prioritize tools with minimal barriers to modifying reports on the fly. Capabilities like data blending, filtering, and visualizing on demand fuel adaptable analysis. Benefits include:
- Quick insights responding to emerging questions
- Flexibility adjusting analytics to new parameters
- Accelerated decision making with rapid iteration
- Supporting ad hoc scenarios like investor inquiries
- Enabling drill down analysis rather than static reporting
Tools like Logi Analytics make transformations easy with intuitive drag-and-drop interfaces. Augmented analytics builds in smart recommendations to guide modifications.
Sophisticated Tailored Analytics
While core reporting functionality satisfies table stakes, custom analytics tuned to specific decision making represents the pinnacle. Seek tools able provide this value-add with functionality like:
- Embedded predictive modeling for data projections
- “Explainability” for machine learning model results
- Role-based dashboards aligned to responsibilities
- Capacity to save parameterized analysis templates
- Natural language query and visualization
ThoughtSpot allows search-driven analysis by querying data using normal sentences. Other innovations on the horizon include video-based reporting amplified by interactive charts. Advanced functionality will continue raising the bar on custom insights.

Choosing the Optimal Tool
With the array of reporting tools on the market, systematically assessing options against business needs is key to success. Critical factors to evaluate include:
What are you going to use this report for?
What specific reporting needs do you have right now and coming down the pipeline? Daily inventory reports? Fancy executive dashboards? Ad hoc what-if analysis? Data to embed in other tools? Get clear on the exact use cases and audiences dependent on these reports.
What are your people working with?
Who’s building reports and consuming them day to day? If Jane from accounting will use this tool, how data savvy is she on a 1-10 scale? Ten being eats Python for breakfast. If it’s your developers integrating analytics, then no issue. But if average Joe need to assemble reports – keep it simple! How much time can they devote to training vs real-time analysis?
How’s this going to scale?
How complex is your data going get? Combing through a few CRM tables now, but in a few years connecting to the whole warehouse? And usage – just ten report heads or distribution to the whole company?
Is it worth the cost?
Compile expenses covering licenses, maintenance, customization/support, training and internal administration over a 5-year horizon. Compare comprehensively against existing manual reporting costs – Is it worth it? Is there a better option?

The Right Tool for the Right Job
With an abundance of reporting platforms on the market, narrowing options tailored to your specific use case is essential. This table profiles 7 top solutions across key dimensions to inform your selection.
Let this cross-section guide your initial down selection among the spectrum of excellent reporting platforms available. Once directionally aligned, we recommend tailored demos and free trials to validate the ideal match. Reach out to discuss consultants available to help finesse selection based on your use case specifics.
| Reporting Tool | Type of Reporting | Technical Level | Data Visualization Complexity | Pricing |
| Tableau | Data visualization, financial reporting, automated data updates | Some technical expertise, drag-and-drop interface | High complexity, diverse visualizations | Varied pricing options |
| Power BI | Business analytics, real-time data, interactive visualizations | User-friendly for all levels | Moderate to high, real-time visualizations | Free and premium options |
| BusinessObjects | Business intelligence, data reporting, analytics | Some technical background | Advanced for business analytics | Custom quote required |
| Visme | Custom reports, presentations | Suitable for all levels, drag-and-drop | Moderate, customizable templates | Free basic, paid advanced |
| ShareGate | SharePoint/Microsoft 365 migration, data management | IT professionals | Focused on migration management | Pricing upon request |
| Oviond | Digital marketing reporting, data consolidation from multiple platforms | Designed for marketers, easy to use | Moderate, tailored for marketing data | Subscription-based, plan options for every agency size |

The Future of Custom Reporting
While custom reporting tools have already transformed data-driven decision making, new waves of innovation continue raising the bar for flexible analytics. Key trends shaping the horizon include:
Conversational Interfaces
Natural language capabilities will drive analyses through plain speech or text – e.g. simply asking “Which product had the highest regional revenue growth last quarter?” Surfacing relevant reports and visualizations rapidly sans manual buildout.
Automated Insights
Taking natural language advances farther, auto-generated narrative reporting eliminates writing status updates manually. Tools prescribe data-driven explanations, inferences, and recommendations to accelerate insights.
Embedded Custom Analytics
APIs will promote further embedding dynamic reporting experiences customized to end-user needs directly into workflows. Sales reps access pipeline visuals within CRM systems while production previews KPIs real-time in manufacturing apps.
Augmented Data Preparation
Enriching data quality will minimize prep efforts for analysts through ML techniques addressing missing values, anomaly detection, duplication identification etc. Support more focus on value-add modeling and interpretation vs data wrangling.
Unified Self-Service Analytics
As the volume and diversity of data swells across organizations, solutions will increasingly converge capabilities for visualization, reporting, dashboards, and end-user data preparation under one roof. Supporting comprehensive custom analysis.
While list grows lengthy, core tenets hold – expect ever more tailored analytics at extreme ease of use and speed. What emerging capabilities excite you most for staying competitive?

The Future is Yours to Shape
As the business landscape grows exponentially more complex, custom reporting tools remain fixed as your guidepost to clarity and conviction. They synthesize expansive data chaos into targeted answers matching your most pressing questions.
These ever more powerful analytics partners will continue pushing the boundaries of flexibility and intelligence tailored distinctly to how your organization navigates uncertainty. Like an expert hiking guide, they illuminate forward vision while preventing false summits, enabling progress rooted in reality.
But the onus resides with leadership in fostering a culture truly leveraging these tools to unlock each person’s potential. This means promoting mastery that informs rather than overwhelms. And facilitating team alignment rather than fiefdom mentalities.
With sound implementation, custom reporting hands every stakeholder the compass empowering their strongest next step forward. The power rests in your hands to define direction and pace. Where will you lead your teams in this new era of possibilities? There lies the summit in view which builds legacy.
Frequently Asked Questions on Custom Reporting Software
What signs indicate it’s time to upgrade from manual reporting processes?
Errors creeping into reports, difficulty scaling delivery, lack of visualization, and impatience for insights.
How long does it take to implement a new custom reporting tool?
From a few days configuring packaged solutions to a few months for advanced embedded analytics.
Can these tools analyze client sales data I already store in the cloud securely?
Yes, leading solutions connect securely to any data source on-premises or in cloud platforms.
How accurately can tools project future revenue results based on historical data?
Embedded predictive modeling can forecast figures within 5-10% variance rates in many cases.
Can custom reporting aid my company’s sustainability and ESG tracking efforts?
Absolutely – specialized dashboards can track emissions, renewable energy, waste reduction and more.
What ROI uplifts have early adopters seen from upgraded reporting tools?
10-20% productivity jumps and even steeper decision confidence gains per IBM.
How can custom reporting enhance my supply chain operations?
Automate delivery of key logistics metrics like transit times and track crucial KPIs.
What security measures do these tools offer for sensitive data?
Robust measures like role-based access, end-to-end encryption, and data masking cover bases.
Where are conversational interfaces heading in the next few years?
Natural language will drive complex analysis through speech – reducing reporting lag times.
How could custom reporting aid our eCommerce optimization?
In infinite ways – product performance, customer segmentation, pricing elasticity, and predictive demand.
Can embedded dashboards deliver insights right when sales reps need them?
Yes, contextually embedded visuals enable data-driven selling tailored to each customer.
How can these tools help track team member productivity automatically?
Activity tracking presents real-time views into workflows to identify high performers.
What are the limitations of custom reporting tools we should be aware of?
Garbage in, garbage out – quality data inputs remain imperative as does judicious analysis.
How much data science expertise is required to maximize value?
Leading tools democratize customization for diverse user bases – but data literacy pays dividends.
Which innovations seem most game-changing from your perspective right now?
Conversational analysis and predictive modeling integrated discreetly into daily workflows.
Related articles
Simplify Marketing Reporting Today
Stop juggling multiple tools. Start presenting clear, automated reports your clients will love