
Oviond Blog
Mastering the Data Validation Process for Agencies
Stop sending clients wrong data. Master the data validation process for marketing agencies to guarantee accurate, trusted reports.

It's a familiar agency moment. The report is out, the client has opened it, and someone spots a number that doesn't match the ad platform. Now your account manager is slacking the paid media lead, your ops person is checking a connector, and your team is burning an hour proving the agency didn't mess up.
That's not a reporting problem. It's a data trust problem.
If you manage recurring client reporting across 5 to 50+ accounts, you can't run on hope, screenshots, and “it looked right when I built it.” You need a data validation process that's simple enough for your team to follow and strict enough to catch bad numbers before a client does.
Table of Contents
- The Reporting Nightmare Every Agency Wants to Avoid
- Step 1 Map Your Data from Source to Dashboard
- Step 2 Implement Ingestion and Transformation Checks
- Step 3 Run a Final QA and Reconcile Metrics
- Step 4 Automate and Monitor for Multi-Client Scale
- Agency Reporting That Finally Feels Simple
The Reporting Nightmare Every Agency Wants to Avoid
Friday afternoon. A top client is reviewing their monthly numbers before a board call. They email your team asking why the CPA in the dashboard doesn't match the number in Google Ads.
Nobody has a clean answer yet.
The paid media manager says the platform number is right. The account manager says the dashboard was fine yesterday. Ops finds a spreadsheet with a hand-built formula. Somebody else remembers GA4 was blended into the final scorecard. Now the problem isn't just one bad metric. The client is wondering which numbers they can trust.
That's how agencies end up with a data trust deficit. It doesn't happen because one person made a dumb mistake. It happens because reporting gets patched together over time. One client has a Looker Studio report with custom fields. Another has a spreadsheet with copied exports. Another has a dashboard built from multiple connectors that nobody documented properly.
Bad reporting rarely starts with bad intent. It starts with small shortcuts that pile up across clients.
The fix isn't more heroics from your ops lead. It's a formal data validation process that your whole team can repeat. Not enterprise BI theater. Not a giant governance program. Just a practical operating system for client reporting that answers four questions every time:
- Where did this metric come from
- What happened to it before it reached the dashboard
- Does the final number make sense
- How do we catch issues before the client sees them
If you don't define that process, your agency will keep paying the hidden tax of manual checks, awkward calls, and reissued reports. If you do define it, reporting gets calmer, onboarding gets easier, and clients stop treating every monthly deck like a potential crime scene.
Step 1 Map Your Data from Source to Dashboard
Most agencies skip this because it feels boring. That's a mistake. If you don't map each metric from source to dashboard, you're not validating anything. You're guessing.
Build a metric inventory first
Start with a simple rule. Every client-facing metric needs a written record of where it starts, what it's called in the source, what it's called in the report, and whether your agency changes it on the way through.
That inventory should include things like:
- Source platform: Google Ads, Meta, LinkedIn, GA4, CRM, call tracking tool
- Source field name: The actual metric or field name from the connector or API
- Dashboard label: The client-friendly name shown in the report
- Owner: Who on your team is responsible for the definition
- Transformation note: Any blending, filtering, grouping, or custom math applied
This sounds basic because it is. Basic wins here.
One reason this matters is simple. Data fragmentation across multiple advertising platforms (Google Ads, Meta, LinkedIn) and GA4 sources forces agencies to create fragmented reports, making the adoption of ETL pipelines or no-code connectors essential to unify data before validation checks can flag anomalies (reporting data consolidation challenges). If your sources are fragmented, your definitions drift fast.
Write down the transformations
A raw source metric and a dashboard metric are often not the same thing. Agencies rename fields all the time to make reports easier for clients to read. That part is fine. The danger starts when nobody documents the translation.
A few common examples:
- Conversions vs leads: Google Ads conversions may include actions your client doesn't consider a lead.
- Engagements: Meta and LinkedIn may define this differently, even if the dashboard uses one label.
- Cost per lead: Your agency may divide spend by form submissions, CRM-qualified leads, or imported offline conversions.
Many “the dashboard is wrong” complaints find their origin in this fact. The number may be technically correct. The definition is what changed.
Practical rule: If a metric is blended, filtered, or renamed, write the original field and the business definition side by side.
If your team pulls website data from content systems or client web properties, tools like a crawl website api can also help validate whether the source pages, structures, or tracked URLs you rely on still exist and still match your reporting assumptions.
Use one reporting hub, not scattered files
You can keep this inventory in a spreadsheet for a while, but that gets messy fast. Every new client, connector, and custom metric creates another chance for drift. A better setup is one reporting environment where sources, calculations, and outputs are tied together.
That's also why agencies should centralize the data-source layer, not just the dashboard layer. If you want a clean reference for available marketing connectors and how they fit into reporting, keep a shared list of your approved marketing data sources.
A good map does three things for your agency immediately:
- It gives new team members a source of truth.
- It exposes conflicting metric definitions before the report goes out.
- It makes QA faster because reviewers know what they're checking.
Without this step, the rest of the data validation process is built on sand.
Step 2 Implement Ingestion and Transformation Checks
Once the map exists, you can stop arguing about where the number should come from and start checking whether the number survived the trip.
Most validation failures happen in two places. First, when data enters the reporting system. Second, when your team applies custom math, blending, or formatting after import.
Start with the checks that catch obvious nonsense
The clinical data world uses a structured validation approach built around range checks, format checks, and logic checks, with discrepancies flagged through queries and reviewed for traceability (clinical data validation methods). Agencies should copy that discipline, just in plain English.
For reporting teams, that means asking blunt questions:
- Range checks: Does this value make sense at all? If CPC shows up as an absurd outlier, don't publish it.
- Format checks: Are dates, currencies, and percentages coming through consistently?
- Logic checks: Does the relationship between fields hold up? For example, a reporting period shouldn't include spend after the campaign end date in your own internal pacing sheet.
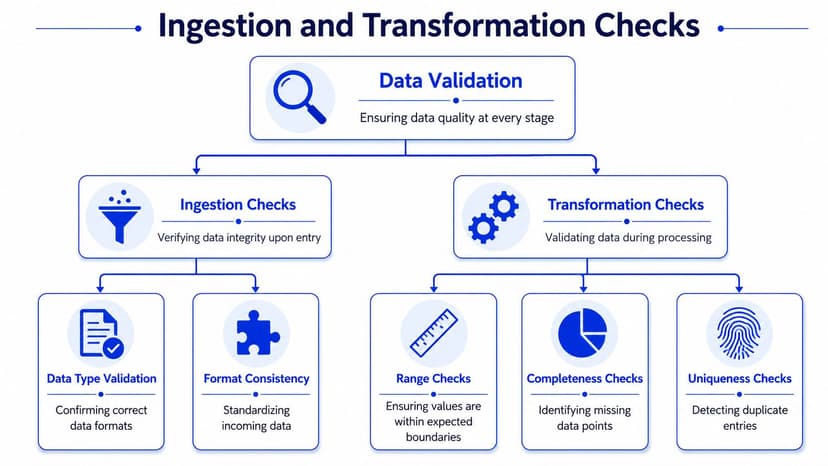
A broader validation framework also includes format validation, range validation, schema validation, code validation, and consistency validation, along with cleansing, transformation, verification, and documentation as routine parts of data quality work (data validation glossary and methods).
For agencies, skip the jargon and translate those into checks your team can run:
- Schema check: Did the connector still return the fields your dashboard expects?
- Consistency check: Are naming conventions and date formats aligned across sources?
- Duplicate check: Did imported rows or blended records get counted twice?
- Completeness check: Did a source fail to deliver some campaign or account data?
Validate the math you create
The second trap is your own reporting logic. The imported data can be clean and the final dashboard can still be wrong because of a bad calculated metric.
If your agency creates blended metrics like CPL, ROAS variants, blended CPA, or channel-group rollups, those formulas need validation too. Don't trust a custom formula because one smart person built it six months ago.
Use a short review process for every custom metric:
- Write the formula in plain language
- Test it against a hand calculation on a small sample
- Check edge cases like zero conversions or missing spend
- Confirm naming stays consistent across client templates
A robust validation model also includes a five-step method: define quality metrics, align them with governance, document rules, establish automated checks for things like schema validation and duplicate detection, and then monitor and refine those rules through regular audits (five-step data validation methodology). That's solid advice for agencies too, even if your “governance” is just a disciplined ops lead and a documented playbook.
If your agency can't explain how a metric is calculated in one sentence, you shouldn't put it in a client dashboard.
Make connection rules visible
A lot of teams hide connector behavior inside whoever built the report. That's fragile. Put the assumptions where the next person can find them.
Document things like attribution windows, account filters, excluded campaigns, timezone handling, and imported conversion logic. Keep those notes near the data layer, not in someone's memory. For connection-specific reference points, maintain an internal standard linked to your data connections documentation.
This is also where spreadsheets and patched Looker Studio builds start to crack. They make it too easy to bury logic in formulas no one audits. That's fine for one-off analysis. It's reckless for recurring multi-client reporting.
Step 3 Run a Final QA and Reconcile Metrics
Even a clean pipeline can produce a report that shouldn't go out.
That's the part too many teams miss. Validation isn't finished when the data loads without errors. It's finished when a human reviewer checks the output, asks whether the story makes sense, and reconciles a few key numbers against the original platforms.
Technical accuracy is not enough
A dashboard can be structurally correct and still be contextually wrong. The classic examples are easy to spot once you force yourself to look:
- Traffic doubled on a random Tuesday with no campaign change.
- Spend is present but conversions are suddenly zero.
- Blended CPA looks fine overall, but one channel is inconspicuously missing data.
- A “monthly” chart includes a partial current day and makes the trend look broken.
These aren't connector issues every time. Sometimes the platform changed a field. Sometimes a filter got edited. Sometimes a teammate duplicated a widget and forgot to update the source.
Reconciliation is where agencies protect client trust. It's the last point where common sense gets a vote.
A simple habit helps a lot. Before any recurring report goes out, compare a short list of anchor metrics against the source platforms. Not every metric. Just the ones a client is most likely to challenge first, such as spend, conversions, sessions, leads, or revenue.
If you want a solid agency-side framework for this stage, keep your review process tied to documented reporting best practices for agencies.
Use a repeatable QA checklist
Don't leave final review to memory. Use a checklist and make someone own it.
| Check | Common Pitfall | Remediation Action |
|---|---|---|
| Date range | Report includes mismatched dates across widgets | Standardize date controls and verify every page uses the same reporting window |
| Spend totals | One channel connector failed or a filter excluded campaigns | Cross-check spend against source platforms and refresh the affected data source |
| Conversion metrics | Different platforms use different conversion definitions | Confirm the business definition in the dashboard matches the agreed client KPI |
| Calculated metrics | Formula references the wrong source field | Re-test the formula with a manual sample calculation |
| Blended charts | Duplicate rows or mismatched dimensions distort totals | Inspect joins, blending logic, and source granularity |
| Currency display | Mixed currencies or formatting confuse the client | Normalize currency settings and label exceptions clearly |
| Anomaly review | Sudden jumps or drops go unexplained | Add reviewer notes, investigate source changes, and hold delivery if needed |
| Branding and delivery | Generic links or unfinished labels make the report look unpolished | Review naming, links, client-facing labels, and white-label presentation before send |
This checklist isn't exhaustive. It's the minimum.
Separate QA from QC in your workflow
A lot of agencies blur quality assurance and quality control, and that creates sloppy reporting habits. QC is the final inspection. QA is the system that should stop bad reports from existing in the first place. If your team needs a simple refresher on that distinction, this guide on understanding quality assurance vs QC is worth a read.
For agency ops, the split should look like this:
- QA: Metric definitions, templates, documented rules, standard formulas, approval workflows
- QC: Final pre-send review, platform spot checks, anomaly review, formatting pass
If you skip QA, your QC team becomes a cleanup crew. If you skip QC, preventable mistakes still reach the client. You need both.
Step 4 Automate and Monitor for Multi-Client Scale
Manual validation can work for a handful of clients. Past that, it turns into an expensive habit.
If you manage recurring reporting across multiple accounts, the only sane path is automation. Not blind automation. Controlled automation with alerts, templates, and clear exception handling.
Treat validation as an always-on system
Agencies must run continuous, automated data quality management pipelines that proactively profile, cleanse, deduplicate, and validate incoming data, because data quality is an always-on function, not a one-time cleanup (continuous data quality management for marketers).
That changes how you think about reporting ops.
Instead of asking, “Did we check this month's report?” ask:
- What checks run every refresh
- What failures create alerts
- What anomalies require human review
- What rules apply to every client by default
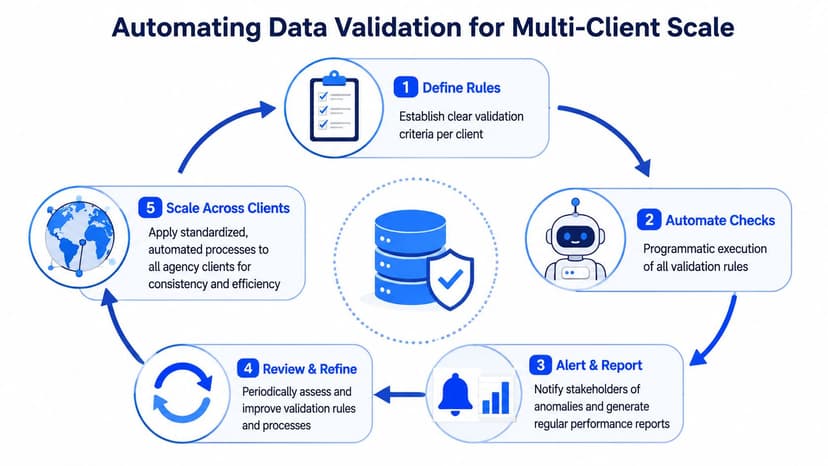
That shift matters because agency reporting breaks at scale in predictable ways. People copy old templates with old assumptions. New team members build custom logic from scratch. Clients ask for one-off tweaks that undermine consistency across accounts.
Automation stops that drift, but only if you automate the rules, not just the delivery.
Template the checks, not just the dashboards
A lot of agencies template report layouts and stop there. That's half the job.
You also need templated validation logic for:
- Approved metric definitions
- Standard calculated fields
- Expected source mappings
- Required pre-send checks
- Alert thresholds for suspicious changes
A phased rollout also makes sense. The underserved angle in many validation guides is the practical reality that agencies often need to move from simple file validation into more advanced QA over time, and only 12% of current guides detail this strategy with specific checkpoints (phased validation rollout guidance gap). In plain terms, don't wait for a perfect enterprise setup. Start with basic source mapping and sanity checks, then layer on automated rules and anomaly monitoring as your client base grows.
Agency ops rule: Standardize what must be true for every client, then allow controlled customizations around that core.
A workable multi-client workflow usually looks like this:
- Approve the source map for a new client
- Apply a reporting template with predefined metrics
- Run automated ingestion and transformation checks
- Trigger alerts for missing, duplicate, or outlier data
- Complete final human QA before scheduled delivery
- Review recurring failures and tighten the template
That's how you scale without rebuilding trust from scratch every month.
Choose software that fits agency ops
Not every reporting tool handles this equally well. Some agencies are happy with AgencyAnalytics, Whatagraph, or Swydo for specific setups. Others stick with Looker Studio because it's familiar and flexible. All of those can work in the right hands.
But here's the practical issue. The more your agency depends on patched spreadsheets, brittle formulas, and tool-hopping, the harder it gets to run one clean data validation process across all clients. Validation falls apart when the reporting stack is scattered.
The better fit is software that supports white-label client reporting, branded dashboards, custom domain delivery, reusable templates, automated delivery, calculated metrics, blended reporting, and team-wide access without creating more overhead. For agencies trying to scale recurring reporting with fewer moving parts, a central system for automated marketing reports is the smarter path.
One more practical point. The biggest hurdles in fully adopting AI for the media campaign lifecycle are data privacy and compliance, data quality and integration, and bias and fairness, which all affect how reliable automated validation can be in agency reporting (IAB State of Data 2025 report). So yes, use AI-assisted setup where it helps. Don't outsource judgment to it.
Automation should reduce reporting fires. It shouldn't create new ones.
Agency Reporting That Finally Feels Simple
Most agencies don't need a more complicated reporting stack. They need a reporting discipline.
That discipline is straightforward. Map the source. Check the ingestion and transformations. Run final QA. Automate the repeatable parts. If your team does those four things consistently, the data validation process stops being a technical side quest and becomes part of how the agency protects client confidence.
This is also a commercial advantage, not just an ops improvement. Agencies that can explain their numbers cleanly, deliver branded reports consistently, and catch issues before clients do look sharper. They keep reviews calmer. They onboard new accounts with less chaos. They make recurring client reporting easier to scale.
The opposite is also true. If your reporting still depends on scattered spreadsheets, fragile Looker Studio workarounds, and undocumented custom formulas, growth will make the problem worse. More clients means more exceptions, more QA debt, and more chances for trust to crack.
A better setup is one built for agency workflows from the start. That means white-label delivery, automated delivery, branded dashboards, support for multi-client reporting, flexible calculated metrics, and a clean client experience on a custom domain. It also means pricing that makes sense as client count grows, not a stack of feature gates and per-user penalties.
That's why agencies keep moving away from spreadsheet sprawl and generic dashboard chaos toward software that treats recurring reporting like an agency operation, not a BI project.
With the right process and the right platform, this is agency reporting that finally feels simple.
If you want a simpler way to run white-label client reporting across multiple clients, Oviond is built for that job. It gives agencies branded dashboards, automated delivery, custom domain options, 70+ integrations, AI/MCP-assisted setup, and a pricing model based on client count with unlimited reports, dashboards, and users in one plan. If you're done with spreadsheet maintenance and Looker Studio chaos, Oviond is the agency-native alternative.
Related articles
Simplify marketing reporting today
Stop juggling multiple tools. Start presenting clear, automated reports your clients will love