
Oviond Blog
Efficiency Measurement for Agencies: A Practical Guide
Learn efficiency measurement for your marketing agency. This guide covers key KPIs, dashboards, and reporting tools to scale client reporting without the chaos.

You can usually tell an agency has outgrown its reporting process before anyone says it out loud. Account managers are copying numbers out of Google Ads, GA4, Meta Ads, call tracking, and a CRM. Ops is fixing broken formulas in a spreadsheet someone duplicated six months ago. Clients still get the report, but the team gets there by brute force.
That routine feels normal in a lot of agencies. It also hides a bigger problem. If reporting takes too much manual work, efficiency measurement is already off track before you look at a single KPI.
Table of Contents
- Why Agency Efficiency Is More Than Just Billable Hours
- Core Efficiency KPIs Every Agency Should Track
- Beyond Basic KPIs Measuring What Truly Matters
- Common Pitfalls in Efficiency Measurement and How to Avoid Them
- From Spreadsheets to Dashboards Choosing Your Reporting System
- Building Your Efficiency Dashboard in Oviond
- Making Efficiency Measurement Your Agency's Superpower
Why Agency Efficiency Is More Than Just Billable Hours
A lot of agencies still treat efficiency as a staffing question. Are people billable enough? Are hours tracked cleanly? Are retainers covering delivery time?
Those things matter, but they overlook where many teams lose time. Reporting is one of the biggest operational leaks in agency work because it repeats every month, touches multiple people, and breaks whenever one data source changes. A client report that takes small bits of effort from an account manager, specialist, and ops lead is still expensive, even if nobody logs it properly.
Industry data backs that up. 56.1% of agencies cite inefficient processes as the primary obstacle to organizational success, according to the 2025 Advertising Agency Report from Basis. That should sound familiar to any team rebuilding the same report pack over and over.
The real bottleneck is process design
The problem usually isn't that your team is lazy or that clients ask for too much. The problem is that the reporting process was built for five clients and now has to support twenty, or fifty, with the same patchwork system.
Common signs show up fast:
- Manual copy-paste work: Numbers move from ad platforms into slides or sheets by hand.
- Scattered client data: Paid media, analytics, SEO, call tracking, and CRM data all live in separate tools.
- Version confusion: Teams aren't sure which report is the current one.
- Branding cleanup: Client-facing reports need a final pass just to look on-brand.
If that's your setup, efficiency measurement has to include the reporting workflow itself. The question isn't only whether campaigns are efficient. It's whether your agency can produce trusted, branded client reporting without eating margin every month.
Practical rule: Measure the work it takes to produce the report, not just the numbers inside the report.
A more scalable reporting system gives you room to do work that clients value. Strategy reviews get better. Account managers spend more time explaining movement and less time formatting charts. Ops can standardize delivery instead of chasing one-off fixes.
That's why efficiency measurement, for agencies, starts with reporting operations. If your process is messy, your performance conversation will be messy too. A cleaner digital agency workflow fixes more than admin pain. It changes how the whole agency scales.
Core Efficiency KPIs Every Agency Should Track
Most agencies don't need more KPIs. They need fewer KPIs that tie to clear decisions.
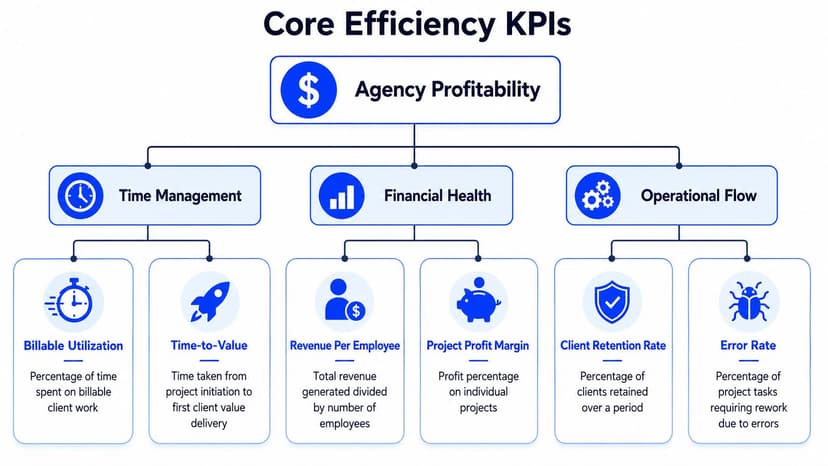
If you track everything, nobody knows what matters. If you track too little, you miss delivery, margin, or retention problems until they hurt. A useful efficiency measurement setup usually combines client performance, internal economics, and process health.
Start with a simple efficiency baseline
At its simplest, an efficiency metric is a productivity ratio. It's calculated by dividing total output by total input, as explained in this efficiency ratio overview. In agency terms, that can mean leads per ad dollar, qualified calls per landing page variant, or reports delivered per ops hour.
That simple framing is useful because it stops teams from overcomplicating the basics. If the input goes up and the output stays flat, you have an efficiency problem. If the output rises but it doesn't connect to the client's commercial goal, you may have an effectiveness problem, which comes later.
Group KPIs by decision type
The cleanest setup I've seen is to group KPIs by the decisions they support.
| KPI group | Example KPI | Simple formula | What it helps you decide |
|---|---|---|---|
| Client-facing | CPA | Total ad spend / total acquisitions | Whether a channel is acquiring efficiently |
| Client-facing | ROAS | Revenue / ad spend | Whether paid media is returning enough value |
| Internal | Revenue per employee | Total agency revenue / total employees | Whether the team structure supports growth |
| Internal | Project profit margin | (Project revenue - project cost) / project revenue | Whether delivery is priced and staffed properly |
| Operational | Report throughput | Reports delivered / reporting period | Whether the reporting system is scaling |
| Operational | Rework rate | Tasks needing correction / total reporting tasks | Whether process quality is slipping |
Agencies that want a broader refresher on KPI design should also look at this breakdown of strategic key performance indicators for your business. It's a helpful reminder that not every metric deserves executive attention.
A second useful split is this:
- Client value KPIs: CPA, ROAS, conversion rate, qualified leads, cost per qualified lead.
- Agency health KPIs: Revenue per employee, project margin, client retention, average account load.
- Delivery KPIs: Report completion status, data-source health, turnaround time, revision count.
Keep the KPI set tight
A dashboard should help an account manager answer a short list of questions fast.
- Is the client getting results? Use performance KPIs tied to the service being delivered.
- Is the account healthy for the agency? Use margin and delivery-effort metrics.
- Is the reporting process reliable? Use operational checks, not just outcome charts.
A good KPI earns its place by changing a decision. If the number never changes what the team does, it probably doesn't belong on the main dashboard.
For agencies running recurring reporting, it also helps to standardize naming, formulas, and chart logic across clients. Otherwise, every account becomes a custom analytics project.
A shared KPI library matters more than another spreadsheet tab. If your team needs a reset on definitions, this guide to marketing KPIs is a good reference point for standardizing what goes into client reporting.
Beyond Basic KPIs Measuring What Truly Matters
Agencies get into trouble when they confuse efficient activity with meaningful progress.
A campaign can produce a lower CPA this month and still move the client in the wrong direction. That happens when the team squeezes easier conversions, narrows targeting too aggressively, or cuts upper-funnel work that supports future demand. The dashboard looks cleaner. The business case gets weaker.
Efficiency is not the same as effectiveness
This gap shows up everywhere in agency reporting. TrinityP3 puts it plainly: modern marketers are "overwhelmed with data but still struggle to prove business impact" in its analysis of the effectiveness gap in marketing measurement.
That's the blind spot. Agencies report tactical efficiency because it's easier to pull from platforms. Clients still need help understanding whether those efficient tactics support bigger goals like revenue quality, sales progression, or market share.
A practical example:
- Paid search CPA improves.
- Branded search volume stays flat.
- Sales quality drops.
- CRM progression slows.
- The agency report still says performance improved.
That's not a reporting win. It's a reporting mismatch.
Build a measurement ladder
The fix is to stack metrics instead of treating every number as equal.
Start with activity metrics, then connect them to performance metrics, then to business outcome signals. The exact stack changes by client, but the principle stays the same.
Activity layer
Spend, clicks, impressions, published content, launched campaigns.Efficiency layer
CPA, CPL, conversion rate, cost per booked call, landing page conversion rate.Effectiveness layer
Sales-qualified leads, pipeline quality, revenue contribution, retention quality, broader commercial movement.
This changes the client conversation. Instead of saying, “We improved efficiency,” you can say, “We improved efficiency in a way that supports the outcome you hired us for.”
Report tactical KPIs as evidence, not as the final verdict.
Agencies that do this well usually keep the top layer small. A client doesn't need twenty business metrics in the monthly review. They need a short set of outcome signals and a clear line back to the channel work.
That's the point of efficiency measurement in an agency context. It isn't only about doing the reporting faster. It's about making sure the numbers point to the work that actually matters.
Common Pitfalls in Efficiency Measurement and How to Avoid Them
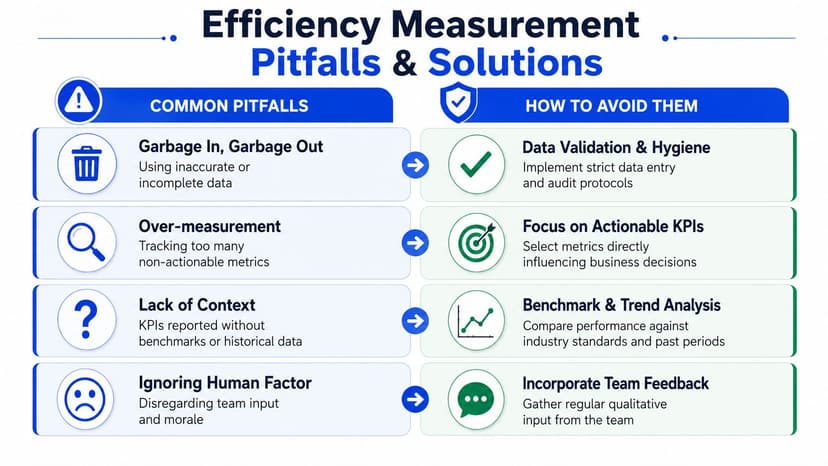
The biggest reporting mistake isn't choosing the wrong chart. It's trusting data that hasn't been checked.
Agencies often build polished dashboards on top of shaky tracking. The result looks professional, but the logic underneath is brittle. One broken UTM rule, one misfiring conversion event, or one mismatch between CRM and ad platform naming can make the report wrong in ways that are hard to spot.
Bad inputs ruin good looking dashboards
This is the trap behind the data quality vs. metric volume problem. A 2026 maturity framework described by Improvado says 5 critical data paths must be validated, and if any fail, all downstream metrics are invalidated. The same piece calls out checks such as CAC by channel and UTM-CRM matching in its guide on measuring marketing performance.
That's the right order of operations. Validate first. Expand later.
Here's what usually breaks in agency reporting:
- Channel attribution drift: UTM naming changes between campaigns, teams, or months.
- Conversion mismatch: Platform conversions don't line up with website events or CRM records.
- Financial disconnect: Ad spend, lead counts, and closed revenue aren't using the same logic.
- Journey gaps: Form fills, calls, offline updates, and CRM stages sit in separate systems.
What to validate before you trust a report
You don't need a data engineer to catch a lot of this. Account managers and ops leads can run a simple validation pass before reports go out.
| Check | What to look for | Why it matters |
|---|---|---|
| UTM review | Consistent source, medium, campaign naming | Keeps channel reporting usable |
| Conversion check | Key events firing where expected | Prevents false wins or false drops |
| CRM match check | Lead records align with campaign source data | Connects media performance to outcomes |
| Spend sanity check | Platform spend aligns with reporting totals | Avoids finance and client trust issues |
A few working rules help:
- Check one path end to end: Click to session, session to lead, lead to CRM, CRM to reported outcome.
- Compare trend shape, not just totals: If leads doubled but sales quality didn't move, inspect the handoff.
- Flag unknowns early: It's better to tell a client a tracking issue exists than to explain a wrong report later.
Watch for this pattern: dashboards get more detailed as confidence in the underlying data gets worse.
Another common mistake is over-measurement. Teams add widgets for every platform metric because empty screen space feels wasteful. It isn't helpful. A dashboard full of numbers nobody acts on becomes wallpaper.
The fix is boring, and that's why it works. Validate the inputs. Limit the KPI set. Add context and notes where the data needs interpretation. Efficiency measurement only helps if the team trusts the numbers enough to make decisions from them.
From Spreadsheets to Dashboards Choosing Your Reporting System
Spreadsheets work longer than they should. That's why so many agencies stay with them.
At first, they're flexible. Then each new client adds another tab, another workaround, another manual import, and another branded slide deck that someone has to clean up before sending. What started as a cheap reporting system turns into a recurring ops tax.
What changes when the client count grows
The pressure gets worse when clients want cross-channel reporting in one place. Agencies say that integrated tool data, including source tracking, call budgets, and automated summaries, is the most common reporting enhancement sought in 2025, according to CallRail's 2025 outlook for marketing agencies. That points straight at the real issue. Fragmented channel data keeps KPI tracking harder than it should be.
A reporting system for agencies has to do more than show charts. It has to support:
- White-label client reporting: Branded dashboards and reports that look like your agency.
- Multi-client management: One setup that can be repeated cleanly across accounts.
- Automated delivery: Reports that go out on schedule without manual rebuilding.
- Custom domain support: A client-facing experience that doesn't send people through mismatched URLs.
If you're still stitching together exports, slides, and sheet formulas, moving from Excel is usually less about features and more about consistency. This practical look at migrating from Excel to Oviond captures that shift well.
How the common options compare
Most agencies end up looking at the same shortlist: AgencyAnalytics, Whatagraph, Swydo, Looker Studio, and purpose-built reporting software built for agency workflows.
Each has trade-offs.
| Tool type | Strength | Common friction for agencies |
|---|---|---|
| Spreadsheets | Flexible and familiar | Manual updates, version control, weak branding |
| Looker Studio | Customizable | Setup complexity, connector sprawl, maintenance overhead |
| AgencyAnalytics / Whatagraph / Swydo | Reporting-focused workflows | Feature fit and pricing structure vary by agency setup |
| Oviond | White-label client reporting and dashboard software built for agencies | Better fit when you want simpler setup, branded dashboards, custom domain options, pricing by client count, and unlimited reports, dashboards, and users in one plan |
For SEO-specific reporting needs, this guide for agencies on SEO reporting is worth reading because it shows how quickly reporting complexity grows once search data joins paid and analytics reporting.
The practical decision is simple. If your team spends more energy maintaining the reporting system than using it, the system is costing more than it looks. Agency reporting that finally feels simple usually comes from using software designed for white-label, recurring, multi-client delivery instead of forcing a generic BI stack to behave like an agency tool.
Building Your Efficiency Dashboard in Oviond
A useful efficiency dashboard doesn't start with a template. It starts with the questions your team needs to answer every week and every month.
For most agencies, those questions are operational before they're analytical. Which clients are on track. Which accounts need intervention. Which reports are ready. Which metrics are tied to actual goals instead of platform noise.
Build the dashboard around agency decisions
Start with one dashboard for one client type. Don't try to solve every service line in one pass.
A practical structure looks like this:
Top-row health checks
Put the core client KPIs first. CPA, ROAS, leads, qualified calls, or pipeline-related signals, depending on the engagement.Delivery efficiency layer
Add the internal metrics your team uses to run the account. This might include custom calculated metrics such as revenue per hour, cost per qualified lead, or lead-to-sale progression.Goal tracking
Set targets on the handful of metrics that define success for the client. A dashboard should show progress against target, not just a pile of current-period numbers.Narrative space
Keep room for notes, flags, and context. Agencies lose trust when the chart changes but nobody explains why.
A strong starting point is a reusable digital marketing dashboard template that can be adapted by client type instead of rebuilt from scratch each time.
Use automation without giving up control
Tooling begins to matter significantly. In 2025, 49% of agencies, brands, and publishers are using or planning to adopt solutions to mitigate AI adoption challenges, according to the IAB's State of Data 2025 report. That matters because agency teams don't just need dashboards. They need setup help that reduces integration friction across analytics, ads, and CRM data.
Oviond fits well here as a practical agency option because it combines white-label reporting, branded dashboards, automated delivery, custom domain support, 70+ integrations, calculated metrics, goals, unlimited reports, unlimited dashboards, unlimited users, and AI/MCP-assisted setup in one plan priced by client count. That combination makes sense for agencies trying to standardize recurring client reporting without dragging a BI project behind them.
A few implementation habits make the rollout smoother:
- Build by service package: Keep separate reporting templates for SEO, paid media, and multi-channel retainers.
- Standardize metric definitions: Lock formulas before you clone dashboards across accounts.
- Use branded delivery from day one: White-labeling works better when clients never see a mixed setup.
- Automate the send, not the thinking: Scheduled delivery should handle the admin. Your team should still add notes where context matters.
Here's a quick product walkthrough that helps make the setup more concrete:
The goal isn't to make reporting flashy. It's to make it dependable. When dashboards are always-current, client-facing, and easy for the team to manage, efficiency measurement becomes part of delivery instead of a separate admin burden.
Making Efficiency Measurement Your Agency's Superpower
Agencies don't win by measuring more. They win by measuring the things that help them act faster, explain value better, and run delivery with less friction.
That means two shifts. First, stop treating efficiency measurement as a narrow exercise in utilization and platform KPIs. Second, stop trusting any dashboard that sits on unvalidated data. Those two mistakes waste more time than most agencies admit.
The upside is practical. A solid reporting system improves client conversations, sharpens ops decisions, and makes growth less chaotic. It also gives your team more room for strategy work instead of repetitive reporting cleanup.
If you're also thinking about how AI-assisted process design fits into agency operations more broadly, this look at an AI automation agency is a useful outside perspective on where workflow automation is heading.
Agency reporting that finally feels simple comes from process discipline, tight KPIs, and software that matches how agencies work.
If your agency is juggling manual monthly reports, scattered client data, and a growing list of accounts, Oviond is a practical next step for white-label client reporting, branded dashboards, automated delivery, and multi-client reporting that scales without spreadsheet chaos.
Related articles
Simplify marketing reporting today
Stop juggling multiple tools. Start presenting clear, automated reports your clients will love