Oviond Blog
Comprehensive Guide to Google Looker Studio for Digital Marketers
Google Looker Studio empowers marketers to craft dynamic dashboards and gain actionable insights.

Mastering Google Looker Studio
Google Looker Studio (formerly Google Data Studio) has emerged as a game-changing platform for visualizing and analyzing marketing data. As the evolution of data looker technologies continues, this powerful tool has become indispensable for marketing professionals seeking to transform raw data into actionable insights.
This comprehensive guide will walk you through everything you need to know about Looker Studio, from basic setup to advanced features that will revolutionize your reporting workflow.
“With Looker Studio , you can craft compelling data narratives that empower decision-making and help you uncover opportunities hidden in your metrics. “
Understanding Google Looker Studio
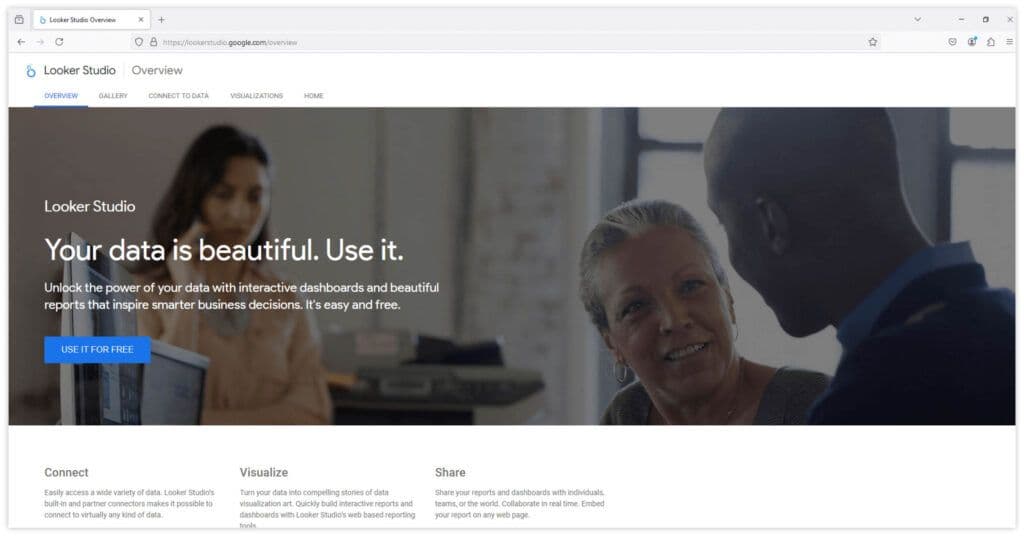
Google Looker Studiois the evolution of Google Data Studio, offering advanced tools to transform raw numbers into actionable insights. This free, web-based platform integrates seamlessly with your marketing data sources, enabling the creation of dynamic dashboards and detailed reports. With Looker Studio, you can craft compelling data narratives that empower decision-making and help you uncover opportunities hidden in your metrics.
The Evolution to Looker Studio
The transition from Google Data Studio to Looker Studio in October 2022 marked a pivotal evolution in Google’s business intelligence portfolio. This change followed Google’s acquisition of Looker, a move that significantly expanded the platform’s capabilities. With the rebranding to lookerstudio.google.com, marketers gained access to enhanced features and tighter integration within Google’s ecosystem, solidifying Looker Studio as a must-have tool for advanced data visualization and reporting.
Key Benefits for Marketers
| Key Benefits for Marketers | Details |
|---|---|
| 🌐Comprehensive Data Integration | – Connect to 800+ data sources– Seamless integration with Google Analytics, BigQuery, and other tools– Real-time data updates for timely decision-making |
| 💡User-Friendly Interface | – Intuitive drag-and-drop functionality– Customizable templates and layouts– Accessible for team members of all technical skill levels |
| 📊Advanced Visualization Options | – Interactive dashboards and reports– Custom charts and graphs– Dynamic data filtering capabilities |
| 🤝Collaborative Features | – Real-time sharing and editing– Team-wide access controls– Version history and change tracking |
| 💰Cost-Effective Solution | – Robust free version available– Competitive pricing for premium features– Scalable for growing organizations |
In the following sections, we’ll dive deep into each aspect of Looker Studio, providing you with practical insights and examples. Let’s take a look at the core features and functionality of Looker Studio, highlighting how these benefits translate into actionable tools for your business.

Core Features and Functionality of Google Looker Studio
Google Looker Studio offers a robust set of features designed to transform your marketing data into meaningful insights. Understanding these core functionalities will help you create more impactful reports and make data-driven decisions.
📋Dashboard Creation
Creating powerful dashboards in Looker Studio is straightforward and intuitive. Whether you’re new to data visualization or an experienced analyst, the platform provides all the tools you need to build compelling reports.
Key Dashboard Features:
- Drag-and-drop interface for easy layout design
- Extensive customization options for branding consistency
- Interactive elements for dynamic data exploration
- Real-time data updates for current insights
- Multiple page support for organized reporting
📈Visualization Options
Looker Studio’s visualization options are designed to cater to both basic and advanced reporting needs, with added flexibility through community-driven innovations. Standard charts provide a solid foundation for everyday reporting, focusing on clarity and simplicity for quick insights.
Advanced visualizations take this further, allowing users to explore complex data relationships, track performance metrics, and analyze granular details. Community visualizations introduce a dynamic layer of customization, enabling users to create unique, purpose-built visual tools that adapt to specific business challenges, pushing the boundaries of traditional reporting.
Looker Studio’s visualization capabilities help you to present data in the most effective way possible:
| Category | Visualization Type | Purpose |
|---|---|---|
| Standard Charts | Bar and column charts | Comparisons |
| Line graphs | Trend analysis | |
| Pie charts | Composition views | |
| Area charts | Cumulative trends | |
| Advanced Visualizations | Geo maps | Location-based data |
| Scatter plots | Correlation analysis | |
| Gauge charts | KPI tracking | |
| Pivot tables | Detailed data analysis | |
| Community Visualizations | Custom visualization types | Access to unique visual formats |
| Enhanced charting capabilities | More advanced visual features | |
| Specialized reporting options | Tailored insights for reporting |
🔗Data Blending Capabilities
One of Looker Studio’s most powerful features is its ability to blend data from multiple sources into cohesive reports. This functionality allows you to:
- Combine data from different platforms (e.g., Google Analytics with Facebook Ads)
- Create custom metrics across data sources
- Generate comprehensive cross-channel insights
- Build unified marketing performance views
📱Mobile Optimization
The Looker Studio dashboard is fully optimized for mobile, ensuring your reports are accessible anywhere. Its responsive design adapts to any screen size, and the touch-friendly interface makes navigation effortless. Whether using Looker Studio on your phone or tablet, optimized loading times and interactive features ensure smooth performance, empowering you to analyze data seamlessly on the go with Google Looker Studio.

🎨Customization Options
Looker Studio provides extensive branding and design customization options to align with your brand identity. You can personalize themes with custom color palettes, font styles, layout templates, and background options. Additionally, it allows for detailed element design, including chart styling, custom headers and footers, image and logo placement, and text formatting, ensuring your visuals reflect your brand’s unique look and feel.
🖱️Interactive Elements
Enhance user engagement with interactive features that make your data more accessible and actionable. Looker Studio offers tools like date range selectors, drop-down filters, and dynamic parameter controls, allowing users to explore data in real time. Additionally, clickable elements enable drill-down analysis, providing deeper insights with just a click.
Advanced Features for Power Users
For those looking to push the boundaries of what Google Looker Studio can do:
| Feature | Details |
|---|---|
| Calculated Fields | – Create custom metrics– Apply complex formulas– Develop conditional formatting– Build advanced calculations |
| Data Control Options | – Filter controls– Parameter inputs– Dynamic field selection– Cross-filtering capabilities |
Advanced features in Google Looker Studio provide users with greater flexibility and control, enabling them to tailor dashboards to specific business needs. These tools enhance decision-making by allowing deeper customization, from creating unique metrics to applying dynamic filters. Power users benefit from more interactive and precise reporting, making their data analysis more impactful and efficient.
After exploring Google Looker Studio’s powerful features, let’s delve into best practices to maximize their potential and create impactful, efficient dashboards.
Advanced Data Analysis Techniques
To fully leverage Google Looker Studio’s advanced features, it’s essential to implement best practices that enhance performance, optimize resource management, and ensure seamless collaboration.
Performance Optimization
- Report Efficiency: Minimize data requests by selecting only necessary fields and applying filters to reduce dataset size. Optimize refresh rates to balance data freshness with performance. Utilize data sampling for large datasets to improve responsiveness. Implement caching strategies to decrease load times.
- Resource Management: Monitor usage limits to prevent overconsumption of resources. Balance report complexity to maintain usability and performance. Plan for scalability to accommodate growing data volumes. Implement timeouts to handle long-running queries effectively.
Documentation and Maintenance
- Version Control: Track changes meticulously to maintain a clear history of modifications. Document updates comprehensively to provide context for future reference. Maintain regular backups to safeguard against data loss. Thoroughly test new features before deployment to ensure stability.
- Team Communication: Share best practices across the team to promote consistency. Document procedures clearly to facilitate onboarding and knowledge transfer. Provide training for team members to enhance proficiency. Establish and enforce standards to ensure quality and uniformity.
By mastering these advanced practices, you can create sophisticated, insightful, and engaging reports that drive informed business decisions. Next, let’s explore best practices for implementing these powerful features effectively.
Best Practices for Feature Implementation
✅Start with Clear Objectives
To maximize Looker Studio’s capabilities, begin by defining your reporting goals and identifying the key metrics that matter most to your analysis. Plan your dashboard layout strategically, ensuring it meets the needs of your audience while maintaining a clear and logical flow.
✅Optimize Performance
Ensure your dashboards perform efficiently by limiting the number of visualizations per page and using optimized data connections. When handling large datasets, implement data sampling where necessary, and regularly clear the cache to keep your reports responsive.
✅Maintain Consistency
Consistency is key for professional-looking dashboards. Use standardized naming conventions, create reusable template styles for a cohesive design, document any custom calculations for future reference, and establish regular update schedules to keep your data fresh and accurate.
By mastering these features and following best practices, you’ll be well-equipped to create powerful, insightful reports that drive better marketing decisions. Now that you understand the potential of Looker Studio, let’s explore how to get started with this dynamic tool.
Getting Started with Google Looker Studio
Now that you’ve seen the potential of Looker Studio, it’s time to dive in and start exploring its capabilities firsthand. Here are the steps we’ll cover:
- Signing Up: Visit lookerstudio.google.com and sign in with your Google account to access Looker Studio.
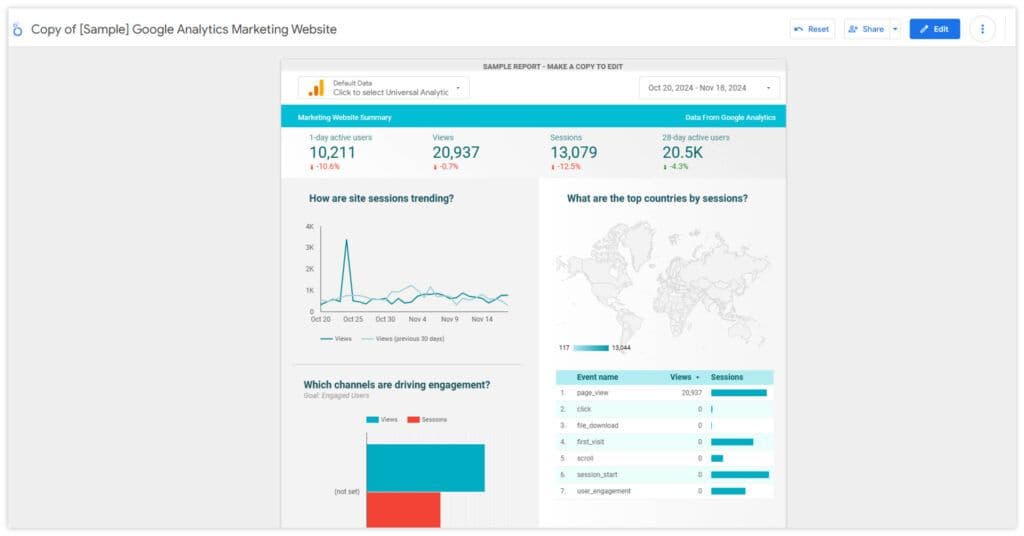
- Exploring Templates: Start by exploring the template gallery to get ideas and inspiration for your own reports.
- Connecting Data Sources: Begin with familiar data sources like Google Analytics or Google Ads to create your first dashboard.
- Playing around: Don’t be afraid to experiment with different chart types, layouts, and customization options to find what works best for your data.
- Joining the Community: Engage with the Looker Studio community to learn from others and share your own experiences.
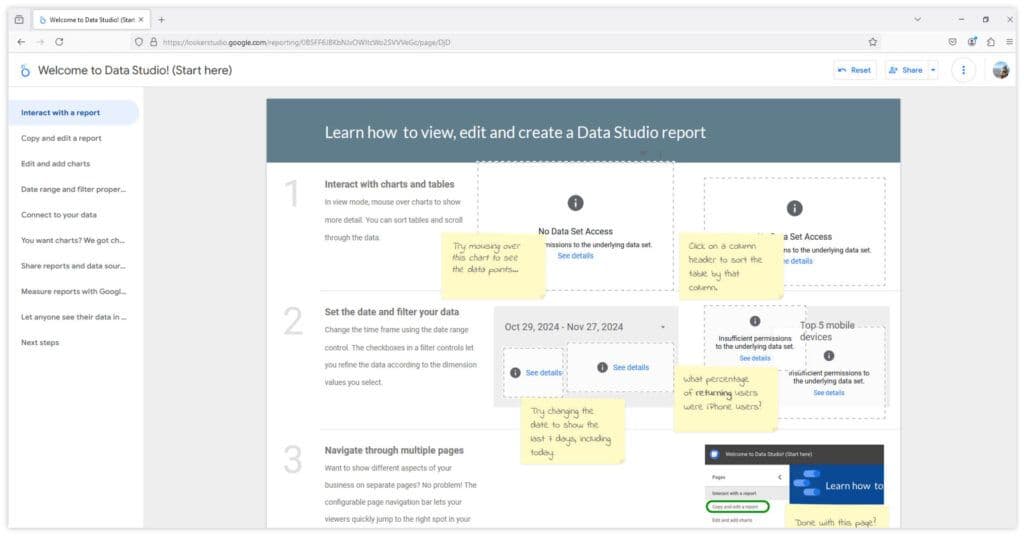
Getting started with Google Looker Studio is straightforward. By following these simple steps, you’ll be creating powerful data visualizations in no time.
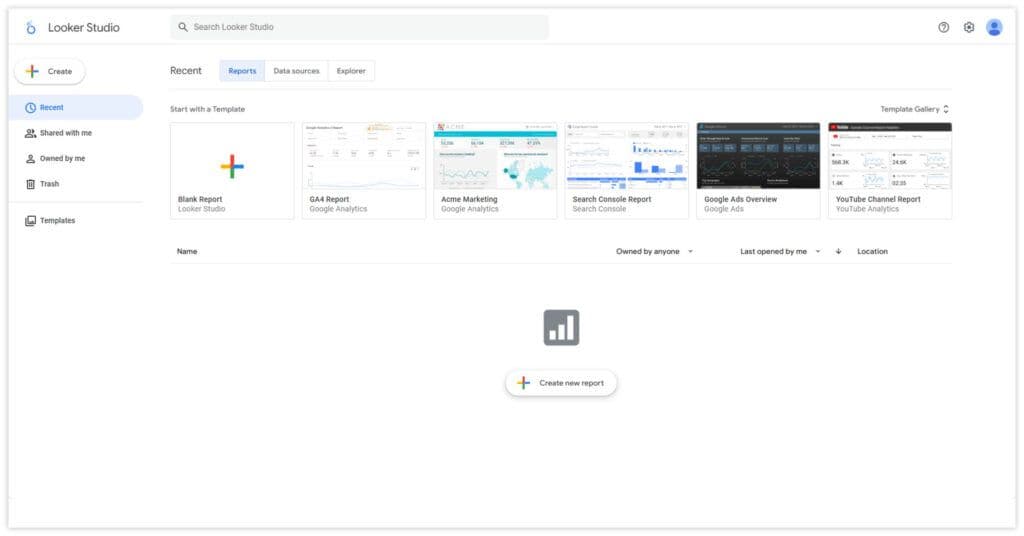
Step 1: Accessing the Platform
Navigate to Looker Studio
- Open your web browser
- Go to lookerstudio.google.com
Sign In Process
- Click the Use it for Free button
- Use your Google account credentials
- If you’re already signed into Google services, you may be automatically logged in
- For business users, sign in with your Google Workspace account
Step 2: Understanding the Interface
Once you’ve signed in to Looker Studio, you’ll encounter an intuitive interface designed for ease of use:
| Section | Details |
|---|---|
| Homepage Elements | – Recent reports section– Template gallery access– Create new report button– Sample reports for inspiration |
| Navigation Features | – Left sidebar for quick access to tools– Top menu bar for essential functions– Search functionality for finding reports– Resource links and help options |
To help you become familiar with the interface, here’s a concise YouTube video that explains the essentials of Looker Studio:
Looker Studio in a minute
Step 3: Creating Your First Report
- Click Create in the top-left corner then Report OR click Blank Report in the gallery
- Choose between:
- Blank report for custom builds
- Template for pre-designed layouts
- Template for a specific data integration
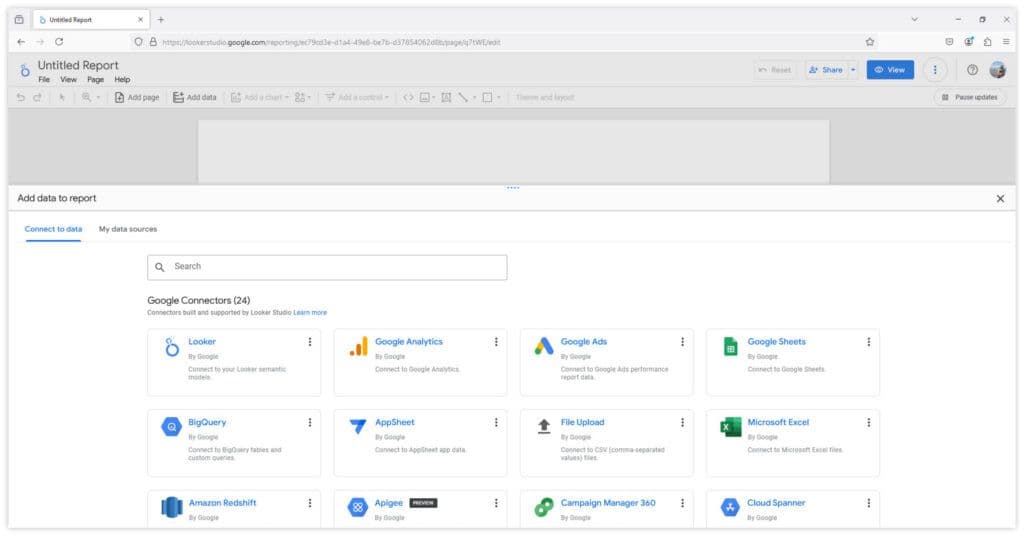
Step 4: Connect Data Sources
-
A slide panel will show data integration options to choose from
-
Choose from available connectors in the Connect to Data tab
-
Popular options include:
- Google Analytics
- Google Ads
- BigQuery
- Spreadsheets
- MySQL databases
-
Configure connection settings by granting the necessary permissions
-
In the bottom right, click Add
Step 5: Build Your Dashboard
- Add Visualizations
- Select chart types from the toolbar
- Drag and drop elements onto the canvas
- Configure data settings for each chart
- Customize Layout
- Arrange elements on the page
- Adjust sizes and positions
- Add text and explanatory elements
By familiarizing yourself with these basic features and customization options, you’ll be well-equipped to start creating insightful and visually appealing reports in Looker Studio. As you become more comfortable with the platform, you can explore more advanced features to further enhance your data visualization capabilities.
Essential Setup Tips:
⚙️📈 Optimize Your Workflow
- Create a logical organization system for reports
- Use consistent naming conventions
- Set up folder structures for different clients or departments
- Save frequently used data source connections
🔒🤝Security and Sharing
- Review access permissions regularly
- Set up appropriate sharing settings
- Understand user role limitations
- Implement data source restrictions as needed
🚀📊Performance Considerations
- Start with essential metrics only
- Add complexity gradually
- Test loading times with different data ranges
- Monitor resource usage
Maintenance and Updates
Regular maintenance and updates are essential to ensure that your Looker Studio dashboards remain accurate, efficient, and aligned with business objectives. Implementing a structured review process and timely content updates can significantly enhance dashboard performance and user satisfaction.
Regular Review Process
- Performance Monitoring: Regularly assess dashboard load times, query execution speeds, and overall responsiveness. Utilize Looker’s System Activity dashboards to monitor query performance and identify bottlenecks.
- Usage Analytics: Analyze user interaction data to understand which dashboards and reports are most utilized. This insight helps prioritize maintenance efforts and identify underused components that may need optimization or decommissioning.
- Error Logging: Implement error tracking mechanisms to promptly detect and address issues such as broken data connections or visualization errors. Proactive error management minimizes downtime and maintains data integrity.
- User Feedback: Encourage users to provide feedback on dashboard functionality and relevance. Regularly reviewing this feedback allows for continuous improvement and ensures the dashboards meet user needs.
- System Health Checks: Conduct routine evaluations of data source connections, integration points, and system resources to prevent potential disruptions. Regular health checks ensure the reliability and stability of the dashboard environment.
“Implementing a structured review process and timely content updates can significantly enhance dashboard performance…”
Content Updates
- Data Accuracy Checks: Regularly validate the data displayed in dashboards against source systems to ensure accuracy. Implement automated data validation processes where possible to maintain trust in the reported information.
- Metric Relevance Review: Periodically assess the relevance of displayed metrics to current business goals. Update or replace outdated metrics to ensure the dashboard provides actionable insights.
- Design Improvements: Stay informed about best practices in data visualization and user interface design. Apply these practices to enhance dashboard readability and user engagement. Datatonic
- Feature Updates: Leverage new features and functionalities released in Looker Studio to improve dashboard capabilities. Regularly update dashboards to incorporate these enhancements, providing users with the latest tools for data analysis.
- Documentation Updates: Maintain comprehensive documentation for each dashboard, detailing data sources, metric definitions, and user instructions. Regularly update this documentation to reflect any changes, ensuring users have access to accurate and current information.
Learn more tips for optimizing performance, refreshing designs, and aligning metrics with goals by reading Datatonic’s article here.
By implementing these maintenance and update practices, you can ensure that your Looker Studio dashboards remain effective tools for delivering meaningful insights and driving business success.
Common Setup Challenges and Solutions
Setting up Google Looker Studio effectively is key to unlocking its full potential. By addressing common challenges proactively, you can ensure a seamless experience, improve dashboard performance, and maintain accurate, real-time insights to support data-driven decisions.
| Challenge | Problem | Solutions |
|---|---|---|
| Connection Issues | Unable to connect to data sources | – Verify account permissions – Check data source credentials – Clear browser cache – Use incognito mode to test |
| Loading Performance | Slow dashboard loading | – Reduce the number of visualizations – Implement date range filters – Use data sampling when appropriate – Optimize data source queries |
| Data Refresh Issues | Outdated data displaying | – Check data source refresh settings – Verify connection status – Clear cache and refresh – Review update schedules |
Next Steps After Setup
1. Explore Advanced Features
- Experiment with calculated fields
- Try different visualization types
- Test data blending capabilities
- Explore community visualizations
2. Learn Best Practices
- Review the help documentation
- Watch tutorial videos
- Join community forums
- Practice with sample data
3. Plan for Growth
- Document your setup process
- Create templates for future use
- Establish report standards
- Build a knowledge base for your team
You are now well-positioned to leverage the full power of Google Looker Studio for your reporting needs. Remember that mastery comes with practice, so don’t hesitate to experiment with different features and configurations as you become more comfortable with the platform.

Mastering Data Integration in Google Looker Studio
Understanding Data Source Connections
Google Looker Studio’s power lies in its ability to connect with multiple data sources, creating a unified view of your marketing performance. Let’s explore how to maximize these integration capabilities.
Core Data Source Integration
Looker Studio offers seamless integration with over 1,000 data sources, enabling comprehensive and dynamic reporting. Here’s an overview of key integrations:
Google Services Integration
- Google Analytics 4 (GA4): Monitor website and app performance with real-time analytics.
- Google Ads: Track advertising campaigns and measure ROI effectively.
- Google Sheets: Utilize spreadsheets for flexible data management and reporting.
- YouTube Analytics: Analyze video performance metrics to optimize content strategy.
- Search Console: Gain insights into website search performance and SEO effectiveness.
Database Connections
- BigQuery: Handle large datasets with Google’s fully managed data warehouse.
- MySQL: Connect to open-source relational databases for structured data analysis.
- PostgreSQL: Access advanced relational database systems for complex queries.
- Amazon Redshift: Integrate with Amazon’s data warehouse for scalable analytics.
Marketing Platform Integration
- Facebook Ads: Measure and analyze social media advertising campaigns.
- LinkedIn Ads: Evaluate professional network advertising performance.
- X (Twitter) Ads: Assess engagement and effectiveness of Twitter ad campaigns.
- SEMrush: Incorporate SEO and competitive analysis data into reports.
- Screaming Frog: Integrate website crawling data for in-depth SEO audits.
By leveraging these integrations, Looker Studio empowers users to create unified dashboards that provide actionable insights across multiple platforms, enhancing data-driven decision-making.
Setting Up Key Integrations
Explore some of the most popular data source integrations and learn how to seamlessly connect them to Looker Studio for streamlined data visualization and storytelling.
Google Analytics 4 (GA4)
Maximize your GA4 data analysis with Looker Studio’s specialized features:
Setting Up GA4 Reports
Connection Steps
- Access Google Analytics data source
- Select your GA4 property
- Choose relevant data streams
- Configure dimensions and metrics
Key Metrics to Track
- Engagement rate
- Event counts
- User behavior flow
- Conversion tracking
- Custom events
Advanced GA4 Features:
| Feature | Details |
|---|---|
| Custom Dimensions and Metrics | – Create calculated fields – Set up custom parameters – Design event-based metrics – Track user properties |
| Cross-Platform Analysis | – Combine web and app data – Track user journeys – Analyze conversion paths – Monitor cross-device usage |
BigQuery Integration
BigQuery integration with Looker Studio offers powerful data analysis capabilities:
Connection Setup
- Navigate to Add Data in Looker Studio
- Select BigQuery from the connector list
- Choose your Google Cloud project
- Select relevant datasets and tables and click Connect
| BigQuery | Tip/Practice |
|---|---|
| Optimization Tips | Use custom queries for efficient data retrieval |
| Implement data sampling for large datasets | |
| Create materialized views for complex queries | |
| Set up scheduled refreshes | |
| Best Practices | Structure queries for optimal performance |
| Use appropriate date partitioning | |
| Monitor query costs | |
| Implement proper access controls |
MySQL Connection Setup
For organizations using MySQL databases:
Basic Setup
- Select MySQL connector
- Enter database credentials
- Configure connection settings
- Test the connection
Performance Optimization for MySQL
- Index frequently queried fields
- Optimize query structure
- Use connection pooling
- Monitor response times
Salesforce Integration
Connect your Salesforce data for comprehensive reporting:
Initial Setup
- Choose Salesforce connector
- Authenticate your account
- Select objects to import
- Configure the Salesforce Campaigns action in Looker Studio
Key Features for Salesforce
- Real-time data sync
- Custom object support
- Field mapping options
- Historical data access
Connecting Google Sheets Integration
To integrate Google Sheets:
Setup Process
- Choose the desired Google Sheet and worksheet
- Click Connect to establish the connection
Using Connected Sheets for Looker
Connected Sheets for Looker allows users to explore data from LookML models directly in Google Sheets. To use this feature:
- From the Google Sheets Data menu, select Data Connectors and then Connect to Looker
- Enter your Looker instance name and select the desired model and Explore
- Click Connect to import the data structure into your sheet
Syncing Data Between Google Sheets and Looker Studio
To ensure data stays up-to-date:
- Set up automatic refresh schedules in Looker Studio
- Use Google Sheets’ IMPORTDATA function to pull live data from external sources
- Utilize Google Apps Script to automate data updates in your sheets
Best Practices for Google Sheets
- Use named ranges
- Implement data validation
- Structure data properly
- Monitor sheet size
Advanced Integration Techniques
Data Blending Strategies
How to Blend Data in Looker Studio
- In your Looker Studio report, click on Resources in the top menu, then select Manage blends.
- Click Add a blend to create a new blended data source.
- Select the data sources you want to combine (up to five tables).
- Choose the join key (a common dimension across your data sources).
- Select the appropriate join type (e.g., left outer join, inner join).
- Add the dimensions and metrics you want to include in your blended data.
- Click Save to create your blended data source.
Effectively combining data from multiple sources requires a structured approach. Start by planning your blend, which involves identifying key joining fields, determining the necessary metrics, planning data transformations, and considering appropriate refresh rates to ensure up-to-date information. During implementation, add your primary data source, configure the join conditions, and incorporate secondary sources while maintaining compatibility. Finally, test the accuracy of your blended data to validate its reliability and ensure it meets your analysis goals.
With a solid understanding of advanced integration techniques, it’s important to be prepared for potential challenges; the next section explores how to troubleshoot common integration issues and ensure a smooth data blending process.
For further information, see Looker Studio’s article on how to blend data.
“By mastering these integration capabilities, you’ll be able to create comprehensive, data-rich reports that provide valuable insights across all your marketing channels.”
Troubleshooting Common Integration Issues
While Looker Studio is a powerful tool, users may encounter issues from time to time. This section addresses common problems and provides solutions to help you navigate challenges effectively.
| Issue | Description | Solutions |
|---|---|---|
| Slow Dashboard Loading | Dashboards take several minutes to load or crash. | • Reduce the number of visualizations per page• Split complex dashboards into multiple pages• Use date range controls to limit data• Implement data sampling for large datasets• Use the Extract Data connector for faster performance |
| Data Connection Errors | Unable to connect to data sources or encountering error messages like “Missing data source.” | • Refresh the data source fields• Reconnect the data source• Remove and re-add the data source• Check your permissions• Verify that the underlying data structure hasn’t changed |
| Exceeding Script Limits | Error message: “There are too many scripts running simultaneously for this Google user account.” | • Limit the number of charts to 30 per page for partner connectors• Reduce simultaneous report refreshes• Upgrade to a Google Workspace account for higher limits |
| URL Fetch Calls Limit | Error message: “Service invoked too many times for one day: urlfetch.” | • Reduce the frequency of report refreshes• Upgrade to a Google Workspace account for higher limits (100,000/day vs. 20,000/day)• Add another Google Account to your team to distribute the load |
| Blending Issues | Incorrect data when blending multiple sources or errors related to join configurations. | • Verify that join keys are correctly set up• Ensure data types match across blended sources• Check for missing data in blended sources• Limit blends to a maximum of five data sources |
Integration Security Best Practices
Data Access Control: Proper permission management is essential for secure integrations. Set up role-based access to ensure users have appropriate privileges, review sharing settings regularly to prevent unauthorized access, implement data filters to restrict visibility of sensitive information, and monitor user activity to detect and address any suspicious behavior.
Security Measures: To safeguard your integrations, always use secure connections, encrypt sensitive data both in transit and at rest, conduct regular security audits to identify vulnerabilities, and document access policies to provide clear guidance on maintaining security.
Compliance Considerations: Ensuring compliance with data privacy regulations is critical. Follow GDPR guidelines or other relevant standards, implement data masking to protect sensitive information, set retention policies to manage the lifespan of data, and monitor data usage to ensure adherence to compliance requirements.
Documentation: Maintain clear and detailed documentation for effective integration management. Track data lineage to understand the flow of information, document integrations for future reference, maintain change logs to track system modifications, and create usage guides to assist users in navigating the integration securely and efficiently.
By mastering these integration capabilities, you’ll be able to create comprehensive, data-rich reports that provide valuable insights across all your marketing channels. Remember to regularly review and optimize your connections to ensure optimal performance and data accuracy.

Advanced Features and Data Storytelling in Google Looker Studio
What is Data Storytelling?
Data storytelling involves building a narrative around data and its visualizations to communicate its meaning in a compelling and actionable way. In Looker Studio, this process combines identifying key insights, creating a logical flow of information, selecting the right visualizations, and adding context to guide your audience.
Crafting Your Data Story in Looker Studio in 5 Steps
1. Start with a Clear Objective- Define the main message or insight you want to highlight.
- Identify your target audience and their data literacy level.
- Pinpoint key metrics that align with your narrative.
- Organize your data into a logical layout that flows naturally.
- Use a clear hierarchy of information to guide the viewer.
- Take advantage of Looker Studio’s multi-page functionality for detailed narratives.
- Match chart types (e.g., bar, line, or pie charts) to your data and message.
- Use color strategically to emphasize key points and ensure visual consistency.
- Add interactive elements, such as filters and drill-downs, to engage users.
- Include text boxes or callouts to explain complex points or trends.
- Highlight significant insights with annotations or labels.
- Define technical terms or metrics to help your audience understand the data.
- Incorporate filters, sliders, and date range selectors for deeper analysis.
- Use drill-down features to let users explore granular details.
- Link related data points with custom actions for seamless navigation.
Best Practices for Data Storytelling in Looker Studio
🎯 Keep it Simple: Focus on one main idea per page or section.
🎨 Maintain Consistency: Use a cohesive design and formatting style.
🏞️ Leverage White Space: Avoid overcrowding by giving elements room to breathe.
📖 Tell a Complete Story: Include context, insights, and actionable takeaways.
👥 Design for Your Audience: Cater to the expertise and interests of your viewers.
Advanced Data Storytelling Techniques
To create more engaging and insightful narratives in Looker Studio, consider these advanced techniques:
1. Scenario Analysis Create dynamic “what-if” scenarios using calculated fields to model various outcomes. By incorporating parameters, you can allow users to adjust variables and immediately visualize the impact of different decisions.
2. Comparative Storytelling Enhance your storytelling by blending data from multiple sources to enable side-by-side comparisons. Looker Studio’s data blending capabilities make it easy to highlight trends, differences, and correlations across datasets.
3. Temporal Narratives Showcase changes over time with time-based visualizations like line or bar charts. To give users flexibility, incorporate date range controls, allowing them to explore trends across different time periods and uncover long-term patterns.
4. Geospatial Storytelling Use map visualizations to bring location-based stories to life. Combine geographical data with metrics like revenue or population density to provide deeper insights into spatial relationships and trends.
By integrating these techniques into your dashboards, Looker Studio empowers marketers and analysts to craft data stories that go beyond simple reporting, fostering engagement, understanding, and actionable outcomes.
“Use color strategically to emphasize key points and ensure visual consistency. ”
Mobile Optimization for Looker Studio
Why Mobile Optimization Matters
Looker Studio ensures your data remains accessible and actionable, even on the go. With mobile-friendly features and responsive design, you can seamlessly view, interact with, and share your dashboards on any device.
Key Mobile Optimization Features
🖋️Mobile Design Best Practices
- Use single-column layouts for a clean, readable design.
- Incorporate touch-friendly elements for easy navigation.
- Ensure charts are responsive and maintain clarity on small screens.
- Simplify navigation for smoother mobile experiences.
⚡Performance Optimization
- Use lightweight visualizations to improve load times.
- Cache frequently accessed data for faster refreshes.
- Compress images to reduce file sizes and enhance performance.
🖐️Mobile-Specific Features
- Interactive Elements: Add swipe gestures, pinch-to-zoom, and touch-optimized filters for better user interaction.
- Accessibility Features: Implement large touch targets, clear typography, and high-contrast options for inclusive design.
Accessing Looker Studio on Mobile
While Looker Studio doesn’t have a standalone app, the mobile web browser offers robust functionality:
- Navigate to lookerstudio.google.com and sign in to access your dashboards.
- Dashboards automatically adjust for optimal viewing on smaller screens.
- For quick access, create a home screen shortcut on iOS or Android.
Best Practices for Mobile-Friendly Dashboards
To maximize usability on mobile devices:
- Simplify Layouts: Prioritize important metrics at the top and design for single-column viewing.
- Optimize Visualizations: Use simple, readable charts like bar or pie charts over complex visualizations.
- Limit Interactivity: Focus on essential filters to enhance performance and usability.
- Test Across Devices: Preview dashboards on multiple devices to ensure compatibility and smooth performance.
Features and Limitations of Looker Studio on Mobile
| Category | Details |
|---|---|
| Available Features | – Responsive design adapts to different screen sizes |
| – Touch-friendly interface supports navigation and filtering | |
| – Easy sharing options via mobile devices | |
| Limitations | – Editing dashboards is not optimized for mobile |
| – Some complex visualizations may be harder to interact with on small screens |
Enhance Accessibility Anywhere
By leveraging Looker Studio’s mobile-friendly capabilities, marketers can stay connected to their data, making informed decisions anytime, anywhere. With thoughtful design and optimization, you can ensure your dashboards perform seamlessly across devices.

Google Looker Studio for Digital Marketing: Real-World Applications
By understanding how to use Looker Studio for specific digital marketing applications, you’ll be equipped to create powerful dashboards that reveal key performance trends, optimize campaigns, and make data-driven decisions with confidence. Here’s how to leverage its capabilities across various facets of digital marketing:
Web Analytics Implementation
Looker Studio transforms web analytics data into insightful dashboards that enhance decision-making.
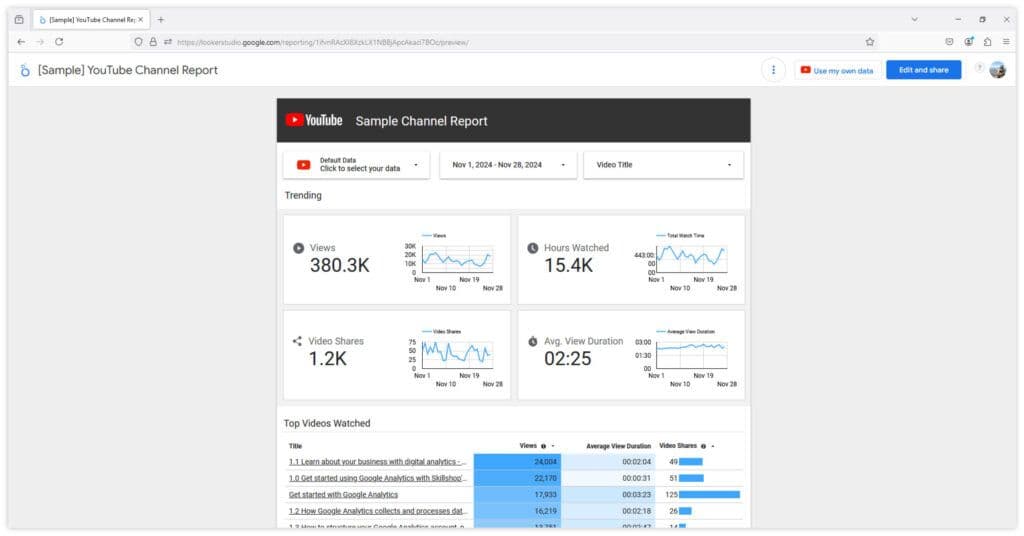
Use Case: Build GA4-powered dashboards to track traffic sources, user behavior, and goal completions in real-time. Example: A retail website uses Looker Studio to map the user journey, identify drop-off points in the checkout process, and improve conversion rates.
Advanced Analysis: Funnel visualizations and behavioral trend analysis provide insights into user intent, enabling smarter UX improvements.
Campaign Performance Monitoring
Create comprehensive dashboards to analyze multi-channel marketing campaigns.
Use Case: Combine data from Google Ads, Facebook Ads, and email campaigns into a single dashboard for cross-channel attribution. Example: A marketing agency monitors its clients’ paid and organic campaign performance, identifying which channels deliver the highest ROI and reallocating budget for efficiency.
Key Insights: A/B testing metrics, ROI tracking, and customer journey analysis help refine targeting strategies for future campaigns.
SEO Performance Tracking
Integrate Looker Studio with tools like SEMrush and Screaming Frog to monitor and improve search rankings.
Use Case: Create a technical SEO dashboard that tracks keyword trends, backlink profiles, and site audit data. Example: An e-commerce business visualizes Core Web Vitals and mobile usability metrics to optimize its site’s performance and improve rankings.
Impact: By regularly monitoring technical health and search visibility, brands can proactively address issues affecting organic traffic.
E-commerce Analytics
Track sales performance and shopping behavior with custom dashboards tailored to e-commerce.
Use Case: Monitor cart abandonment rates and product page performance to boost online sales. Example: An online fashion retailer uses Looker Studio to track average order value and customer lifetime value, helping them identify loyal customer segments.
Advanced Features: Dashboards display inventory tracking, seasonal trends, and product performance, helping e-commerce brands plan inventory and pricing strategies.
Social Media Analytics
Evaluate social media ROI and engagement metrics in a unified dashboard.
Use Case: Compare performance across platforms like Instagram, LinkedIn, and Twitter to identify audience overlap and engagement trends. Example: A SaaS company uses Looker Studio to analyze which platform drives the most qualified leads, optimizing its content strategy accordingly.
Deep Insights: Sentiment analysis, influencer impact, and brand mention tracking reveal how campaigns resonate with audiences.
Email Marketing Performance
Monitor email campaigns with metrics like open rates, click-through rates, and revenue attribution.
Use Case: Integrate email marketing tools like Mailchimp or HubSpot with Looker Studio to track customer journeys post-email engagement. Example: A subscription box service measures the impact of personalized email campaigns on subscriber retention and upsell opportunities.
Result: Optimize email content, improve segmentation, and increase conversions using actionable data.
Customer Experience Monitoring
Enhance customer satisfaction by tracking feedback and touchpoints.
Use Case: Create dashboards that map customer journeys, highlight pain points, and measure NPS scores. Example: A hospitality business uses Looker Studio to analyze customer feedback from surveys and support interactions, identifying trends to improve service quality.
Actionable Outcomes: By visualizing retention indicators and resolution metrics, businesses can proactively enhance customer satisfaction and loyalty.
These real-world applications show how Looker Studio helps marketers solve common challenges, drive smarter campaigns, and deliver meaningful business results. By integrating diverse data sources into visually compelling dashboards, Looker Studio enables actionable insights that truly transform marketing efforts.
Real-World Success Stories with Google Looker Studio
Google Looker Studio is revolutionizing the way businesses analyze and utilize their data. By enabling seamless integration, automation, and dynamic reporting, Looker Studio empowers companies across industries to make data-driven decisions that drive success. Below are real-world examples showcasing the transformative impact of Looker Studio.
Case Study 1: Wpromote – Accelerating Client Reporting
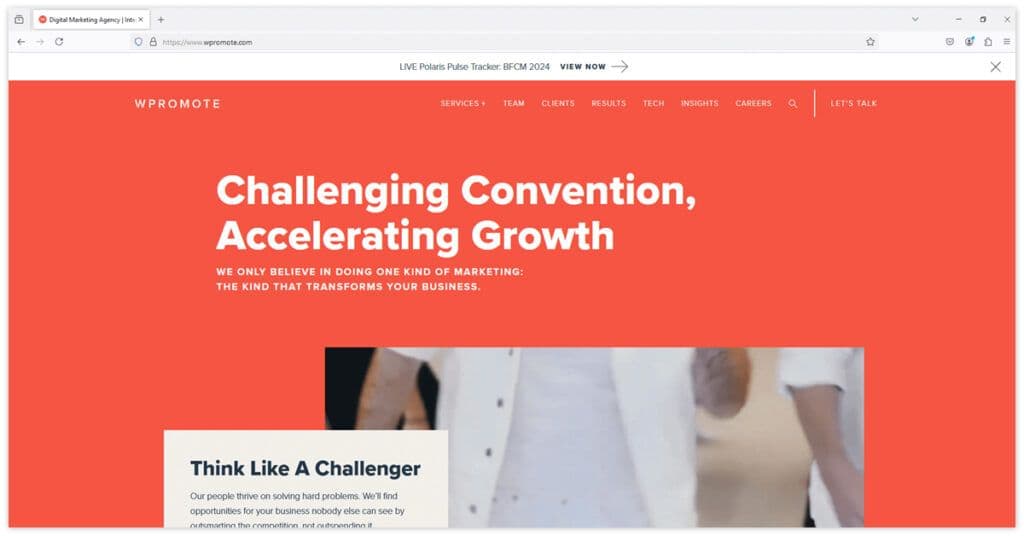
Wpromote, a leading digital marketing agency, faced a significant challenge in managing their reporting workflows. With custom reports taking over a month to set up for each new client, inefficiencies were impacting their ability to deliver timely insights.
- Challenge: Manual setup of custom reports delayed onboarding and consumed valuable resources.
- Solution: By integrating Looker Studio with Google BigQuery, Wpromote automated their reporting process. Dashboards were customized and deployed in minutes, eliminating the need for lengthy manual setups.
- Results: Reporting setup time dropped from over a month to minutes, enabling Wpromote to deliver day-one custom dashboards for new clients. This not only improved efficiency but also enhanced the client onboarding experience and freed up internal resources for strategic tasks.
- Relevance: Marketing agencies can replicate Wpromote’s approach to streamline client reporting, saving time while improving client satisfaction.
Source: Google Cloud Customer Story – Wpromote
Case Study 2: SoundCommerce – Optimizing Ad Spend
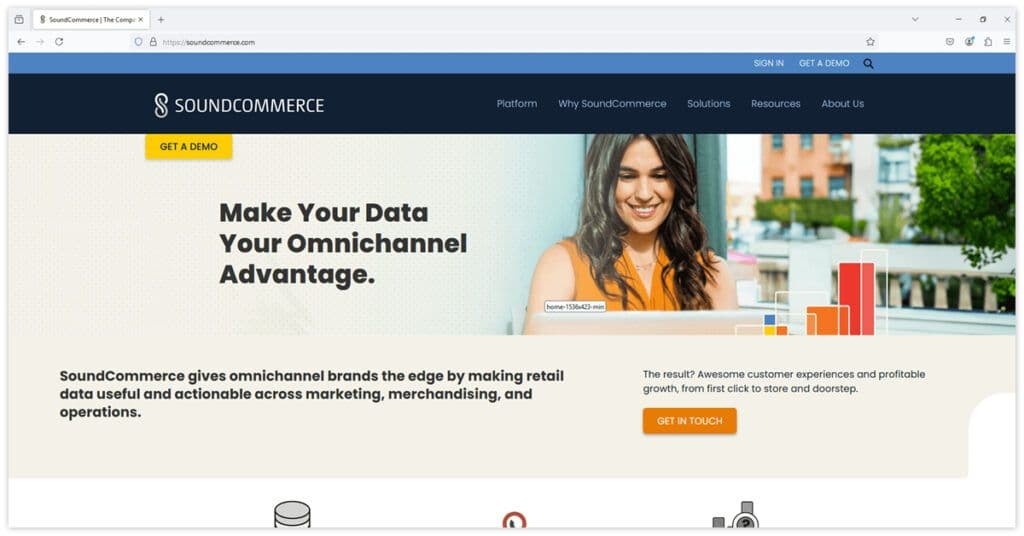
SoundCommerce is a data platform provider that helps e-commerce retailers make smarter decisions by unifying and analyzing their data. To improve advertising efficiency for their clients, SoundCommerce turned to Looker Studio to address challenges in campaign tracking and optimization.
- Challenge: SoundCommerce, a platform serving e-commerce retailers, needed a way to help clients track and optimize advertising performance across multiple platforms. Siloed data from sources like Google Ads, Facebook Ads, and website analytics made it difficult for retailers to identify underperforming campaigns and allocate budgets effectively.
- Solution: By integrating Looker Studio, SoundCommerce built cross-platform dashboards that combined data from all advertising and analytics platforms into a unified view. This enabled retailers to monitor ad performance in real-time and quickly pinpoint inefficiencies.
- Results: Retailers using SoundCommerce’s Looker Studio-powered dashboards achieved a 20% increase in return on ad spend (ROAS). This allowed them to make more data-driven decisions, optimize ad spend, and improve overall marketing ROI.
- Relevance: E-commerce brands can replicate this approach to unify data sources, gain real-time insights, and enhance advertising efficiency with Looker Studio.
Source: SoundCommerce Case Study | Google Cloud
Case Study 3: GitLab – Enhancing Development Efficiency
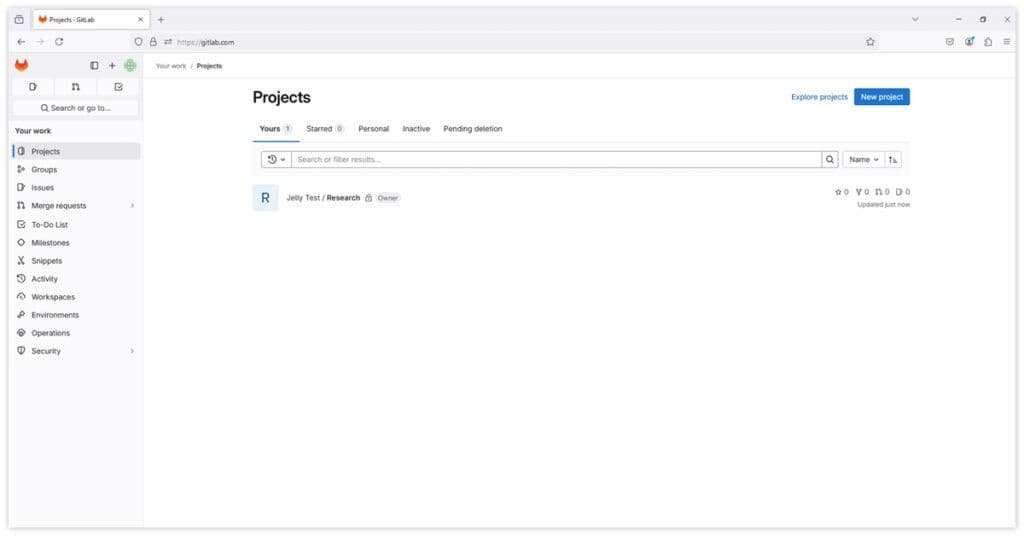
GitLab, a leading DevOps platform, aimed to improve its software development processes by integrating various tools and enhancing collaboration among its teams.
- Challenge: The company faced difficulties in streamlining development workflows due to disparate tools and a lack of unified data visibility, leading to inefficiencies and slower release cycles.
- Solution: By implementing Looker Studio, GitLab consolidated data from multiple sources into a centralized dashboard. This integration provided real-time insights into development metrics, enabling teams to monitor progress, identify bottlenecks, and make informed decisions promptly.
- Results: The adoption of Looker Studio led to a 2,000% increase in build velocity, significantly accelerating the development process and enhancing overall productivity.
- Relevance: Software development companies can utilize Looker Studio to unify data sources, gain real-time insights, and streamline workflows, thereby improving efficiency and accelerating product delivery.
Source: GitLab Case Study
Google Looker Studio offers flexible pricing to accommodate various user needs, from individual marketers to large enterprises. Understanding the features and costs of Looker Studio’s free and Pro versions is essential for selecting the appropriate reporting and visualization tools.
Understanding Looker Studio Pricing
Looker Studio provides two main pricing tiers: a free version and Looker Studio Pro:
| Feature | Free Version | Looker Studio Pro |
|---|---|---|
| Reports and Dashboards | Unlimited reports and dashboards | Unlimited reports and dashboards with team collaboration |
| Integration | Google Analytics, Google Ads, Google Sheets, YouTube Analytics | Integration with all Free features plus advanced collaboration tools |
| Visualization Options | Standard visualization options | Advanced visualizations with additional controls |
| Collaboration | N/A | Team workspaces for enhanced collaboration |
| Automation | N/A | Automated report delivery and personalized data exploration links |
| Administrative Controls | N/A | Advanced content ownership and sharing permissions |
| Security and Governance | Basic | Enhanced governance via Google Cloud integration |
| Support | Community support | Access to Google Cloud Customer Care for priority support |
| Pricing | Free | $9 per user per project per month |
Cost Considerations and Value
The total cost of using Looker Studio depends on several factors:
- Data Source Costs: Connecting to third-party data sources may require additional connectors, which can cost between $20 and $350 per month.
- User Licenses: Looker Studio Pro’s costs scale with the number of users and projects.
- Additional Features: Advanced capabilities, such as automated report delivery and granular security controls, are included in the Pro version but may require more configuration effort.
Cost Comparison with Alternatives
Looker Studio vs. Power BI:
- Pricing: Power BI Pro is priced at $9.99 per user per month, while Power BI Premium costs $20 per user per month.
- Features: Both platforms offer robust data modeling and visualization tools. Looker Studio integrates seamlessly with Google products, making it a cost-effective choice for users within the Google ecosystem.
Looker Studio vs. Tableau:
- Pricing: Tableau’s subscription-based pricing includes the Creator package at $70 per user per month and the Explorer package at $42 per user per month.
- Value: Tableau offers advanced visualization and analytics features, but Looker Studio’s accessibility and ease of use make it appealing for small to medium-sized businesses.
Looker Studio vs. Domo:
- Pricing: Domo’s pricing is influenced by the volume of data processed, with both input and output data of an ETL operation counting against the consumed rows.
- Features: Domo provides advanced enterprise features like large-scale data governance, while Looker Studio offers a more budget-friendly option with robust reporting capabilities.
Maximizing ROI with Looker Studio
Selecting the appropriate version of Looker Studio can lead to cost savings and enhanced team productivity. The free version offers substantial functionality for users focused on Google products, while Looker Studio Pro provides advanced tools for teams requiring greater collaboration and data governance.
Making the Right Choice
When choosing between Looker Studio and its alternatives, consider factors such as:
- Team size and collaboration requirements
- Data source complexity
- Budget constraints and long-term growth plans
- Security and compliance needs
By comprehending Looker Studio’s pricing structure and platform capabilities, organizations can make informed decisions that align with their reporting objectives and plan for future scalability and success.
For teams weighing Looker Studio against a purpose-built client reporting platform, see how the two approaches differ in our Oviond vs Looker Studio comparison.
Comprehensive Training and Resources for Google Looker Studio
Mastering Google Looker Studio requires access to the right training resources and learning tools. Whether you’re a beginner looking to build foundational skills or an experienced user aiming to optimize your dashboards, Google offers a wealth of structured resources, hands-on learning paths, and expert insights to guide you through every step of your journey.
Getting Started with Training
For newcomers, Google Looker Studio provides a range of resources designed to help users navigate the platform with ease. From step-by-step tutorials to interactive labs, these resources ensure users can develop skills at their own pace while gaining practical experience.
Official Learning Resources: The Google Looker Studio Help Center serves as a comprehensive knowledge base. It includes detailed documentation, step-by-step tutorials, and guides on platform features. Users can also access best practice recommendations for creating efficient dashboards, as well as troubleshooting tips for resolving common issues.
For those seeking a more structured approach, Google Cloud Skills Boost offers curated learning paths. These include interactive tutorials, hands-on labs, and progress tracking to reinforce key concepts. Additionally, it prepares users for certification exams, allowing them to demonstrate their expertise.
- Explore Google Cloud Skills Boost.
YouTube Tutorials: Google’s official YouTube channels feature expert demonstrations and step-by-step guides on everything from basic setup to advanced dashboard techniques. These videos also showcase real-world case studies, offering insight into how professionals use Looker Studio for complex reporting needs.
- Visit the Google YouTube Channel for Looker Studio.
The Value of Comprehensive Training Investing time in training not only builds technical proficiency but also empowers users to create impactful dashboards that drive data-driven decisions. Whether it’s through hands-on labs, detailed documentation, or interactive webinars, Looker Studio’s training ecosystem equips users with the tools and confidence they need to maximize the platform’s potential.
For those looking to refine their skills further, combining official resources with community-driven insights can unlock even greater possibilities for dashboard optimization and collaboration. By leveraging these resources, users can transform raw data into compelling stories that support smarter business outcomes.
Structured Learning Paths for Mastering Looker Studio
Whether you’re a beginner just starting out or an experienced user looking to enhance your skills, Looker Studio offers self-paced learning tracks to suit every expertise level. Each track is designed to build on your knowledge and help you unlock the platform’s full potential.
🌱Beginner Track: Building a Strong Foundation This track focuses on fundamental skills to help new users navigate the platform and create basic reports.
- Foundation Skills:
- Learn platform navigation and how to connect data sources.
- Create simple reports and visualizations.
- Apply basic filtering to refine your data.
- Essential Features:
- Understand core chart types and data blending basics.
- Share reports with others and explore basic calculations.
- Utilize templates for quick and easy reporting.
Helpful Resource: Get Started with Looker – Google Cloud Skills Boost offers hands-on labs and tutorials to build foundational skills.
🚀Intermediate Track: Unlocking Advanced Features For users ready to go beyond the basics, this track introduces more complex tools and integration techniques.
- Advanced Features:
- Master custom calculations and create complex visualizations.
- Use data blending techniques and parameter controls to enhance reports.
- Customize your dashboards with unique themes.
- Integration Skills:
- Implement GA4 and BigQuery connections.
- Integrate MySQL and utilize APIs for data connectivity.
- Develop cross-platform reporting for a unified data view.
Helpful Resource: Explore the BI and Analytics with Looker Learning Path on Google Cloud Skills Boost to dive deeper into intermediate techniques.
🧠Advanced Track: Becoming an Expert The advanced track is for power users who want to push the boundaries of what Looker Studio can do.
- Expert Techniques:
- Develop complex calculations and advanced data modeling.
- Create custom visualizations and optimize dashboard performance.
- Leverage advanced integrations for specialized needs.
- Specialized Skills:
- Use RegEx and advanced functions for granular control over data.
- Implement custom JavaScript and develop APIs for automation.
- Design community visualizations to enhance dashboard functionality.
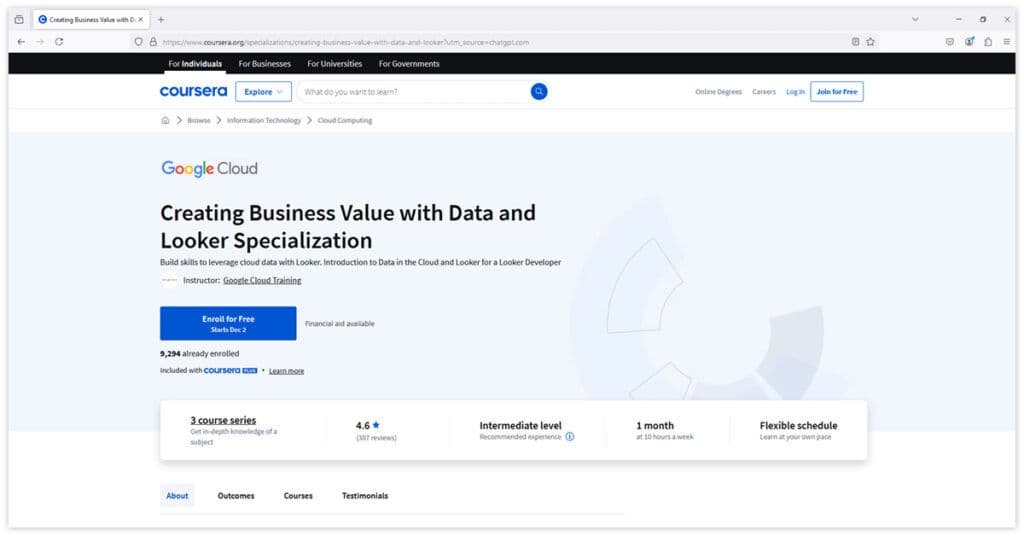
Helpful Resource: The Creating Business Value with Data and Looker Specialization on Coursera provides advanced training to master data analysis and visualization techniques.
These learning paths provide a structured progression, empowering users to develop skills at their own pace. Whether you’re focused on building foundational knowledge or mastering advanced techniques, these tracks ensure that you’re equipped to create powerful, impactful dashboards with Looker Studio. Let these resources guide your journey to becoming a Looker Studio expert.

Engaging with community resources is essential for enhancing your proficiency with Looker Studio
These platforms offer opportunities for knowledge sharing, peer support, and practical learning, enabling you to maximize the potential of Looker Studio in your projects.
Community Resources
Online Communities:
- Google Cloud Community: A platform where users discuss Looker Studio features, share best practices, and troubleshoot issues.
- Stack Overflow: A forum for developers to ask and answer questions related to Looker Studio.
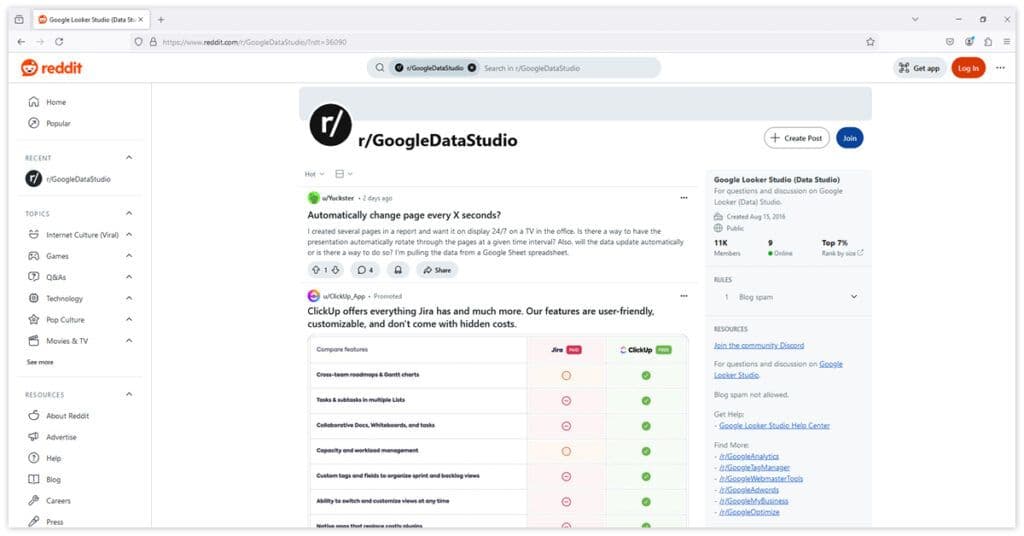
- Reddit Communities: Subreddits like r/GoogleDataStudio provide discussions and insights on Looker Studio.
- LinkedIn Groups: Professional groups focused on data visualization and Looker Studio.
Knowledge Sharing:
- Best Practices and Code Snippets: Users share templates, code snippets, and solutions to common challenges.
- Template Sharing: Access and contribute to a gallery of user-created templates.
Support Channels:
- Technical Support: Utilize official documentation and community forums for assistance.
- Issue Tracking and Feature Requests: Report bugs and request new features through community forums.
Peer Support:
- User Groups and Meetups: Participate in local and virtual events to network with other Looker Studio users.
- Social Media and Professional Networks: Engage with Looker Studio communities on platforms like Twitter and LinkedIn.
Practical Learning Tools
Sample Reports and Templates:
- Template Gallery: Explore industry-specific templates and use-case examples.
- Starter Dashboards: Access dashboards that demonstrate best practices and advanced implementations.
Practice Exercises:
- Guided Tutorials and Challenge Problems: Engage in real-world scenarios and skill assessments.
- Portfolio Projects: Develop projects to showcase your Looker Studio expertise.
Hands-On Labs:
- Interactive Learning Environments: Participate in guided exercises with real data scenarios.
- Feature Exploration and Problem-Solving Tasks: Enhance your skills through practical tasks.
By actively participating in these community resources and utilizing practical learning tools, you can deepen your understanding of Looker Studio, stay updated on best practices, and connect with peers to collaboratively solve challenges.
Certification and Professional Development for Looker Studio
Building expertise in Google Looker Studio not only enhances your technical proficiency but also opens doors to career growth and professional recognition. Certification and structured learning paths are critical tools for validating your skills, continuing your education, and fostering professional growth in the ever-evolving field of data visualization.
Skill Verification: Demonstrating Expertise Verifying your proficiency with Looker Studio involves more than theoretical knowledge—it’s about demonstrating practical application.
Assessment Options:
- Take knowledge checks to assess your understanding of core concepts.
- Complete practical exercises to showcase problem-solving skills.
- Submit project completions to validate your ability to build real-world dashboards.
- Engage in peer reviews to learn from and share feedback with others in the community.
- Build a portfolio to highlight your Looker Studio projects and implementations.
Helpful Resource: Google Cloud Skills Boost offers hands-on labs, real-world challenges, and opportunities to create portfolio-worthy projects.
Certification Paths: Earning Industry Recognition Achieving certification in Looker Studio demonstrates your skills to employers and peers while advancing your career.
- Learning Tracks: Follow structured learning paths designed to prepare you for certification exams.
- Skill Validation: Certifications confirm your expertise in creating dashboards, integrating data sources, and optimizing visualizations.
- Professional Recognition: Earn industry-recognized credentials that enhance your professional credibility.
- Career Advancement: Certified professionals gain a competitive edge, with credentials that open doors to leadership roles and specialized projects.
Helpful Resource: Start with the Google Cloud Looker Studio Pro Essentials Course to prepare for certification and validate your skills.
Continuing Education: Staying Ahead in the Industry Professional development doesn’t end with certification—ongoing learning is key to staying current with platform updates and trends.
- Ongoing Learning:
- Stay informed about feature updates and new capabilities in Looker Studio.
- Learn new techniques to improve dashboard performance and design.
- Follow industry trends to align your skills with emerging demands.
- Explore best practices and advanced techniques to refine your expertise.
- Advanced Skills: Dive into topics such as data governance, advanced integrations, and custom visualization creation.
Helpful Resource: The Creating Business Value with Data and Looker Specialization on Coursera offers an excellent opportunity to expand your skill set.
Professional Growth: Advancing Your Career Certification and education can catalyze professional growth by connecting you with others in the field and fostering leadership opportunities.
- Skill Expansion: Master advanced Looker Studio features and integrations to broaden your expertise.
- Network Building: Engage with industry professionals through events, forums, and social media.
- Industry Involvement: Contribute to the Looker Studio community by sharing knowledge and resources.
- Leadership Development: Use your expertise to mentor others, lead teams, and influence industry practices.
Helpful Resource: Participate in Google Developer Groups to connect with like-minded professionals and expand your network.
Resource Implementation: Developing a Learning Plan For individuals and teams, creating a structured learning plan ensures efficient skill-building and knowledge application.
- Team Development:
- Conduct skill assessments to identify gaps.
- Set clear goals for learning outcomes.
- Use progress tracking to monitor team development.
- Establish performance metrics to measure success.
- Resource Allocation:
- Manage time effectively by scheduling regular training sessions.
- Provide access to learning materials such as templates and tutorials.
- Implement support systems for collaborative problem-solving.
- Offer practice opportunities through hands-on labs and real-world challenges.
- Use feedback mechanisms to continuously improve learning outcomes.
By utilizing these certification paths, learning tools, and community resources effectively, you’ll build a comprehensive understanding of Google Looker Studio and enhance your data visualization capabilities. Regularly practicing, staying updated with new features, and aligning with industry best practices will ensure continued success in your professional journey.
Future Developments and Current Features in Google Looker Studio
Google Looker Studio continues to evolve, introducing features that enhance user experience, expand data integration capabilities, and align with current data visualization trends:
| Category | Feature | Details/Improvements |
|---|---|---|
| Latest Platform Features | User Interface Enhancements | – Enhanced dashboard controls with alert setups. – Streamlined navigation and modern design. – Improved accessibility with inclusive design. |
| Visualization Capabilities | – Advanced chart types and customization options. – Interactive elements for user-driven exploration. – Community visualizations for expanded tools. | |
| Data Integration Updates | – Expanded data source options and better API connections. – Streamlined authentication processes. – Enhanced data blending features. | |
| Platform Integration | – Improved BigQuery integration and GA4 connections. – Advanced MySQL compatibility. – Expanded database support and cross-platform functionality. | |
| Industry Trends | Data Visualization Trends | – Real-time data updates and dynamic filtering. – Custom parameters for flexibility. – Advanced interactivity like drill-downs and hover actions. |
| Design Evolution | – Mobile-first design and accessibility standards. – Responsive layouts for different devices. – Clean, modern aesthetics focusing on user experience. | |
| Analytics Innovation | – Predictive analytics and machine learning integration. – Automated insights and trend analysis. – Enhanced data processing speed for large datasets. | |
| Platform Evolution | Technical Advancements | – Faster loading times and optimized data processing. – Improved caching and resource management. – Advanced security features and compliance updates. |
| User Experience Updates | – Streamlined workflows with intuitive controls. – Enhanced collaboration tools like real-time editing and version control. – Simplified navigation and team workflows. |
Resource List: Keep Up with Looker Studio Features and Trends
1. Data Visualization Trends and News
- Data Visualization Society: Explore industry insights and design trends to improve your data storytelling.
- Zebra BI Blog: Discover interactive dashboard techniques and data visualization advancements.
- Datamation: Stay updated on the latest analytics innovations and tools.
2. Networking and Professional Groups
- Google Developer Groups (GDG): Attend meetups and collaborate with local Looker Studio users for networking and skill-building opportunities.
3. Industry Blogs and Insights
- Mondo Trends Blog: Keep track of cutting-edge developments in data visualization and best practices.
How to Use These Resources
- Visit these websites regularly to stay informed about trends, techniques, and innovations.
- Join local and virtual communities to expand your professional network.
- Apply new ideas and best practices to enhance your Looker Studio dashboards.
Impact on Digital Marketing
Google Looker Studio is reshaping the way digital marketers approach analytics, campaign management, and reporting. By centralizing data and providing actionable insights, it enables marketers to refine strategies, optimize performance, and adapt to evolving industry needs.
With Looker Studio, marketers gain access to powerful tools for cross-channel analytics and customer journey tracking. Features like ROI analysis and attribution modeling help clarify which campaigns deliver the most value, making data-driven decision-making simpler and more effective. Real-time monitoring and automated alerts ensure campaigns stay on track, while budget optimization and A/B testing analysis offer deeper insights into performance.
One of Looker Studio’s greatest strengths is its ability to unify data from diverse platforms. Whether it’s social media, email marketing, PPC campaigns, or SEO, the platform consolidates insights into a single, cohesive dashboard. This unified reporting makes it easy to compare channels, track customer behavior, and uncover performance correlations.
To stay ahead in a constantly evolving digital landscape, marketers must also prepare for change. Implementing new features and updates requires strategic adaptation, including monitoring enhancements, scheduling team training, and updating documentation. Preparing teams through skill development, process adjustments, and best practices ensures smooth transitions and full utilization of Looker Studio’s capabilities.
Future-proofing marketing operations is equally important. Scalability, innovation, and resource planning should be part of any long-term strategy. By aligning technologies with growth goals and proactively managing risks, organizations can maintain momentum while adapting to advancements.
Finally, staying current with Looker Studio is essential for maximizing its potential. Marketers can monitor release notes, engage in community discussions, and explore training resources to stay informed about new features and industry trends. By adopting best practices, regularly refining processes, and using user feedback, teams can continuously improve their performance and adapt to changing demands.
Through thoughtful integration and proactive planning, Looker Studio becomes a critical tool for driving data-driven marketing success and long-term growth.
Conclusion and Essential Resources
Looker Studio is a comprehensive solution for creating impactful, data-driven visualizations that streamline reporting, enhance decision-making, and drive business success. To fully leverage its potential, understanding its benefits, utilizing essential resources, and implementing a structured plan are key to achieving long-term results.
Final Insights
Key Platform Benefits Looker Studio offers several core advantages, including:
- A cost-effective reporting solution with a user-friendly interface.
- Seamless integration within the Google ecosystem for streamlined workflows.
- Robust data visualization capabilities supported by regular feature updates.
Business Impact Looker Studio drives measurable results through:
- Enhanced decision-making and data accessibility.
- Streamlined reporting processes and improved collaboration.
- Greater productivity with automated updates and standardized workflows.
Strategic Value From marketing to operations, Looker Studio delivers:
- Comprehensive campaign tracking and real-time performance monitoring.
- Cross-channel analysis and data-driven insights for smarter marketing strategies.
- Reduced manual effort, saving time and increasing accuracy.
Essential Resources
📖Official Documentation Get started with the core resources directly from Google:
- Looker Studio Homepage for access to tools and features.
- Release Notes to stay updated on platform developments.
🎓Learning Platforms Expand your skills through educational content:
- YouTube Tutorials for step-by-step guidance.
- Google Cloud Skills Boost for hands-on labs and certifications.
- Coursera Specializations for advanced learning paths.
🌐Community Resources Connect with other Looker Studio users for insights and support:
- Reddit: r/GoogleDataStudio for user insights and shared experiences.
- LinkedIn Groups for professional networking opportunities.
Mastering Google Looker Studio is essential for marketing professionals aiming to harness the power of data visualization and analysis. This platform not only simplifies the process of transforming raw data into actionable insights but also enhances collaboration and decision-making through its user-friendly interface and advanced features.
By implementing best practices and exploring the extensive capabilities of Looker Studio, users can create compelling reports that drive informed business strategies. As data continues to play a pivotal role in marketing success, embracing tools like Looker Studio will empower professionals to stay ahead in an increasingly competitive landscape.

FAQs for Google Looker Studio
What are the main advantages of using Google Looker Studio for data visualization compared to other tools?
Google Looker Studio offers seamless integration with a wide range of Google services, allowing for real-time data updates and a user-friendly interface. Its ability to blend data from various sources and provide customizable, interactive dashboards makes it particularly valuable for marketers seeking comprehensive insights.
What security measures should I implement when sharing reports in Looker Studio?
It is crucial to regularly review access permissions and set appropriate sharing settings based on user roles. Implementing data source restrictions and understanding the implications of user access levels can help protect sensitive information while fostering collaboration.
Can I automate report generation in Looker Studio?
Yes, users can automate report generation by scheduling regular updates and utilizing data connectors that refresh automatically. This functionality ensures that stakeholders always have access to the most current data without manual intervention.
What are some common challenges users face when integrating data sources in Looker Studio?
Common challenges include managing disparate data formats, ensuring data accuracy across sources, and troubleshooting connection issues. Users may also encounter limitations with specific connectors, which can affect the depth of analysis possible within their reports.
How do I measure the effectiveness of my dashboards created in Looker Studio?
Effectiveness can be measured by tracking user engagement metrics, such as report views and interaction rates. Gathering feedback from stakeholders on usability and clarity can also provide insights into how well the dashboards meet their needs.
Are there any limitations to the free version of Google Looker Studio?
While the free version offers robust features suitable for most users, limitations may include restricted access to certain advanced functionalities or premium integrations. Organizations with larger teams or more complex needs may benefit from exploring paid options for enhanced capabilities.
How can I ensure my visualizations are accessible to all users?
To enhance accessibility, consider using color-blind friendly palettes, providing alternative text for images, and ensuring that text is legible against background colors. Additionally, structuring reports logically will help all users navigate effectively.
Related articles
Simplify Marketing Reporting Today
Stop juggling multiple tools. Start presenting clear, automated reports your clients will love