Table of Contents
Can Instagram Insights help my marketing strategy?
The short answer: yes! Did you know Instagram helped businesses generate over $50.6 billion in global ad revenue last year alone? This staggering figure, which continues rising annually, cements the platform’s indispensable role in today’s digital marketing landscape.
As Instagram evolves, it’s no longer just a social platform but a marketing powerhouse. In 2023, businesses are increasingly leveraging Instagram’s diverse content formats, from organic posts to sophisticated ad campaigns, recognizing its unparalleled potential to engage and convert audiences.
But to fully capitalize, marketers need to tap Instagram’s built-in analytics toolkit and utilize dashboard and reporting tools. By studying Instagram Insights reports, you can crack the code on meaningful interactions even amidst the continually changing algorithm. Let’s explore how.
What is Instagram Insights?
Instagram Insights is the free built-in analytics tool for Instagram’s business profiles and creators. Key features to leverage include:
- Segmentation capabilities – Analyze performance by gender, age, location and more for targeted content strategies
- Historical data comparisons – Track growth and diagnose issues by comparing metrics month-over-month
- Paid partnership and ad metrics – Calculate ROI from promotions and campaigns
- API connectivity – Connect Instagram data with third-party platforms for complete funnel analysis
- Personalized performance dashboard – Monitor key metrics like follower demographics, engagement rates and content reach
In summary, Instagram Insights provides the pivotable, freely accessible data to drive key decisions around:
- Increasing brand visibility and awareness
- Building stronger community relationships
- Driving product sales through Instagram
This tool empowers Instagram marketers with the actionable analytics needed to optimize content and strategy.
The Power of Instagram Insights Reports
As Instagram’s algorithm shifts towards engagement, marketers have watched their organic reach steadily decline (HubSpot, 2023). But those willing to study the data patterns in Instagram Insights reports can actually crack the social giant’s code and regain an edge.
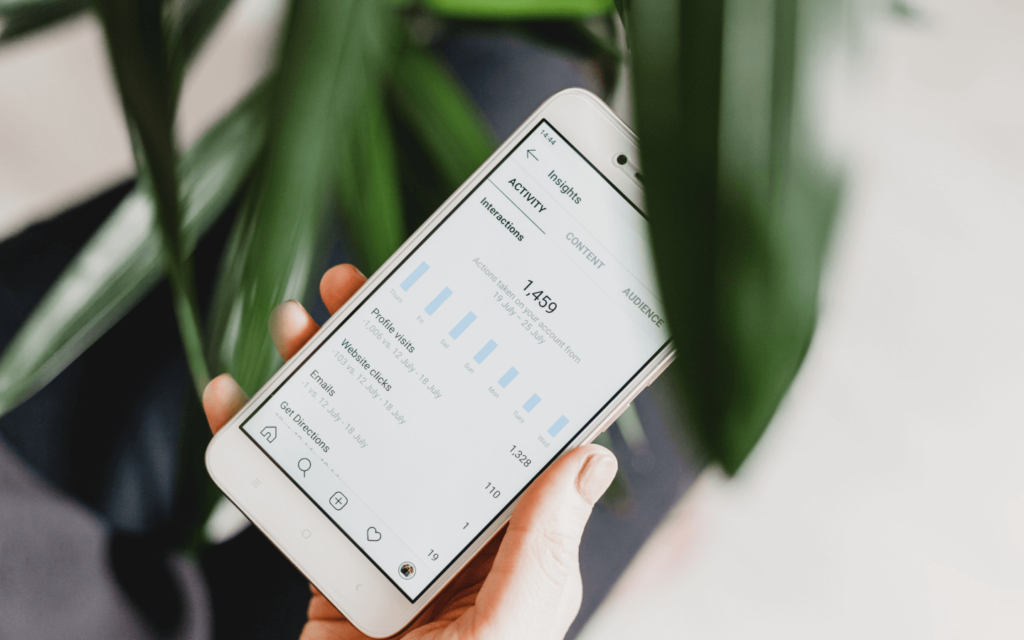
An Instagram Insight report draws back the curtain on how your target audience interacts with your content and profile. It provides a wealth of data points around your posts as well as aggregated performance trends. By contextualizing key metrics like follower growth, website clicks, and audience demographics, you can start connecting the dots of what drives meaningful engagement and make the most of this huge market.
So don’t despair over the continually changing algorithm. Just like an adventurer decoding a hidden map, you too can learn how to leverage the secrets in Instagram Insights reports to revitalize your Instagram strategy. This comprehensive guide will help you find the gold: untapped opportunities and more impactful content angled just right for your unique Instagram audience. Now is the time for unlocking Instagram’s real potential for your brand!

Organic versus Paid
Instagram has transformed into a sophisticated, revenue-generating marketing channel which businesses increasingly depend on to reach and convert target audiences.
As proof of Instagram’s business potential, global Instagram ad revenue reached over $50 billion in the past year, a massive 15% jump from the year prior as more companies integrate paid campaigns into their strategies. This rising spend reflects a vote of confidence in Instagram’s unparalleled ability to drive meaningful customer engagement and ROI.
But it’s not just paid advertising shining. The organic side still holds immense value too. Organic Instagram content like regular posts, Stories, Reels and IGTV creates the foundation for brand presence and identity. Insights around follower demographics and engagement metrics inform how to tailor strategies for maximum resonance. An integrated, harmonious approach combining organic and paid creates maximum impact.
How to Use Instagram Insights in a Report
Feeling overwhelmed staring at the endless metrics in Instagram Insights? You’re not alone. Transforming those volumes of statistics into meaningful insights is an art form. But you have to start with the end in mind – what exactly are you trying to accomplish?
More followers and traffic is nice, but vague objectives lead to directionless reports. Specific goals demand specific tracking. Are you laser focused on engagement rates? Conversions? Sales? Get clear on the 2-3 core KPIs that indicate performance, then use your Insights data to monitor progress.
What story are the metrics telling month-over-month? Dig into demographic and geographic filters to spot priority areas to nurture. Are 18-24 year old females in Australia connecting best with certain content themes? Develop that LTR relationship!
And don’t forget the power of visualizing shifts over time. A heat map of impressions or engagement rates makes those incremental peaks and valleys stand out much more than a table of numbers right?
At the end of the day, an Insights report should capture trends at a glance then guide strategic next steps tailored to what your real-world community displayed. Think beyond data collection to recommendations that match targets to what makes your audience tick!
The possibilities are endless when you shift from data gathering into active listening and response through Instagram’s robust analytics. How will you transform your numbers into audience impact?
Some key elements highlighted include:
- Aligning metrics to concrete goals
- Logically structuring data into insightful narrative
- Incorporating visualizations for clarity
- Synthesizing takeaways and strategic recommendations

How Do You Turn Instagram’s Data Overload into Impactful Reporting?
Feeling overwhelmed staring at the endless metrics in Instagram Insights? You’re not alone. Transforming those volumes of statistics into meaningful insights is an art form. But you have to start with the end in mind – what exactly are you trying to accomplish?
More followers and traffic is nice, but vague objectives lead to directionless reports. Specific goals demand specific tracking. Are you laser focused on engagement rates? Conversions? Sales? Get clear on the 2-3 core KPIs that indicate performance, then use your Insights data to monitor progress.
What story are the metrics telling month-over-month? Dig into demographic and geographic filters to spot priority areas to nurture. Are 18-24 year old females in Australia connecting best with certain content themes? Develop that LTR relationship!
And don’t forget the power of visualizing shifts over time. A heat map of impressions or engagement rates makes those incremental peaks and valleys stand out much more than a table of numbers right?
At the end of the day, an Insights report should capture trends at a glance then guide strategic next steps tailored to what your real-world community displayed. Think beyond data collection to recommendations that match targets to what makes your audience tick!
To summarize Instagram Insights Capabilities:
- Audience demographic segmentation – gender, age, location
- Historical metric comparisons
- Partnerships and campaign ROI reporting
- Instagram Ad performance tracking – spend, reach, frequency, conversions
- API data connectivity
Instagram Reporting – Elements to Include:
| Reach metrics | impressions, total reach, organic vs paid reach |
| Engagement metrics | overall engagement rate, likes, comments, shares, saves |
| Followers metrics | total followers, follower growth rate |
| Competitor benchmarking | engagement rates, growth velocity |
| Instagram Stories metrics | views, reach, exits, responses, taps forward |
| Instagram Reels metrics | views, likes, comments, shares, saves |
| Instagram Ads metrics | CPM, CPC, CTR, frequency, conversions |
By diligently analyzing these key elements in your report each month, you’ll derive targeted, actionable insights. This empowers you to craft dynamic Instagram strategies that resonate with your audience and stay ahead of the ever-changing algorithm.
The possibilities are endless when you shift from data gathering into active listening and response through Instagram’s robust analytics. How will you transform your numbers into audience impact?

Content Spotlights in Instagram Insights Reports
While Instagram Insights provides a multitude of data, not all metrics equally contribute value. Crafting an insightful Instagram report requires an understanding of the most essential KPIs worth monitoring.
Firstly, assess content visibility in the algorithm across formats. Do Reels or Live videos, for example, get displayed more prominently to your viewers? Track how algorithm favor impacts bottom-line metrics like reach and engagement.
Then explore user engagement trends specific to each format. How do audiences interact differently across Shopping elements in stories versus posts? Monitor the impact of these tendencies on driving visitors and conversions.
Incorporate influencer collaboration metrics, if applicable. Influencer content can expand reach, so contrast partner views and engagement with your brand’s solo efforts. Similarly track Instagram Stories performance, as these impact interactions despite their ephemeral existence.
For paid content, include relevant ad data. Click-through rates, conversion figures, and cost data offer a complete, holistic view of your Instagram presence and strategy. Sentiment analysis via comments and message tracking is also insightful for understanding perceptions.
While exhaustive reporting has merit, distill down the crucial metrics converting users into customers to guide strategic decisions and optimize resource allocation across Instagram opportunities. Identify and prominently highlight the KPIs proving most fundamental for achieving each objective.

Best Practices for Actionable Reports
Transform robust Instagram analytics into strategic momentum with these best practices:
👥 Incorporate metrics on key formats/features tied to goals—benchmark vs. industry averages
🚀Set consistent, measurable KPIs to pinpoint priorities and govern decisions
💬 Analyze user comments/messages to uncover deeper opportunities
📊 Use dashboards to spotlight priority trend shifts warranting attention
🔁 Synthesize top-line metrics into insights fueling innovation
⚙️ Leverage automated templates/workflows—gain efficiency to focus elsewhere
This platform grants rich intelligence. Will you actively shape it into high-impact outcomes? Commit to intentional analysis, consistency, and letting truth propel your next wave of resonance and growth.
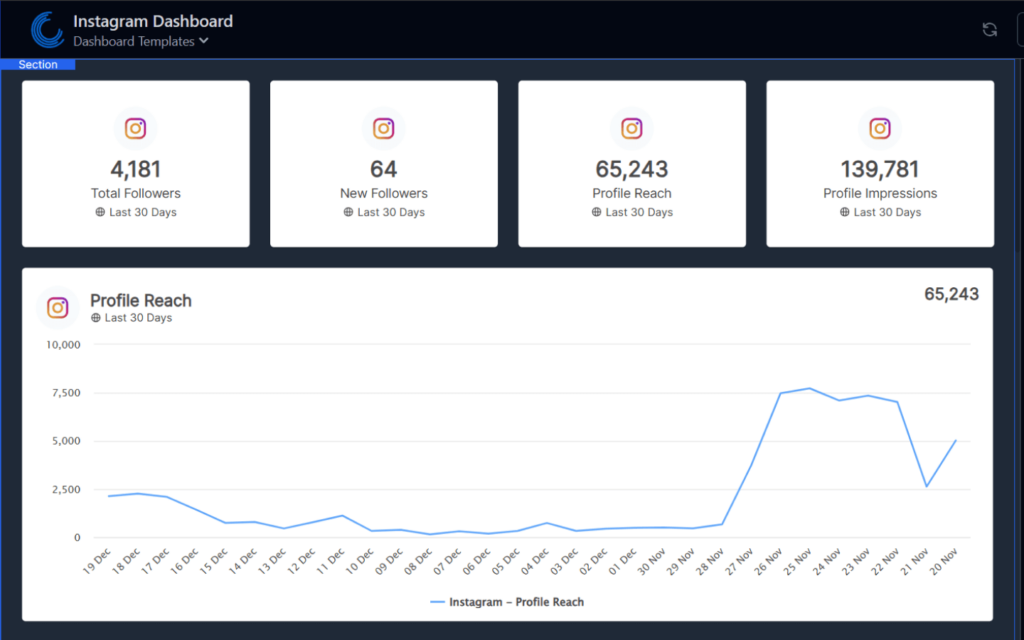
Enhanced Reporting with Digital Marketing Solutions for Instagram and Instagram Ads
Let’s face it, manually tracking Instagram metrics and building customized reports for clients is a painful drain on time and resources. But in today’s visually driven, Instagram-obsessed marketing arena, professional reporting tools can become serious competitive advantages.
What should you look for in a robust reporting solution? Capabilities like:
🎨 White labeling to match deliverables to your agency’s branding
🔧 Adaptable templates to showcase data aligned around each client’s personalized goals and metrics
📊 Automation to substantially cut manual workflow around daily data pulls and number crunching
📈 Real-time tracking of Stories, Reels, demographics and more to showcase media mix performance
By leveraging the automation power, customization flexibility, and white label polish available in today’s reporting platforms, agencies can utilize Instagram tools tailored exactly to current needs.
The results? High-impact visual deliverables built around each client’s unique KPIs, seamlessly integrated into branded decks. Plus, unlocked strategy and ideation creativity from regaining hours previously lost in report creation treadmills.
Think of the benefits of having these tools in your marketing belt:
| Unified Data Management | Centralizes data from various digital marketing channels, offering a holistic view of campaign performance. |
| Instant Analytics Access | Provides real-time updates, allowing for swift action based on current marketing data insights. |
| Custom Dashboards | Enables the creation of personalized dashboards that highlight key performance indicators important to your business. |
| Scheduled Reporting | Automates the generation and distribution of reports, ensuring regular updates for team members and stakeholders. |
| Client Portfolio Management | Simplifies handling multiple client accounts and reports from a single interface, ideal for marketing agencies. |
| Competitive Benchmarking | Offers tools to measure your marketing results against industry standards or competitor performance. |
| Interactive Reporting | Creates interactive reports that can be drilled down for detailed analysis, enhancing the understanding of complex data sets. |
| Goal Tracking | Facilitates the setting and tracking of specific marketing goals to align with broader business objectives. |
| Campaign Optimization | Helps identify high-performing marketing strategies and areas for improvement, optimizing overall campaign effectiveness. |
| Collaborative Features | Allows teams to collaborate on reports and dashboards, improving communication and productivity in marketing initiatives. |
Let marketing reporting software solutions shoulder the manual work so you can focus on client impressions and results. Align to the tools built for Instagram’s pace and inbox your advantage.

Visually Engaging Reporting in Digital Marketing Solutions
Beyond basic data dashboards, today’s cutting-edge solutions empower deeply customizable graphical reporting tailored to client brand identities. Agencies transform engagement metrics into sleek, visually striking narratives that resonate.
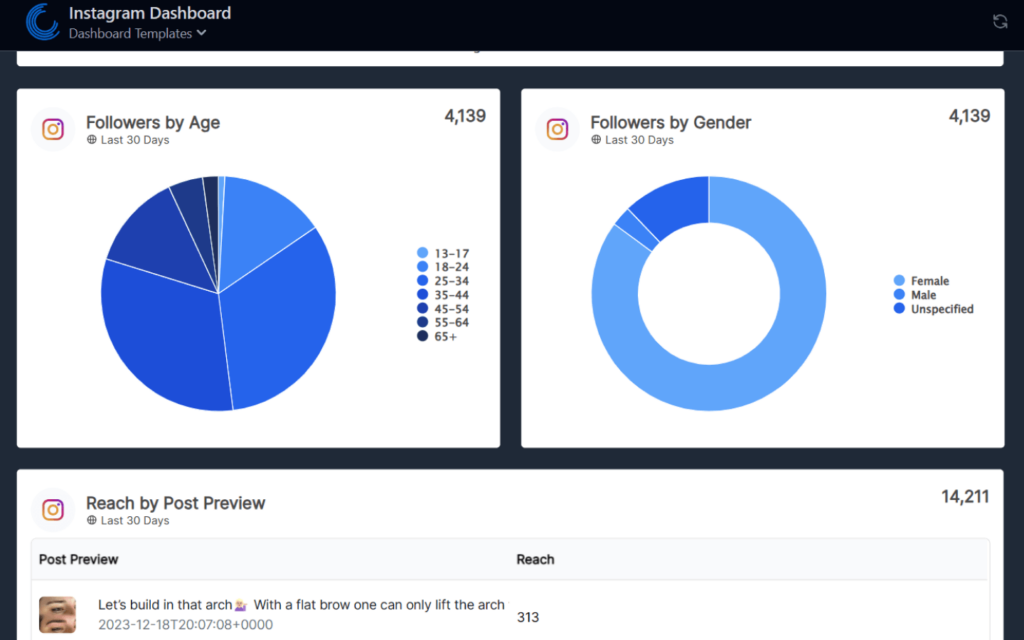
Digital marketing reporting software, like Oviond, use intuitive drag-and-drop editors enable engrafting logos, selecting color schemes, incorporating images, and tweaking layouts for signature flow in client deliverables. Dry charts spring to life as polished slide decks and infographics spotlighting strategic opportunities at a glance.
These tools also support rapidly adapting to new platform innovations or course corrections in strategies. Quickly update visual assets to match needs, maintaining competitive advantage. This real-time analytics reflection ensures agencies lead vs just react, translating Instagram’s updates into competitive opportunities.
Choose solutions facilitating immersive, visually commanding data storytelling that impresses across the client delivery ecosystem. Unlock functionality taking analytics far beyond numbers in cells, undoing their restraints – allowing statistics to fully inform through bold, cohesive graphical interfaces fine-tuned to each situation. Don’t just present data. Inspire action.
Other noteworthy digital marketing software:
- Supermetrics streamlines data integration and automation for marketing analytics, with user-friendly features and extensive connectors.
- Databox offers robust dashboard creation and multiple integrations, with strong visual appeal and goal tracking features. Its user-friendly interface and customizable options make it accessible for both novice and experienced users.

Turning Insights into Action
While compiling Instagram reports offers immense analytic value, activating insights for continual optimization is crucial.
Digital marketing reporting solutions provide the perfect launchpad and inform strategy through:
📝 Content Planning Per Performance Data: Let engagement metrics and creative resonance guide production.
💰 Budget and Resource Allocation: Pivot investments towards demonstrated high performers.
⚙️ Implementation Processes: Embed insights across workflows – governance, systems, and teams.
💡 Impact Evaluation: Assess ROI using historical baselines tied to business KPIs.
❗Completing the loop: Move from reporting into actionable findings.
Cultivating an Instagram Growth Mindset
In the ever-evolving realm of Instagram, success belongs to those who are proactive. Brands that thrive are those already laying the groundwork with processes, teams, and tools that adapt to emerging consumer behaviors.
As you stand on the cusp of harnessing Instagram’s full potential, it’s essential to confront unique challenges head-on. Begin by critically auditing your current Instagram strategy. Are you effectively interpreting engagement metrics? How well are your posts aligning with audience preferences? Use the best practices we’ve discussed for organic content, Instagram Ads, and detailed reporting as a checklist. Set clear, achievable benchmarks and KPIs that align with your specific goals, and then diligently weave these data-driven insights into your daily operations, governance, and technical integrations.
But remember, the landscape of digital marketing doesn’t stand still. To stay ahead of the curve, cultivate a mindset of perpetual curiosity and informed agility. Embrace the challenge of turning fleeting data points into lasting connections that amplify your brand’s voice. Dive deeper into tools like Instagram Insights and other analytical platforms to chart your course in this dynamic digital terrain.
Your next step? Take decisive action. Explore tools like Oviond that offer comprehensive Instagram analytics to elevate your strategy. With the right tools and a commitment to continuous learning, you can transform Instagram analytics from a mere crystal ball into a powerful compass guiding your brand’s future trajectory. Try Oviond’s 15-day free trial today.
Frequently Asked Questions on Instagram Insights Reports
How many brands use Instagram for business and marketing purposes?
Over 200 million business profiles are active on Instagram showing the platform’s immense reach and applicability.
What portion of Instagram users are influenced by influencers or recommendations when making a purchase?
72% of Instagrammers report making fashion, travel, or food and beverage purchases based on recommendations seen on the platform.
Which age demographic is most prevalent on Instagram as of 2023?
As of 2023, nearly 70% of Instagram’s users are under 35 years old, including 31% between 18-24 years old.
What impacts visibility of Instagram feed posts in the user’s timeline the most?
Instagram’s algorithm factors that impact feed post visibility are types of audience interactions like likes, user relationships, and how often the account posts – not just recentness.
How many people watch video globally every day on Instagram?
Over 100 million Instagram users engage with IGTV videos each day showing the impact of video marketing.
What Instagram analytics factors most strongly correlate to online store orders?
Product tags generating clicks and traffic to eCommerce sites show the highest statistical significance in driving online orders.
Which Instagram ad objective options perform best for DTC eCommerce brands?
or most DTC brands, Catalog Sales with automatic placements tend to outperform interest- or follower-focused objectives.
What Instagram metrics indicate a profile’s influence and resonance?
Influence is reflected in engagement, reach, saved posts, shares, profile visits and quality followers like micro or macro influencers.
How accurate are UTM links for campaign attribution in Instagram Insights?
UTM tracking links on Instagram provide 80% or higher accuracy for campaign performance attribution.
What Instagram metrics should be tracked to gauge conversion potential from engagement?
Comment sentiment, comment response times, click-through rates on links, and opt-ins correlate to conversion probability.
How long is Instagram Stories and live video content accessible to users after 24 hours?
Instagram ephemeral video content stays accessible for only 24 hours maximum but analytics remain viewable afterwards.
What percentage of marketers intend to increase future Instagram influencer marketing budgets?
For 2023, over half of marketers plan to increase already sizeable Instagram influencer collaboration budgets by up to 30%.
