Oviond Blog
The Requisite Guide to Creating a Social Media Analytics Report PDF
Discover how to craft an effective Social Media Analytics Report PDF with easy steps, from data collection to insightful analysis and presentation.

Creating a Social Media Analytics Report PDF might seem overwhelming at first, but it’s a task that can be simplified into straightforward steps. Think of it as organizing building blocks, each one essential to the structure you’re building.
Our ultimate aim is to help you not just gather and analyze important data but also to present it in an appealing and professional PDF format. This way, you can easily share a well-organized, visually appealing report through email or in person, which reflects your diligent work and insights in social media analytics. Let’s embark on this journey together, transforming complex data into an accessible and informative report.
What is a Social Media Report?
A social media report is much more than just a collection of numbers and charts. It’s a narrative that tells the story of your brand’s performance across social platforms. Think of it as a mirror reflecting the impact of your social media strategies. It aggregates data from various social channels and turns it into meaningful insights. These insights help you understand how your content resonates with your audience, the effectiveness of your engagement strategies, and the overall reach of your social media presence.
In essence, a social media report is a vital tool that provides a clear view of what’s working, what’s not, and where there’s room for improvement. It guides your future strategies, ensuring that your social media efforts align with your business objectives and continue to engage your audience effectively.
What to Include in Your Social Media Report
With the right elements, your social media analytics report becomes a clear, informative path that leads to better strategy and decision-making. Whether it’s a comprehensive marketing report or a more focused social media monthly report, certain key components must be included to ensure you’re getting the full picture of your social media performance. The building blocks below will help you create a report that’s not just numbers on a page but a strategic tool for growth. Let’s explore these components to turn your social media analysis report into a valuable asset for your brand’s digital presence.

1. Executive Overview
Provide a succinct summary at the beginning of your social media analytics report PDF, highlighting key findings and insights to give readers an immediate understanding of the report’s value and focus. What’s the big picture of our social media efforts this time around? Are we hitting the mark with our digital marketing goals?
2. Defining Goals
Outline the strategic objectives you’re aiming to achieve, aligning your social media actions with broader marketing goals. What are we really aiming to achieve on social media, and how does this tie into our bigger marketing game plan?
3. Time-specific Objectives
Sets and reviews targets for the specific period covered, allowing for timely adjustments and strategy refinements. What were our big wins for this period? Did we get closer to hitting those targets we set?
4. Essential Metrics and KPIs
Where you detail the key metrics and performance indicators critical for assessing your social media strategy’s success. Which numbers should we really care about here? How do these metrics give us the real scoop on our strategy’s impact?
5. Assess Overall Performance
An in-depth look at the effectiveness of your social media strategies within your analytics report, evaluating areas of success and those needing improvement. Where are we knocking it out of the park with our social media, and where do we need to up our game?
6. Glean Campaign Insights
A detailed examination of individual campaigns within your marketing report, assessing their impact and drawing lessons for future strategy enhancements. Which campaigns made a splash and which ones fizzled out? What can we learn from them to make the next ones even better?
7. Competitive Analysis
A comparative look at your performance versus competitors, essential for market positioning and strategy development. How do we stack up against our competitors on social media? Can we pick up any tricks from what they’re doing?
8. Audience Insights
Focuses on understanding your audience’s demographics, preferences, and behavior, crucial for targeted content creation. Who’s really tuning into our social channels? How can understanding them better shape our content?

9. Content Strategy Analysis
Evaluates the performance of different content types in your social media report, identifying what resonates best with your audience. What kind of content is winning our audience’s hearts? Are there certain types that do better on specific platforms?
10. Platform-specific Performance
Analyzes each social media platform’s contribution to your overall strategy in your analytics report, highlighting areas of strength and those needing focus. How’s each social platform working out for us? Should we double down or switch up our strategy on any of them?
11. Actionable Recommendations
This concludes your social media analysis report with practical, data-driven recommendations, aiming to optimize future social media efforts for better engagement and results. Based on everything we’ve seen, what should we do next? How do these tips fit into our bigger marketing playbook?
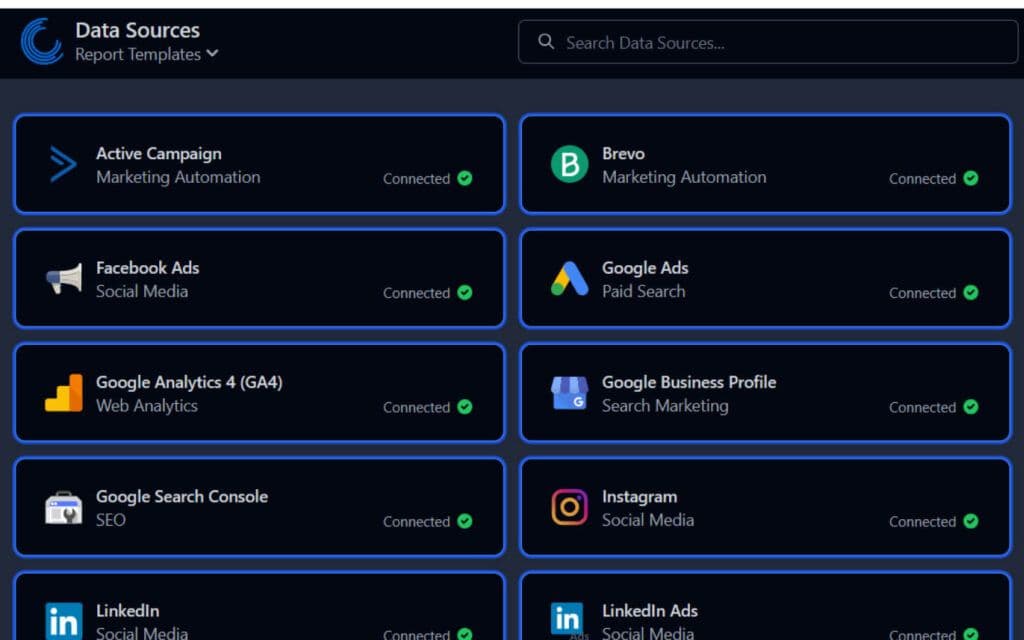
There are many different social media platforms to choose from. Choosing the correct data source is important to gaining the best insight.
Putting it Together: How to Create a Social Media Report
This isn’t just a document; it’s a roadmap for your future strategies. And remember, the goal is to create a social media analytics report that is not only informative but also engaging and visually appealing, making it a valuable tool for communication and decision-making. Let’s break it down into step-by-step instructions.
Step 1: Identify Your Report’s Audience
Who will be reading your social media analytics report? Understanding your audience is crucial. If it’s for internal stakeholders, like marketing teams, they might prefer in-depth analysis and technical details. Conversely, if the report is for clients or executives, they might appreciate a more high-level overview with a focus on ROI and performance against goals. Tailoring the content and presentation to the needs and understanding of your audience will make your report more effective and actionable.
Step 2: Establish Your Goals and Objectives
What do you aim to achieve with your social media efforts? Clearly defined goals and objectives give direction to your marketing report. These could range from increasing brand awareness, boosting engagement, driving website traffic, to generating leads or sales. Ensure these goals are SMART – Specific, Measurable, Achievable, Relevant, and Time-bound. This clarity helps in not only guiding your strategy but also in measuring its success.
Step 3: Select the Right Metrics
The metrics you choose should align with your goals and provide meaningful insights. Vanity metrics like likes and followers might not be as valuable as engagement rates, click-through rates, or conversion rates. Consider also platform-specific metrics such as Instagram Stories views or LinkedIn engagement rates. Remember, the right metrics will offer a true measure of your social media strategy’s effectiveness.
Choosing the best metrics for social media marketing reporting largely depends on your specific goals and strategy. However, some universally important metrics are often considered essential across various campaigns and platforms:
- Engagement Rate: This includes likes, shares, comments, and clicks. High engagement rates typically indicate that your content resonates well with your audience.
- Reach and Impressions: Reach measures how many unique users have seen your content, while impressions count how many times your content was displayed. These metrics help you understand the extent of your content’s visibility.
- Follower Growth: Tracks the increase or decrease in your number of followers over time, indicating the growth of your audience.
- Click-Through Rate (CTR): The percentage of viewers who click on a link in your post. A high CTR suggests that your content effectively encourages viewers to take the desired action.
- Conversion Rate: Measures how many users who clicked on a link in your post completed a desired action, such as making a purchase or signing up for a newsletter. This is crucial for understanding the ROI of your social media efforts.
- Referral Traffic: The number of visitors coming to your website from social media platforms. It helps in understanding the role of social media in your overall web traffic.
- Customer Engagement Time: How long users spend interacting with your content. Longer engagement times can indicate more compelling content.
- Brand Mention Volume: The frequency with which your brand is mentioned on social media platforms can indicate brand awareness and sentiment.
- Sentiment Analysis: Understanding the tone of the conversations around your brand on social media – whether positive, negative, or neutral.
- Cost Per Click (CPC) and Cost Per Thousand Impressions (CPM): For paid social media campaigns, these metrics help you understand the cost-effectiveness of your advertisements.
These metrics should be aligned with your overall social media marketing objectives, whether that’s building brand awareness, driving website traffic, generating leads, or directly driving sales. By focusing on the metrics that directly relate to your goals, you can more accurately measure the success of your social media marketing efforts.
Step 4: Data Collection Process
Gathering data is a fundamental step in creating your report. Utilize social media analytics tools to collect data from various platforms. Ensure you’re capturing the right data that aligns with your selected metrics. This might include engagement data, audience demographics, post reach, and more. Organizing this data systematically is key to making your analysis process smoother.
Step 5: Delve into Performance Analysis
Now it’s time to dive deep into what the data is telling you. How well are your social media efforts aligning with your goals? Are certain platforms or types of content performing better than others? Analyzing performance helps in identifying successful strategies and areas that require improvement.
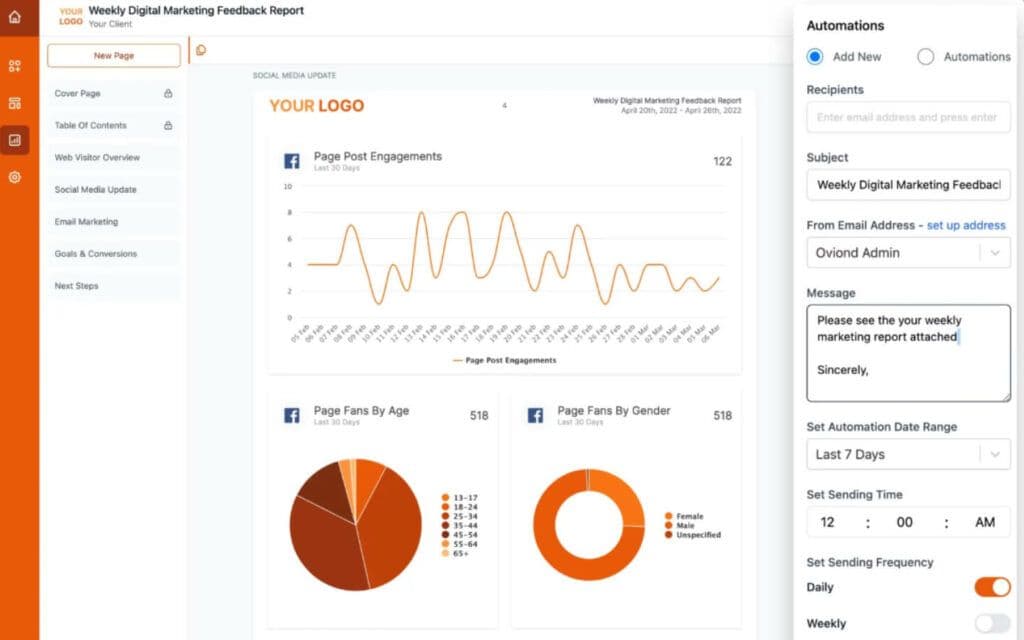
Step 6: Craft Engaging Visuals
Visuals can transform your social media analysis report from a data-heavy document to an engaging, easy-to-understand resource. Use charts, graphs, and infographics to represent data visually. This not only makes the report more appealing but also helps in conveying complex information more simply and effectively.
Step 7: Compare Historical Data
To understand the progress and trends over time, compare your current data with previous periods. This could reveal valuable insights into growth patterns, seasonal variations, or the impact of specific campaigns. It’s a critical step in assessing the long-term effectiveness of your social media strategy.
Step 8: Unveil Audience Insights
Who is engaging with your brand on social media? Understanding your audience is vital. This section should include demographics, preferences, and behavior patterns. These insights can help tailor future content and strategies to better resonate with your audience.
Step 9: Conduct a Competitive Analysis
How does your brand stand in comparison to competitors? Analyzing competitors can provide context to your performance and uncover gaps in your strategy or opportunities for differentiation. Look at their engagement rates, follower growth, content strategy, and more.
Step 10: Evaluate Your Campaigns
Review and assess the performance of specific campaigns. Did they meet their objectives? What was the ROI? Evaluating each campaign’s effectiveness helps in understanding what works and informs future campaign planning.
Step 11: Formulate Recommendations and an Action Plan
Finally, based on all the insights gathered, develop actionable recommendations and an action plan. This should include steps to enhance performance, capitalize on successful strategies, and address any areas of weakness. Your recommendations should be practical, achievable, and aligned with your overall social media objectives.
All-in-One Social Media Reports
Let’s talk about making life easier with all-in-one social media reporting tools. Imagine this: instead of jumping between Facebook, Instagram, Twitter, LinkedIn, YouTube, and Pinterest for data, you get everything in one neat package. That’s what digital marketing software solutions are offering now. These tools bring all your social media stats into one dashboard. It’s like having a command center for your digital marketing efforts. You can see how your content’s doing across different platforms, spot trends, and make sense of it all without breaking a sweat.
And the best part? It’s super easy to share this info with your team or clients. These all-in-one reports are not just time-savers; they’re insight goldmines that help you stay on top of your game in the ever-evolving digital world.
Drag and Drop Widgets
Picture this: You’re building a social media report and, instead of wrestling with complex software, you’re simply dragging and dropping widgets to create a custom report. That’s the beauty of modern reporting tools! They come with user-friendly drag-and-drop interfaces, making it incredibly easy to customize your reports. Whether you need a graph to show your latest engagement stats or a chart for follower growth, you just pick a widget and pop it into your report.
It gets better with pre-built templates. These are like blueprints for your reports, designed with specific goals in mind. Whether you’re presenting to a client or analyzing your monthly performance, there’s a template that’s just right for the job. And the pre-built sections? They are lifesavers. Think of sections like ‘Top Performing Posts’ or ‘Audience Demographics’ ready to use, saving you the time and effort of building them from scratch.
This drag-and-drop simplicity doesn’t just save time; it makes report customization accessible to everyone, regardless of their technical expertise. It’s all about making your reporting process as smooth and efficient as possible, giving you more time to focus on what really matters – your social media strategy.
White-Labeled Social Reports
White-labeled social reports are a gem in the realm of client reporting. Imagine creating detailed, insightful social media reports but with a twist – they’re branded with your agency’s logo, colors, and style. This isn’t just about adding a professional touch; it’s about making each report an extension of your brand. When you present a social media analytics report PDF to a client, it’s not just a bunch of graphs and numbers; it’s a sophisticated, branded document that carries your agency’s identity.
This level of customization boosts your brand’s credibility and reinforces your expertise in the digital marketing field. White-labeled reports are more than just data presentations; they’re a subtle yet powerful marketing tool for your agency, enhancing client trust and loyalty. With these reports, you’re not just delivering insights; you’re fortifying your brand’s presence in every client interaction.
Streamlining Success: The Power of Automated Social Media Marketing Reporting
Automation in social media reporting is like having a superpower. It’s all about efficiency and accuracy. With automated reporting, you can say goodbye to the tedious task of manually gathering data for your marketing report. Instead, imagine a system that automatically pulls the latest data from all your social platforms and compiles it into a comprehensive report at regular intervals, be it weekly, monthly, or quarterly.
It ensures consistency and precision in your reports. No more worrying about human errors or last-minute rushes to update figures before a client meeting. Your reports will always be up-to-date with the latest insights, ready when you need them.
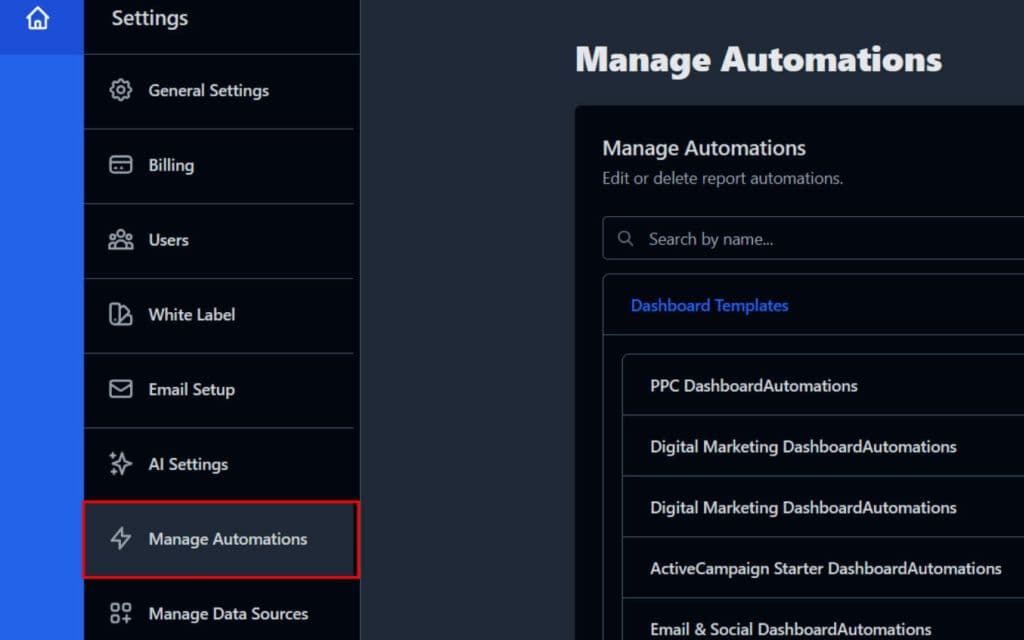
Moreover, automated reporting tools often come with customizable options, allowing you to highlight the metrics and goals most relevant to your or your client’s needs. They can even send these reports directly to your inbox or your clients’, making the process as hands-off as possible. With some platforms, such as Oviond, this is done within a few clicks under your settings.
In essence, automated social media marketing reporting lets you focus more on strategizing and less on the nitty-gritty of data compilation. It’s about working smarter, not harder, in the ever-evolving digital landscape.
Wrapping Up: Your Journey to Masterful Social Media Analytics Reports
And there we have it! We’ve journeyed through the intricate world of creating a Social Media Analytics Report PDF, exploring the nooks and crannies from defining your audience and goals to the final touches of crafting actionable recommendations. Remember, the magic lies in how you collect, analyze, and present your data. With tools like drag-and-drop widgets, white-labeled reports, and the sheer power of automation, your reporting process can be as efficient as it is impactful.
As you put these practices into play, think of your report not just as a collection of stats and numbers, but as a storytelling tool that brings your social media narrative to life. It’s your opportunity to showcase your successes, learn from the metrics, and continuously refine your strategy to stay ahead in the dynamic world of digital marketing.
So, go ahead and create that marketing report that not only informs but also impresses. With the right approach and tools, you’re well on your way to transforming complex data into compelling, strategic insights. Here’s to your success in making every report a stepping stone towards greater digital marketing achievements!
Frequently Asked Questions about Creating a Social Media Analytics Report PDF
How do I get a social media analytics report?
To get a social media analytics report, you can use social media analytics tools available in the market. These tools gather data from your social media accounts and generate reports that provide insights into your social media performance.
What is social media analytics examples?
Examples include tracking engagement rates, analyzing follower growth, measuring click-through rates, and assessing the performance of social media campaigns.
How do I get social media reports?
Obtain social media reports by using analytics features provided by social media platforms themselves (like Facebook Insights or Twitter Analytics) or third-party analytics tools that compile data across various platforms.
How do I check my social media analytics?
Check your social media analytics by accessing the analytics section on each social media platform or using a third-party analytics tool to consolidate data across different platforms.
What are the types of analytics available in social media analytics?
Types include descriptive analytics (what happened), diagnostic analytics (why it happened), predictive analytics (what could happen), and prescriptive analytics (what should be done).
What is social media in data analytics?
In data analytics, social media refers to analyzing data from social media platforms to gain insights into audience behavior, campaign performance, and overall social media strategy effectiveness.
What are the 4 types of social media analytics explained?
Descriptive Analytics: Understanding what has happened over a certain period. Diagnostic Analytics: Finding reasons behind a particular trend or result. Predictive Analytics: Anticipating future trends based on current data. Prescriptive Analytics: Suggesting actions based on insights gathered.
What should I check for social media analytics?
Check metrics like engagement rates, reach, impressions, follower demographics, referral traffic, and conversion rates to understand the effectiveness of your social media efforts.
How do you summarize a social media report?
Summarize a social media report by highlighting key findings, summarizing performance against goals, noting significant trends or changes, and recommending next steps.
What should a social media report contain?
A social media report should contain metrics such as engagement, reach, audience growth, demographic data, performance by platform, and ROI of social media campaigns.
What are the 7 layers of social media analytics in data analytics?
The 7 layers can include: Listening (monitoring conversations) Engagement (interaction levels) Performance (effectiveness of content) Competitive analysis (benchmarking against competitors) Campaign analysis (specific campaign performance) ROI analysis (return on investment) Sentiment analysis (emotional tone of interactions)
How do you write a social media report summary?
To write a social media report summary, present a concise overview of the key findings, outline the success or challenges faced, and suggest actionable steps based on the report’s insights.
How do I create a social media analytics report for free?
You can create a social media analytics report for free using the analytics tools provided by social media platforms themselves, or free versions of third-party tools, and manually compiling the data into a report format.
How do I create a yearly social media report?
Create a yearly social media report by compiling data from the entire year, analyzing year-over-year trends, evaluating the performance against the year’s objectives, and summarizing key takeaways and recommendations for the next year.
What are the steps of social media analytics?
The steps include defining objectives, selecting relevant metrics, collecting data, analyzing the data, interpreting results, and making informed decisions based on these insights.
What is the social media analytics cycle?
The social media analytics cycle is a continuous process of monitoring, measuring, analyzing, and interpreting data from social media channels to inform and optimize social media marketing strategies.
What does social analytics include?
Social analytics includes analyzing data from social media platforms to understand audience behavior, engagement patterns, campaign performance, content effectiveness, and overall social media strategy impact.
Related articles
Simplify Marketing Reporting Today
Stop juggling multiple tools. Start presenting clear, automated reports your clients will love