In a world where we’re swimming in data, figuring out what really counts can be a bit like finding a needle in a haystack. For businesses, it’s not just about having heaps of data; it’s about making sense of it all. Think of it as starting a puzzle – you need to know your audience, pick up the right pieces (that’s your data), and then put them together to see the big picture.
This is where KPIs (Key Performance Indicators) come into play, helping to tidy up the mess. KPI reporting tools? They’re like your secret weapon to make this whole process easier. Let’s look at what KPIs are all about and dive into the nitty-gritty of KPI reporting. Stay tuned!
Table of Contents
What is a KPI?
A KPI is a metric used to measure the performance of a project or a business in achieving specific goals. KPIs are like milestones, providing valuable insights to guide better decision-making. They are applicable across various business areas and industries, offering a realistic view of a business’s performance, including risk factors, opportunities, and financial indicators. KPIs are strategic and impactful for business planning, differentiating from other metrics by their critical role in guiding and measuring success and future planning.
A KPI report is a performance tracking tool that enables quick analysis of key performance indicators to understand an organization’s progress towards specific goals. It typically includes data visualization through charts, tables, and graphs, and modern KPI reports are interactive, allowing easy access to underlying data and reorganization of displayed information for changing focus.
What is a KPI Report and are They Important?
A KPI report is basically your business’s performance snapshot. It’s like a report card showing how well you’re hitting your key goals. Picture a dashboard filled with charts and graphs that track things like sales, customer satisfaction, or website traffic – that’s your KPI report. Super useful, right?
And are they important? Absolutely! Think of them as your business’s GPS. They help you see if you’re on the right track, flag any detours (like areas needing improvement), and make sure everyone in your team is heading in the same direction. So, yeah, KPI reports are pretty crucial for steering your business towards success.

How to Start a KPI Report
Starting a KPI report might feel daunting, but with a clear roadmap, it becomes much more manageable. The first step is understanding your goals. What do you want to achieve with this report? Once your objectives are clear, select the right KPIs that align with these goals. Remember, it’s not just about picking any KPIs, but those that are most relevant to your objectives.
Next, check your data. Ensure it’s accurate, up-to-date, and relevant. You’re building a report that relies on this data, so its quality is paramount. Also, know your audience. Who will be using this report? Tailor it to their needs and understanding level.
Finally, consider how you’ll visualize the KPIs. Charts, graphs, and tables can make your report more understandable and engaging. Keep in mind that the presentation should enhance the report’s clarity, not complicate it. In short, your KPI report should be a well-thought-out document that reflects your goals, uses accurate data, caters to its audience, and presents information clearly and effectively.
7 Great Types of KPI Tools
In the realm of KPI tools, there are several standout options, each bringing unique strengths to the table. Some tools excel in web analytics, offering in-depth insights into user behavior and site metrics. Others are tailored for search engine optimization, tracking your site’s visibility and health on search engines. For those focused on social media, certain tools provide extensive monitoring and reporting capabilities. For complex data visualization needs, there are platforms that transform intricate data sets into easily digestible visuals. Additionally, integrated tools exist that combine marketing, sales, and customer relationship data, offering a comprehensive overview of business performance. Each tool is designed to cater to specific aspects of KPI reporting, ensuring there’s something for every need.
1. Google Analytics 4
Google Analytics 4 stands out as a formidable KPI tool, primarily for its comprehensive approach to web analytics. It excels in tracking user behavior, site traffic, and engagement metrics, providing deep insights into how visitors interact with your website. This tool is essential for businesses aiming to understand their online audience, enhance user experience, and optimize their websites for better performance.
By offering detailed reports on metrics like pageviews, bounce rates, and conversion paths, Google Analytics helps in setting and monitoring key performance indicators related to website and marketing campaign effectiveness. Its ability to segment data and track user journeys makes it a valuable asset for data-driven decision-making, enabling businesses to tailor their strategies based on real-time insights.
2. Google Search Console
Google Search Console is a vital KPI tool for anyone keen on SEO. It offers a clear view of how a website performs in search engine results, providing key insights into search queries, the average position of your pages, click-through rates, and more. This tool is instrumental in understanding the organic search performance of your website and identifying areas for improvement.
It helps in monitoring your site’s search traffic, tracking which queries bring users to your site, and analyzing your site’s indexing status. By providing data on backlinks and internal linking structures, Google Search Console plays a crucial role in shaping an effective SEO strategy, making it an indispensable tool for businesses focused on enhancing their online visibility.
3. Google Ads, Facebook Ads, LinkedIn Ads
Google Ads, Facebook Ads, and LinkedIn Ads serve as key KPI tools for Pay-Per-Click (PPC) campaign management. These platforms provide crucial performance metrics that enable advertisers to measure the effectiveness of their campaigns.
- Google Ads offers insights into click-through rates, conversion rates, and cost-per-click, helping businesses optimize their search engine advertising.
- Facebook Ads provides detailed data on user engagement, audience demographics, and ad performance on social media.
- LinkedIn Ads is invaluable for B2B marketers, offering metrics tailored to professional audiences, like job function and company size, alongside standard PPC metrics.
Each tool allows businesses to track specific KPIs relevant to their campaigns, ensuring they can measure success accurately and make data-driven adjustments to enhance performance.
4. Ahrefs and Semrush
SEO tools like Ahrefs and Semrush are invaluable KPI tools for tracking and enhancing search engine optimization efforts. Ahrefs excels in backlink analysis, helping to understand the link profile of both your own and competitors’ websites. It also provides keyword research, site audits, and ranking tracking.
Semrush, on the other hand, offers a broad suite of SEO tools including keyword research, site audits, and competitive analysis. It also provides insights into organic search, paid search, and content marketing strategies.
Both tools provide a wealth of data that helps in tracking SEO performance indicators, such as keyword rankings, backlink quality, and organic traffic. This data is crucial for businesses aiming to improve their search engine visibility and outperform their competition in organic search results.
5. Facebook, Instagram, and Twitter
Social media platforms like Facebook, Instagram, and Twitter are key KPI tools for measuring engagement and performance in the social media realm. These platforms provide detailed analytics that help businesses understand how their content is performing. Metrics such as likes, shares, comments, follower growth, and engagement rates are crucial for assessing the impact and reach of social media campaigns.
These insights enable businesses to tailor their content strategies, optimize posting schedules, and engage more effectively with their audience. By leveraging the data provided by these social media platforms, companies can make informed decisions to enhance their social media presence and connect more deeply with their target audience.
6. MailerLite and ConvertKit
Email Marketing Tools like MailerLite and ConvertKit serve as crucial KPI tools for analyzing email campaign performance. These platforms offer detailed metrics such as open rates, click-through rates, and conversion rates, which are essential for understanding how recipients interact with your emails.
They allow businesses to segment their audience, personalize content, and automate campaigns, making it easier to tailor strategies for better engagement. By providing insights into subscriber behavior and campaign effectiveness, these tools enable marketers to refine their email strategies, enhance communication with their audience, and ultimately drive better results from their email marketing efforts.
7. Twilio and CallRail
Call Tracking Tools like Twilio and CallRail are pivotal KPI tools for measuring the effectiveness of call-based marketing campaigns. They offer valuable insights into call volumes, call sources, and caller behaviors. These tools enable businesses to track which marketing efforts are driving calls, allowing for a precise analysis of campaign performance.
By recording and analyzing call data, these tools help in optimizing marketing strategies and improving customer engagement. They provide critical data that assists in understanding the ROI of marketing campaigns, especially those aiming to generate phone inquiries or sales, making them essential for businesses that rely heavily on phone interactions.
Let’s face it, in the fast-paced world of business, companies often end up using a bunch of different KPI tools, which can get pretty overwhelming. Imagine trying to piece together a puzzle with pieces from different boxes – that’s what it’s like! That’s where a tool that brings everything together comes in handy. Think of it as your data gathering superhero, pulling all your KPI info into one neat, easy-to-read dashboard. It’s like having a one-stop-shop for all your data needs, saving you time and giving you the full picture in a way that’s way easier to understand and use.

KPI Reporting Solutions: All Your Data in one Place
With KPI tracking tools like the ones below, you can dive deep into your marketing efforts, checking out everything from social media engagement to email campaign performance, all in one place. They turn data analysis from a headache into a breeze, making it easy to spot trends, track progress, and make informed decisions. They’re an absolute game-changer for staying on top of your marketing game!
Oviond
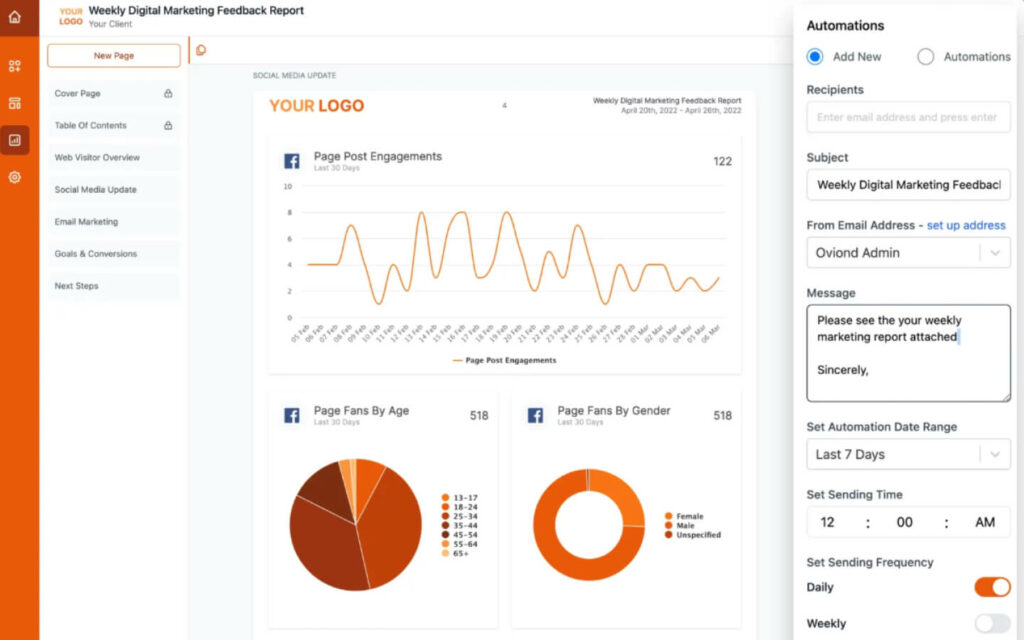
Oviond is a digital marketing platform known for its ease of use, offering manual client onboarding, built-in dashboard templates, and effective data integration from multiple sources. It stands out for white-labeling capabilities and a clean interface, and cost effectiveness.

Strengths in Oviond’s Dashboard Reporting System
- Client Management: Allows manual onboarding of clients into folders with custom dashboards for each
- Built-in Templates: Comes with built-in dashboard templates covering various profiles such as Website Traffic, Sales Data, SEO Data, and Ads Data
- White Labeling: Offers white-label features for client previews with branded logos and the ability to connect your own domain/subdomain
- Intuitive and Easy Installation: Oviond is recognized for its intuitive interface and quick setup process, with users able to integrate data from multiple sources swiftly
- Ease of Dashboard Creation: The platform allows for the easy creation of dashboards, streamlining the process of aggregating data
- Comprehensive Data Integration: Oviond can pull data from key sources like Analytics and Social Media, facilitating thorough data analysis and reporting
- Efficient Client Onboarding and Project Classification: Offers efficient manual client onboarding into folders and allows for the classification of different projects with various data sources
- Clean Interface: The platform’s interface is praised for its clean and appealing design, enhancing user experience
Oviond’s Limitations in Reporting Metrics Dashboards
- Opportunity for More Learning Resources: Some users have expressed a desire for additional tutorials to enhance their experience
- Adjusting to Platform Changes: Recent updates to Facebook’s API have impacted the tool’s functionality, reflecting its adaptability to external changes
- Mobile Accessibility: The absence of a mobile application has been noted as an area for potential improvement, as it would increase convenience for users
- Enhancing Widget Flexibility: Feedback includes suggestions for improving widget functionality, particularly in terms of refreshing capabilities and expanding Google My Business integration options for each client
Oviond’s Pricing
Oviond’s pricing structure is designed to cater to a range of needs, starting from $39 per month for handling up to 5 clients, with unlimited dashboard and reporting projects. This basic plan is ideal for new agencies or consultants, offering all data sources and costing $7.80 per client per month. For small agencies managing up to 20 clients, the price is $99 per month, breaking down to $4.95 per client. This plan includes unlimited projects, automation, and white label features, along with a custom domain.
For larger agencies, the Regular Agency plan accommodates up to 60 clients at $199 per month, which works out to $3.31 per client. This plan includes all the features of the small agency plan, plus 1-on-1 service. At the top end, established agencies can opt for the Large Agency plan at $399 per month, managing up to 180 clients. This equates to just $2.21 per client and includes advanced features like custom templates, account management, and assisted setup or migration.
Oviond is particularly suitable for small to medium-sized digital marketing agencies seeking a user-friendly and comprehensive platform for client management and reporting with the advantage of competitive pricing. It offers efficient setup, intuitive design, and white-labeling features, aligning well with agencies that need to efficiently manage and present diverse marketing data.
Supermetrics
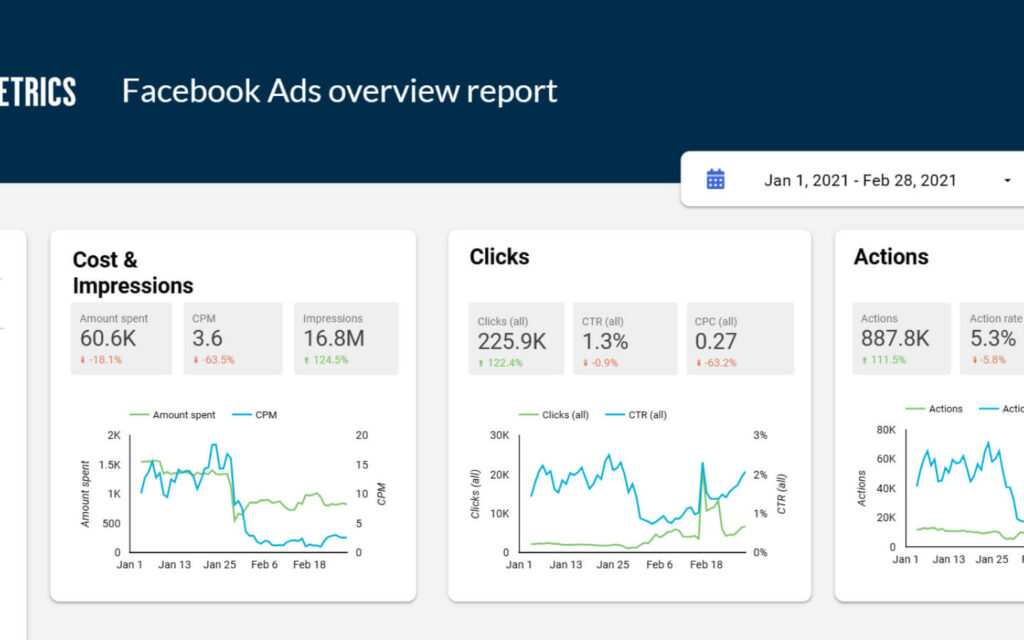
Supermetrics streamlines data integration and automation for marketing analytics, with user-friendly features and extensive connectors. It’s particularly efficient for single-user operations but is noted for high costs and performance lags with large data sets.

Supermetrics’ Strengths in Dashboard and Reporting Software
- Automated and Easy: Offers automated updates, query automation, and is user-friendly, particularly for less technical users
- Integration and Connectivity: Boasts a wide range of platform integrations and connectors, with the ability to schedule refreshes
- Data Management: Provides unsampled data, fast processing, and expanded data formatting options
- Templates and Reporting: Includes free templates for dashboards and supports automated reports with triggers
Challenges in Supermetrics’ Reporting Metrics Dashboards
- Opportunities for Field Enhancement: There’s room for improvement in aligning certain fields with ad platforms and expanding the availability of some fields
- Exploring User Access Options: Currently, the tool is designed for single-user access, presenting an opportunity to expand its utility for team collaboration
- Optimizing for Large Data Sets: Users have observed that query performance could be enhanced, especially when handling extensive data sets
- Balancing Cost and Value: The tool’s pricing is an area for consideration, as some users feel there could be a better balance between cost and the value provided
- Consistency in Documentation: Enhancing the consistency in documentation, particularly for metric names across various data sources, could improve user experience
Supermetrics’ Pricing
Supermetrics offers a versatile pricing structure with 15 different plans, catering to various data integration and reporting needs. The pricing depends on the data destination, with options for visualization tools like Looker Studio, spreadsheets (Google Sheets and Excel), data warehouses (Google BigQuery, Snowflake, Redshift), and data lakes (S3, Google Cloud Storage). For example, using Supermetrics with Looker Studio starts from €39 per month, which includes one data source, one user, and a maximum of 10 accounts per data source.
For integration with Google Sheets, the starting price is €99 per month for the Essential package, which provides 11 essential data sources, one user, and 10 accounts per data service. Similarly, the starting price for integration with Microsoft Excel is also €99 per month, offering 7 essential data sources, one user, and 10 accounts per data source. For integration with Monday.com, the pricing starts from €19 per month, allowing data loading from 6 sources in the Paid media category, with 10 accounts per data source and daily automated refreshes.
Supermetrics is particularly suitable for businesses and marketing professionals who require extensive data integration from various sources for in-depth analysis. Its strengths in automated updates, a wide range of connectors, and user-friendly UI make it ideal for users needing to consolidate and analyze large amounts of data efficiently. The platform is well-suited for larger agencies or companies with complex reporting needs and the capacity to invest in a more comprehensive tool. However, its cost and potential performance issues with large datasets might be considerations for smaller businesses or those with more limited data analysis requirements.
Databox
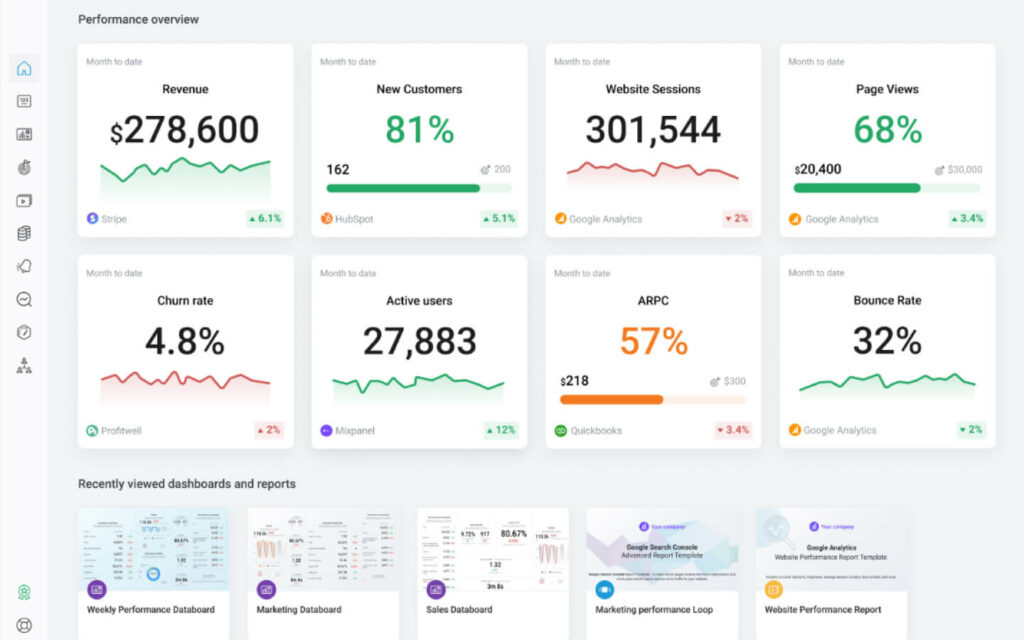
Databox offers robust dashboard creation and multiple integrations, with strong visual appeal and goal tracking features. Its user-friendly interface and customizable options make it accessible for both novice and experienced users.

Strengths in Databox’s Reporting Metrics Dashboards
- Dashboard Creation: Databox is praised for its dashboard creation capabilities
- Integrations: Offers numerous integrations with various data sources
- Visual Presentation: Known for visually appealing dashboards
- Goal Tracking: Allows setting and tracking of goals based on provided data and metrics
- Automatic Data Connection: Connects data sources automatically without complex setup
- Reporting Flexibility: Supports different reporting frequencies like daily, weekly, and monthly
- Custom Dashboard Design: Enables the design and creation of custom dashboards
- Timesaving: Creates real-time measurements, saving time and energy
Challenges in Databox’s Dashboard and Reporting Software
- Exploring Additional Direct Integrations: There’s a growing interest among users for more direct integrations to enhance functionality and reduce reliance on external services like Zapier
- Enhancing Historical Data Capabilities: Users have suggested extending the range for historical data reporting to accommodate longer time frames
- Expanding API Connectivity: There is an opportunity to broaden the range of API connectors, catering to both existing needs and potential new integrations
- Streamlining Report Setup: Simplifying the process of setting up and connecting to various data sources could enhance user experience
- Diversifying Template Options: There’s a user interest in expanding the variety of available templates, especially those accommodating multiple data sources
- Strengthening Digital Marketing Tool Integration: Augmenting integrations specifically for digital marketing tools could address current gaps
- Reconsidering Pricing for Branding Features: The pricing structure for white label and branding features, particularly in higher-tier plans, is an area for review based on user feedback
Databox’s Pricing
Databox offers a range of pricing plans, starting with a free-forever option that includes 3 data source connections and over 60 integrations. For those requiring more functionality, there are paid plans categorized as Starter, Professional, and Performer.
The Starter plan, at $72 per month, is tailored for small teams needing daily performance monitoring and reporting, offering 5 users, 12+ standard features, 3000+ pre-built metrics, 4 data boards, and 4 data source connections. The Professional plan, priced at $135 per month, is designed for small and mid-sized businesses and includes features like Google Sheets and SQL database integrations, 9 data boards, and hourly data updates, catering to 25 users. The Performer plan, at $231 per month, is suited for businesses focused on performance improvement, offering unlimited users, unlimited data boards, unlimited historical data, advanced reporting features, and hourly data updates.
Databox is ideal for businesses and marketing professionals seeking a user-friendly platform for data visualization and performance tracking. It’s particularly well-suited for those who need to set and monitor goals based on a variety of data sources. The tool’s strong points in ease of use and custom reporting make it a good choice for teams looking for a straightforward way to track key performance indicators and report results. However, its pricing structure and limited historical data reporting might be considerations for smaller businesses or those with more constrained budgets.

Benefits of Using a KPI Reporting Tool
Whether you’re already knee-deep in KPI tools, just starting your research, or hunting for that perfect solution to pull all your data together and streamline your reporting, understanding the benefits of a KPI reporting tool is key. These tools aren’t just about crunching numbers; they’re about making those numbers work for you. Whether you’re a seasoned data analyst or a newbie to the world of KPIs, these tools are designed to simplify your life and supercharge your business strategies.
- Smarter Decisions, Just Like That: Real-time data helps you make well-informed choices.
- Keeping an Eye on Performance: Tracks your key metrics constantly, so nothing slips through the cracks.
- Makes Your Life Easier: It’s all about automating the nitty-gritty of data collection and reporting.
- Everyone’s Rowing in the Same Direction: Aligns your team’s efforts with your big-picture goals.
- Data? Now It’s a Visual Treat: Transforms complex numbers into easy-to-understand visuals.
- Spot Trends in a Snap: Helps you catch onto business trends quickly.
- Strategy’s Best Friend: Supports you in shaping and reshaping your business strategies.
- Saves Precious Time: Cuts down the hours spent on manual data crunching.
- Your Report, Your Rules: Allows customization for reports that fit just right with your needs.
- See the Whole Picture: Offers a complete view of your business’s health across different areas.
The Final Word on KPI Reporting Tools
The power of KPI reporting tools in today’s data-driven business landscape cannot be overstated. As we’ve explored, these tools provide vital insights into various aspects of business performance, from web analytics and SEO to social media and email campaign effectiveness. Tools like Google Analytics, Search Console, and various social media and email marketing platforms offer tailored analytics to help businesses focus on what matters most.
Moreover, with Performance Dashboard Software like Oviond, Supermetrics, and Databox, integrating and visualizing data across these multiple sources becomes seamless, saving time and offering a holistic view of performance. This comprehensive approach to data analysis and reporting is crucial for making informed decisions and steering businesses towards success in an increasingly competitive market.
Frequently Asked Questions on KPI Reporting Tools
What are KPI Reporting Tools?
Tools for tracking and analyzing Key Performance Indicators in business.
Why use KPI Reporting Tools?
They help in making data-driven decisions and improving business performance.
Can KPI Reporting Tools automate data collection?
Yes, they automate and streamline data collection and analysis.
Do these KPI reporting tools offer data visualization?
Absolutely, they provide charts, graphs, and tables for easy data interpretation.
Are KPI Reporting Tools suitable for small businesses?
Yes, they’re scalable and useful for businesses of all sizes.
Can I customize reports in KPI Reporting Tools?
Definitely, most tools offer customizable reporting options.
How do KPI Reporting Tools enhance decision-making?
By providing real-time, relevant data to base decisions on.
Can these tools track marketing ROI?
Yes, they’re excellent for tracking marketing campaigns and ROI.
Do KPI Reporting Tools integrate with other software?
Many integrate seamlessly with various business software.
How do these tools help with goal alignment?
They ensure team efforts are focused on key business objectives.
Are KPI Reporting Tools user-friendly?
Many are designed with intuitive interfaces for ease of use.
Can I access KPI Reporting Tools on mobile?
Most modern tools offer mobile access for on-the-go monitoring.
Do these tools support strategic planning?
Yes, they provide data insights crucial for strategic planning.
How do KPI Reporting Tools save time?
They reduce manual data collection and report generation efforts.
Can I track social media performance with these tools?
Yes, many tools have features for social media analytics.
Are KPI Reporting Tools expensive?
There’s a wide range, with options for various budgets.
Do these KPI reporting tools require technical expertise?
Not necessarily, many are built for non-technical users.
Can I track employee performance with KPI tools?
Yes, some tools are designed for internal performance tracking.
How do KPI Reporting Tools differ from traditional reporting?
They offer more real-time, interactive, and comprehensive data analysis.
Is data security a concern with these tools?
Reputable tools have strong data security and privacy measures.
