
In a world where data drives decisions, dashboard and reporting software stand as essential tools for marketing agencies of all sizes. This guide explores the capabilities of different dashboard reporting systems, powerful tools known for their seamless data integration and ease in marketing reporting. Whether you’re looking to streamline your data analysis or enhance decision-making for your clients, this article is a compact yet comprehensive journey into the transformative world of dashboards and reporting software.
Table of Contents
What Is Dashboard and Reporting Software?
A Dashboard Reporting Tool is a dynamic and interactive software application that serves as a centralized hub for businesses to visualize, analyze, and interpret data. Imagine a control panel tailored to your business needs, displaying real-time metrics, trends, and insights – that’s exactly what these tools offer. They are designed to transform complex data sets from various sources into easily digestible visual representations, like graphs, charts, and tables. This not only streamlines the decision-making process but also ensures that insights are accessible to all levels of an organization. Whether you’re tracking sales performance, monitoring marketing campaigns, or analyzing customer behavior, a Dashboard Reporting Tool acts as your data’s storyteller, making information not just available but actionable.
The Top Qualities of a Good Reporting and Dashboard Tool
Identifying the top qualities of a good reporting and dashboard tool is crucial for businesses aiming to optimize their data analysis and decision-making processes. These tools should not only provide comprehensive and accurate insights but also enhance the efficiency and effectiveness of marketing strategies.
Key attributes include seamless data integration, intuitive user interfaces, robust customization options, and stringent security protocols. The right tool empowers businesses with the ability to distill complex data into actionable insights, ensuring that data-driven decisions are both informed and impactful.
Important attributes include the following:
- Comprehensive Data Integration: A top-notch tool seamlessly integrates with various data sources, ensuring a unified view of information across different platforms.
- User-Friendly Interface: Ease of use is critical, with intuitive navigation and straightforward functionality making it accessible for users of all technical levels.
- Real-Time Data Processing: The ability to process and display data in real-time, offering up-to-the-minute insights for timely decision-making.
- Customization and Flexibility: Offers users the ability to customize dashboards and reports to meet specific business needs and preferences.
- Robust Data Security: Ensures the utmost security of data with encryption, access controls, and compliance with data protection regulations.
- Scalability: Capable of handling growing amounts of data and user needs, making it suitable for businesses of all sizes.
- Collaboration Features: Allows for easy sharing and collaboration on reports and dashboards within teams or with clients.
- Automated Reporting: The ability to automate the generation and distribution of reports, saving time and ensuring consistent information dissemination.
- Visual Appeal: Incorporates visually engaging elements like graphs, charts, and color-coding for an enhanced user experience and easier data comprehension.
- Technical Support and Training: Offers reliable customer support and resources for learning, ensuring users can fully leverage the tool’s capabilities.

Top 10 Dashboard and Reporting Software
In the dynamic realm of dashboard and reporting software, a diverse array of tools stands out, each distinctively catering to the varied preferences and requirements in digital marketing. These platforms, presented in no particular order, offer unique strengths to address specific challenges in data analysis and client reporting. From robust integrations to customizability and automated workflows, they exemplify the multifaceted nature of today’s digital marketing tools, providing tailored solutions for different analytical and reporting needs.
Agency Analytics
Agency Analytics is a digital marketing tool known for its powerful dashboard, extensive service integrations, and robust SEO/SEM reporting. It is praised for user-friendliness and responsive customer support.
Dashboard Analysis Report Strengths in Agency Analytics
- Powerful Dashboard: Offers an effective, user-friendly dashboard for managing marketing data
- Extensive Integrations: Compatible with many services, including Google Analytics
- SEO and SEM Reporting: Robust capabilities for SEO, SEM, and paid/organic social reporting
- Customer Support: Notable for its responsive and helpful customer support
- Ease of Use: The platform is user-friendly with straightforward functions
- Visual Data Representation: Offers clear visual representations of data
- SEO Tools: Includes comprehensive SEO site audit abilities and supports both local and global SEO
Agency Analytic’s Dashboard Reporting System Challenges
- Variability in Rank Tracking: Some users have noted occasional variations in rank tracking, though these instances are not consistent
- Customization in Data Import: The platform offers customization options, with a scope for enhancement, particularly in data import
- Range of Analysis Tools: The platform provides a selection of analysis tools, with room for expansion in areas such as goal tracking
- Conversion Tracking Effectiveness: The efficiency of conversion tracking is an area identified for potential improvement
- Feature Richness: The wide array of functionalities offered might be quite comprehensive for some users
- Essential Features Focused: The platform focuses on delivering fundamental features, with potential for adding more advanced capabilities
Key features of Agency Analytics, as highlighted by reviews, include:
- Dashboard: Live Client Reporting: This feature allows users to integrate data from various sources like Google Analytics and social media accounts into a single dashboard, where it can be organized and white-labeled for client review. This saves time in tracking client metrics and provides an accessible overview of important data on a single screen.
- Rankings: Track Keyword Rankings Over Time: This built-in tool enables tracking of keyword rankings in search engines like Google and Bing, showing current rankings and how they change over time. It’s a core part of Agency Analytics’ reporting focus.
- Site Auditor: This tool helps with SEO audits by identifying common technical SEO issues such as missing alt text, duplicate H1 tags, pages without a meta description, duplicate content issues, and broken links.
- Reports: Send Branded Reports to Clients: Known as the platform’s main feature, it allows agencies to send monthly branded reports to clients, summarizing key data. These reports can be white-labeled to match the agency’s brand and can be created swiftly within the platform, with options for automatic monthly report generation.
- Automated Reports, Marketing Dashboards, and SEO Tools: These are also supported features according to TrustRadius, further emphasizing Agency Analytics’ focus on comprehensive, automated reporting and SEO functionality.
These features collectively contribute to Agency Analytics’ reputation as a versatile and efficient tool for digital marketing agencies, streamlining various aspects of client reporting and SEO analysis.
Agency Analytics would suit marketing agencies and professionals who require a powerful, all-in-one platform for managing and reporting on their digital marketing efforts. It’s particularly beneficial for those who value extensive integrations with various digital marketing tools, robust SEO and SEM reporting capabilities, and a user-friendly dashboard. The platform’s ability to offer clear visual representations of data, along with its responsive customer support, makes it ideal for agencies needing to present data effectively to clients. However, its pricing and some limitations in customization and analysis tools should be considered based on the specific needs and size of the agency.
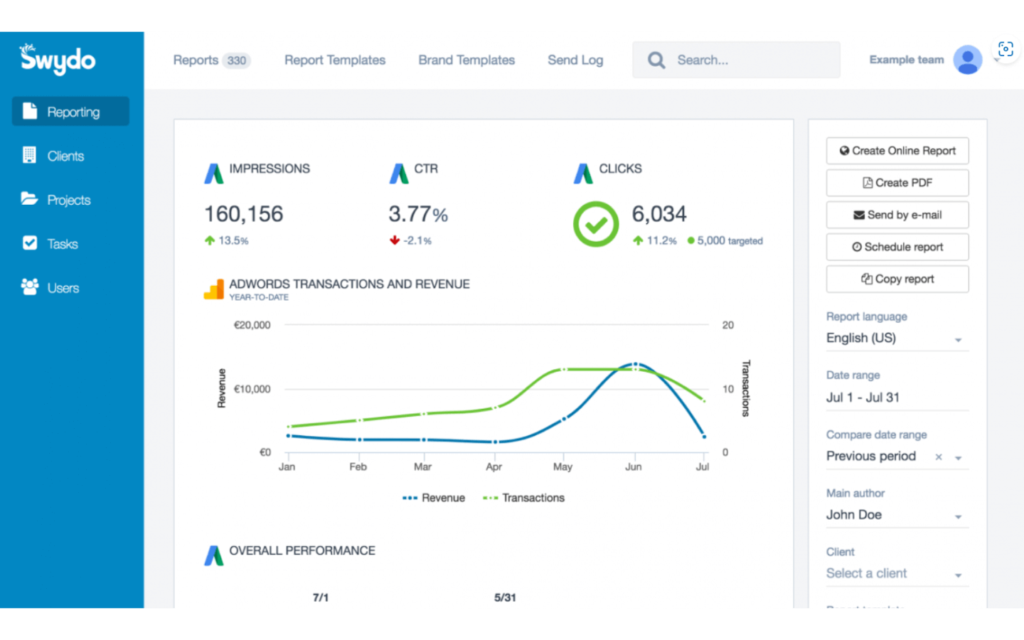
Swydo
Swydo is a digital marketing tool known for its customizable reporting, user-friendly interface, and effective integration with platforms like Google Ads and Analytics. It’s appreciated for its affordability and ease of use, but some users note limitations in UI design and occasional performance issues.
Swydo’s Reporting Metrics Dashboards Strengths
- Customization and Flexibility: Swydo is celebrated for its high customization in report creation, enabling users to tailor templates to specific client needs
- User-Friendly Interface: The platform is easy to use, especially for creating custom reports for Adwords and Facebook ads campaigns
- Integration Capabilities: It integrates well with Google Ads and Google Analytics, facilitating comprehensive report creation
- Effective Reporting Dashboards: The dashboards are user-friendly, saving significant time in client and account management
- Responsive Customer Support: Users have highlighted the effectiveness of Swydo’s customer support, including their assistance in fixing issues and expanding features
- Cost-Effectiveness: Swydo is noted for being a more affordable option, particularly for PPC reporting
Reporting Metrics Dashboards Limitations in Swydo
- Limited Interface Customization: Feedback suggests room for enhancement in dashboard interface customization and modernizing the UI
- Performance Issues: Some users have experienced slower load times for reports/dashboards and occasional widget glitches
- Visual Design Limitations: There’s scope for improvement in the platform’s visual design, especially in the Facebook and Google Ad previews
- Customer Support Inconsistencies: Experiences with customer support vary, with some facing challenges in timely problem resolution and communication
- Data Accuracy Concerns: Occasional inaccuracies in data display within widgets and response times to these issues have been observed
The key features of Swydo, as per reviews, include:
- Customizable Reports: Swydo allows creation of fully tailored reports, with a variety of types and dynamic templates, including branding and visualization options.
- Data Integration: It integrates with numerous marketing platforms and data sources, such as Google Analytics, Google Ads, and social media platforms.
- Automation: Features automation for scheduling and emailing reports, enhancing time efficiency and report timeliness.
- Advanced Analytics: Provides in-depth analytics tools for detailed data analysis and insight generation.
- Collaboration: Facilitates secure sharing of reports and dashboards with team members and clients.
- Cost-Effective: Offers a range of affordable pricing plans, making it suitable for small and medium-sized businesses.
These features position Swydo as a versatile and efficient solution for marketing analytics and client reporting.
Swydo is particularly suitable for marketing agencies and professionals looking for a tool that emphasizes report customization and client communication. Its strength lies in creating detailed and visually appealing reports easily, making it ideal for agencies that regularly update clients on campaign performance. The platform’s user-friendly interface and time-saving automated reporting features also make it a good choice for those with limited technical expertise or those seeking to streamline their reporting process. However, it may be less suited for users requiring more advanced analytics capabilities or a wider range of data integrations.
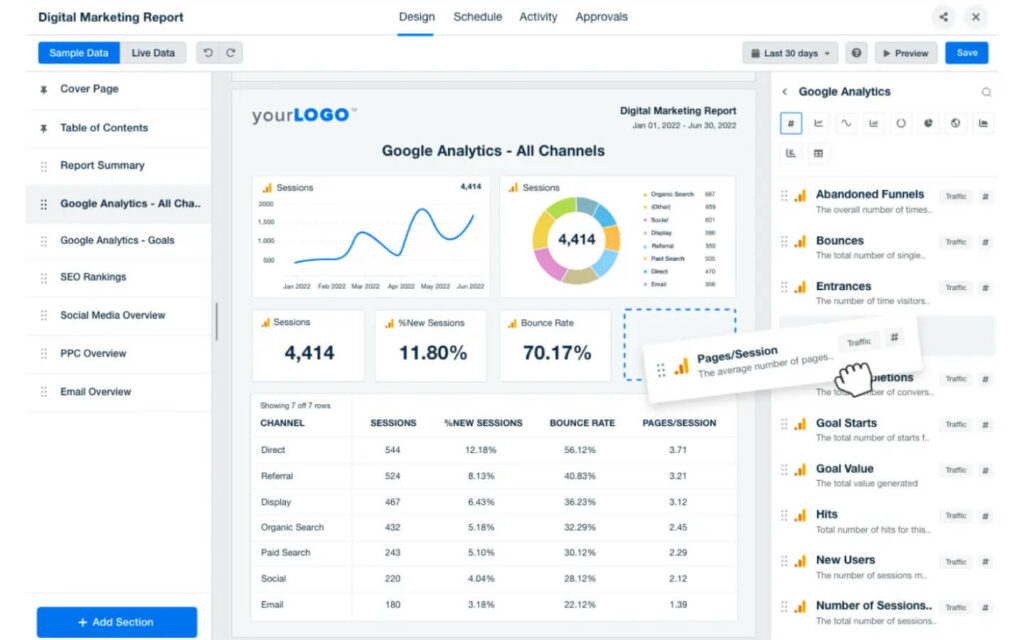
ReportGarden
ReportGarden offers efficient, customizable reporting and multi-platform integration for digital marketing agencies. It’s user-friendly and timesaving, though it may come with a steeper price and a learning curve for more advanced features.
Advantages in ReportGarden’s Dashboard Analysis Reports
- Customizable Reports: Users appreciate the diverse templates and options for report customization to meet specific needs
- Automated Reporting: The tool allows for scheduling automated reports, which streamlines the reporting process and saves time
- Workflow Management Tools: Features like client portals and task management enhance agency workflow management
- Broad Integration: It supports a wide range of integrations, including Google Analytics and various ad platforms, which is crucial for cross-platform reporting
- White-label Options: Agencies can brand reports with their own logo and branding, a feature that adds professionalism to client communications
- Time and Cost Savings: Agencies report significant savings in time and administrative costs, enabling focus on revenue-generating activities
- Simplicity and Efficiency: ReportGarden is designed to be user-friendly, even for newer employees, facilitating ease of use and greater efficiency in campaign management across multiple platforms
Challenges in ReportGarden’s Dashboard Reporting System
- Pricing Considerations: The starting price of $65 per month may be a consideration for smaller agencies
- Learning Process: Users may experience a learning phase to fully leverage the platform’s features and capabilities
- Customization Potential: While offering customization, there is potential for enhanced flexibility in comparison to other reporting tools
- Customer Support Enhancement: Opportunities exist to enhance customer support responsiveness and expand help documentation
- Balance of Simplicity and Complexity: The platform’s simplicity, while advantageous, may need additional depth for complex client needs, with some integration challenges noted
Key features of ReportGarden, as highlighted in reviews, include:
- Reporting: Enables the creation of customized reports to show clients the performance of their campaigns across various channels.
- Dashboards: Offers real-time data visualization through customizable dashboards, aiding in monitoring and optimizing campaigns.
- Task Management: Allows for assignment and tracking of tasks within the platform, streamlining team workflows.
- Integrations: Integrates with a range of tools including Google Analytics, AdWords, and Facebook Ads, for comprehensive data gathering.
- Client Portal: Provides clients with a branded portal for accessing reports, dashboards, and other relevant information.
- Automated Reporting: Facilitates regular, automated report delivery to clients, reducing manual effort.
- Budget Management: Enables tracking of clients’ budgets and expenses to maximize ROI.
- White Labeling: Offers customization options for branding reports and client portals to match agency branding.
- Automated Reporting: Includes features for setting schedules and using manageable report templates for automated reporting.
- Marketing Reports Automation: Simplifies the process of creating marketing reports and saves time.
- White-label Reporting: Allows for branding customization in reports.
These features collectively contribute to ReportGarden’s reputation as a comprehensive and efficient solution for digital marketing agencies, enhancing various aspects of client reporting, task management, and data analysis.
ReportGarden is best suited for marketing agencies and digital marketers who require comprehensive reporting tools with a focus on automation and workflow management. Its capabilities in creating detailed and customizable reports make it ideal for professionals who need to manage and present data across various digital marketing channels. The platform’s higher pricing tier suggests it’s more appropriate for established agencies or those with a sizable client base that can benefit from its robust feature set. However, smaller agencies or individuals might find the cost a consideration.
DashThis
DashThis is a reporting tool acclaimed for its clear data visualization and effortless integration with marketing platforms. Its drag-and-drop interface and automated reporting save time, but users desire more flexibility in report management and a wider variety of chart types.
DashThis Advantages in Dashboard and Reporting Software
- Aesthetic Data Display: Clear and visually appealing presentation of data
- Comprehensive Integration: Works with common systems in web design and digital marketing
- Rapid Report Creation: Enables quick creation of charts, graphs, and reports
- Simplified Reporting: Offers a straightforward, scheduled reporting process
- User-Friendly Analytics: The layout is intuitive and easy to navigate
- Helpful Support Team: Known for excellent customer service
- Drag-and-Drop Interface: Simple and efficient interface for users
- Custom Advanced Options: Provides custom options for more detailed reporting
- Seamless Sharing: Facilitates easy sharing of dashboards with clients
Challenges in DashThis’s Reporting Metrics Dashboards
- Archiving Flexibility: The platform’s archiving capabilities could be more user-friendly
- Logo Upload Guidelines: Specific dimensions required for uploading client logos
- Integration Stability: Infrequent integration challenges may occur
- Data Comparison Features: Opportunities to enhance data comparison options in widgets
- Data Synchronization: Occasional need for manual data refresh to ensure up-to-date information
- Chart Options: Selection of chart types is somewhat limited
- Annotation Tools: The annotation editor has potential for improvement in user experience
Key features of DashThis, as highlighted in various reviews, include:
- Beautiful Marketing Reports: DashThis offers pre-built dashboard templates which can be customized to fit specific business needs. These templates facilitate the creation of visually appealing reports quickly and efficiently.
- Custom Dashboards: Users can create custom dashboards tailored to their business goals and needs, with options for different groups per client and various types of dashboards, including rolling and periodic dashboards.
- Customizable Templates: Templates provided by DashThis are easily customizable, allowing for tailored reports that can be reused, saving time and impressing clients with custom branding.
- Unlimited Client and User Accounts: DashThis supports unlimited account users and client accounts, regardless of the chosen plan, enabling easy sharing of reports with teams or clients.
- White Label Options: It provides extensive white-label options for further customization, including branded URLs and dashboard themes.
- Excellent Customer Support: DashThis is known for its high level of customer support, including a help center, unlimited email support, personalized demos, and various guides.
- User-Friendly Interface: The platform is noted for its intuitive interface, ensuring ease of use and quick adoption by marketing teams.
- Extensive Integrations: DashThis integrates with a variety of data sources, enhancing data consolidation and report accuracy.
- Comprehensive Feature Set: The tool includes features like reporting and dashboard creation, data visualization, drag-and-drop interface, automated data import, multi-channel reporting, KPI tracking, campaign performance analysis, and goal tracking.
These features collectively make DashThis a versatile and efficient solution for marketing professionals, simplifying the creation, management, and sharing of marketing reports and dashboards.
DashThis is particularly suited for marketing professionals and agencies seeking a reporting tool that emphasizes clear data visualization and ease of dashboard creation. Its user-friendly interface and automated reporting make it a good choice for those looking to efficiently combine data from various sources into cohesive reports. With its focus on simplification and visual appeal, DashThis is ideal for users who need to quickly generate and share straightforward, aesthetic reports, but it may have limitations for those requiring more in-depth, customizable analytics features.
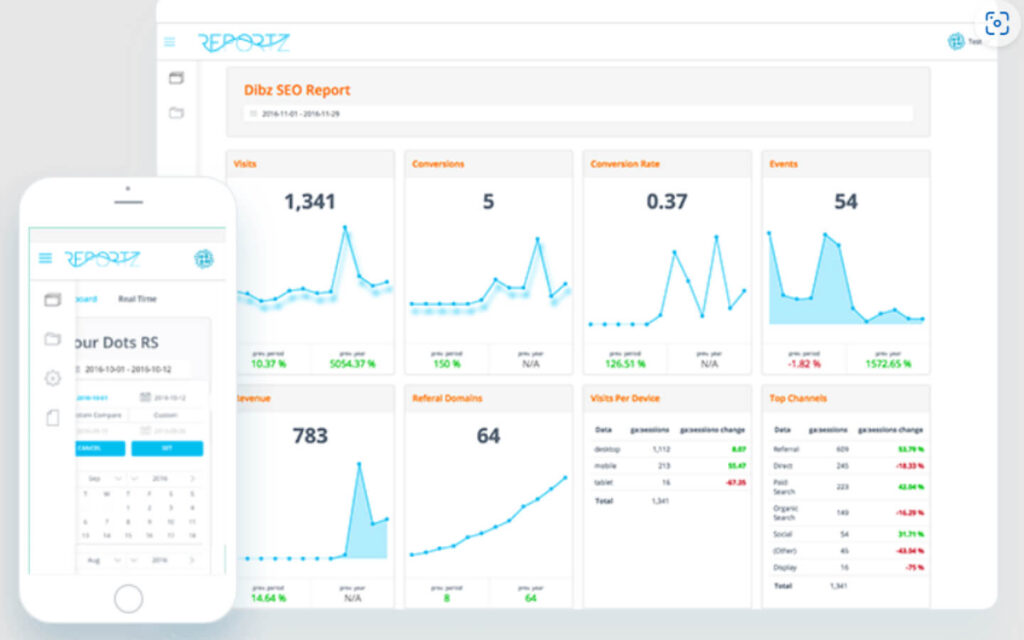
Reportz
Reportz is valued for its ease in creating customizable, automated reports and dashboards, offering efficient client reporting solutions. While praised for its integrations, it faces some user interface and data retrieval challenges.
Reportz’ Strengths in Dashboard Reporting System
- Quick Setup: Users can quickly set up dashboards with custom logos and domains
- Ease of Reporting: Creating reports is straightforward, making it a suitable all-in-one tool for reporting
- Seamless Integrations: Works well with Google, Serpstat, Ahrefs, and Spreadsheets
- Comprehensive Dashboards: Capable of creating extensive reports using various widgets and sources
- Workflow Simplification: It streamlines report sharing and can be white labeled for a professional look
- Automated Reports: Reliable automated reports that are easy to understand
- Real-Time Reporting: Offers live reporting on a unique link with data updating in real-time
- Branding Features: Allows uploading of client-specific colors/logos for a personalized dashboard
Limitations in Reportz’ Dashboard Analysis Report
- Data Retrieval: Retrieving certain information from connected tools may require additional steps
- Technical Support Experience: There have been instances of technical challenges, along with opportunities for enhanced support team responsiveness
- UI Modernization: The user interface is functional with potential for a more contemporary design
- Integration Stability: The Google Spreadsheet integration may sometimes need support for optimal functionality
The key features of Reportz, as highlighted in reviews, include:
- Live Dashboard: Provides real-time data visualization and monitoring capabilities.
- Free White-Label Account & Email Reporting: Offers white-labeling options for accounts and reports, including email reporting features.
- Advanced Filtering: Enables sophisticated data filtering to refine and segment information.
- Advanced Customization: Allows for extensive customization of reports and dashboards.
- Calculated Metrics: Supports the creation and use of custom metrics based on the calculated data.
- Unlimited Users: Permits an unlimited number of users to access the platform.
- Unlimited Data Sources: Allows integration with an unlimited number of data sources for comprehensive data analysis and reporting.
These features collectively make Reportz a versatile tool for businesses and agencies, providing comprehensive data analytics and reporting capabilities.
Reportz is well-suited for marketing agencies and professionals who need a tool for creating comprehensive dashboards and reports with a focus on customization and client management. Its platform is particularly beneficial for those requiring a streamlined, efficient approach to consolidating and presenting various marketing data. The tool’s user-friendly interface and robust reporting capabilities make it ideal for agencies that value ease of use and detailed client reporting. However, it may have limitations in terms of integrations and advanced features, which should be considered based on specific client needs and technical requirements.
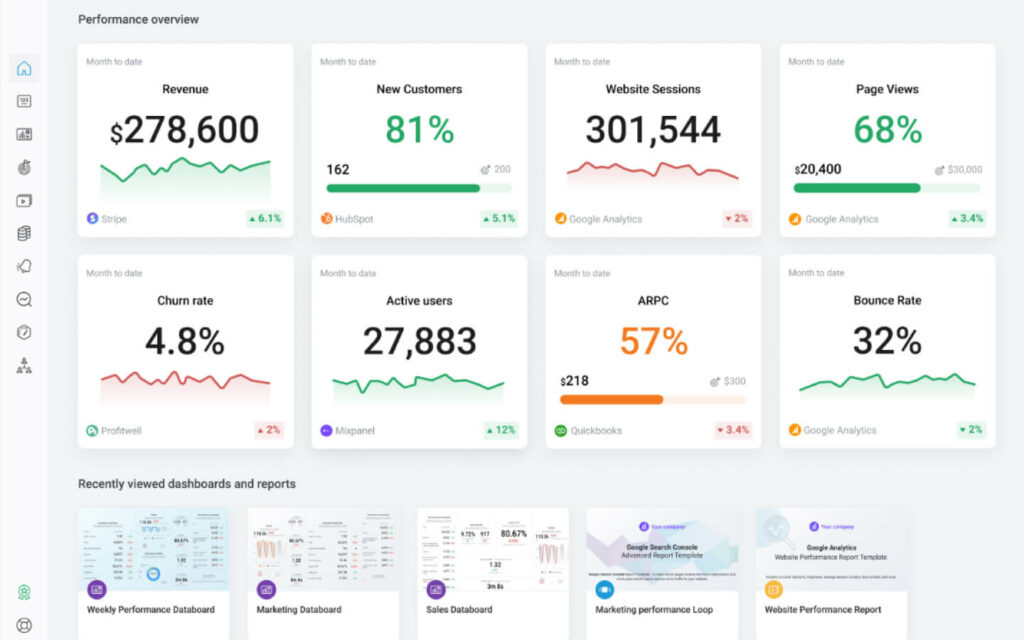
Databox
Databox offers robust dashboard creation and multiple integrations, with strong visual appeal and goal tracking features. However, users seek more integrations and simpler setup, and note limitations in historical data reporting and high costs for advanced branding options.
Strengths in Databox’s Reporting Metrics Dashboards
- Dashboard Creation: Databox is praised for its dashboard creation capabilities
- Integrations: Offers numerous integrations with various data sources
- Visual Presentation: Known for visually appealing dashboards
- Goal Tracking: Allows setting and tracking of goals based on provided data and metrics
- Automatic Data Connection: Connects data sources automatically without complex setup
- Reporting Flexibility: Supports different reporting frequencies like daily, weekly, and monthly
- Custom Dashboard Design: Enables the design and creation of custom dashboards
- Timesaving: Creates real-time measurements, saving time and energy
Challenges in Databox’s Dashboard and Reporting Software
- Additional Integrations Desired: Users suggest expanding direct integrations for less reliance on external services like Zapier
- Historical Data Range: An increase in the range of historical data reporting, currently limited to 1-2 months for some data types, would be beneficial
- Enhancing API Connectors: Expansion of API connectors would improve both existing and new data connections
- Streamlining Report Setup: Users note the potential for simplifying the process of setting up reports and connecting to data sources
- Diversity in Templates: There is a user interest in a broader variety of templates that incorporate multiple data sources
- Broader Digital Marketing Tool Integration: Integration with additional essential digital marketing tools is a suggested improvement
- White Label/Branding Options: Users note that white label and branding features are available but are part of the higher-tier business plan
Based on user reviews from Software Advice, Databox’s key features include:
- Easy Integration: Users appreciate the ease of setting up integrations with platforms like Adwords, Analytics, and Hubspot.
- Customizable Dashboards: The ability to have complete control over key metrics and dashboard customization is highly valued.
- Visual Appeal: Dashboards are visually appealing and make data presentation clear, especially when showing results to clients.
- Automated Reporting: The platform allows for automated snapshots to be sent to communication tools like Slack and email.
- Goal Setting Feature: Users can contextualize their metrics with the goal-setting feature.
- Custom Reports from Multiple Sources: It supports the creation of custom reports using data from various sources, even allowing for the upload of custom spreadsheets.
- Drag-and-Drop Reporting: The drag-and-drop functionality makes it easy to create visualizations.
However, users also noted some limitations, such as a steep learning curve to master the exact metrics, occasional inaccuracies in data integration, and platform stability issues.
Databox is ideal for businesses and marketing professionals seeking a user-friendly platform for data visualization and performance tracking. It’s particularly well-suited for those who need to set and monitor goals based on a variety of data sources. The tool’s strong points in ease of use and custom reporting make it a good choice for teams looking for a straightforward way to track key performance indicators and report results. However, its pricing structure and limited historical data reporting might be considerations for smaller businesses or those with more constrained budgets.
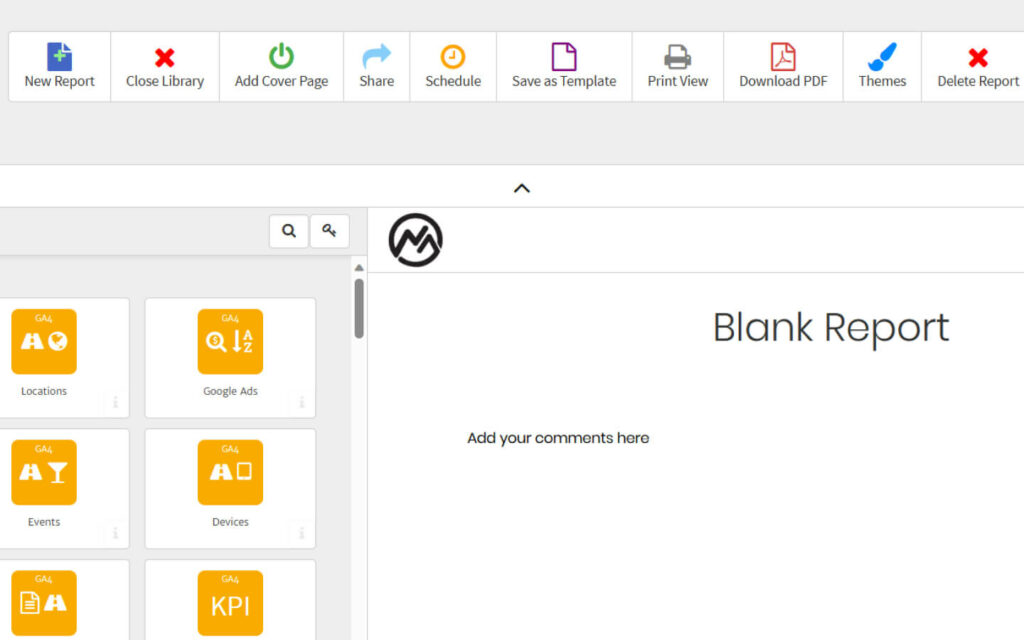
Megalytic
Megalytic is recognized for its user-friendly reporting tools, offering a suite of widgets and excellent customer service. It facilitates easy integration with Google Analytics and efficient report generation, although users note it can be pricey and may lack in-depth customization options and features. It’s particularly appreciated for consolidating data into cohesive reports, despite some minor UX challenges.
Strengths in Megalytic’s Dashboard Reporting System
- Variety of Widgets: Offers a wide range of widgets for customized reporting
- Customer Service: Exceptional customer support with fast response times
- Ease of Use: The platform is user-friendly, making report generation quick and simple
- Google Analytics Integration: Links easily with Google Analytics for automated report sending
- Consolidation of Data: Efficiently consolidates performance data from multiple sources into a single report
Limitations in Megalytic’s Reporting Metrics Dashboards
- Considerations for Cost Efficiency: The pricing structure may warrant consideration, especially for those managing multiple client connections
- Potential for Enhanced Customization: There’s an opportunity to increase flexibility and customization options in report widgets to better meet user needs
- Opportunities for Feature Expansion: Users have suggested a desire for a broader range of features and more frequent updates to enhance the tool’s functionality
- Refining the User Experience: Addressing minor UX concerns in report template builders could further improve overall user satisfaction
Based on reviews, Megalytics is highly appreciated for its comprehensive features and capabilities. Key features include:
- Unlimited Client Dashboards and Users: Offers flexibility in managing multiple clients and user access.
- White Label Hosting: Allows for customized, branded reports without Megalytics references.
- Secure, Password-Protected Access: Ensures data security and controlled access to dashboards.
- Customizable Reports: Offers templates for various purposes like website summaries, Facebook page analysis, and SEO tracking, with the ability to customize reports and schedule or stream them instantly.
- Powerful Widget Library: Facilitates easy data management and presentation with widgets for various metrics like organic traffic, social referrals, and eCommerce.
- Integration with Key Analytics Tools: Seamlessly integrates with Google Analytics, AdWords, Search Console, and Facebook Ads Insights.
- Automated Report Delivery: Supports automated report sending to specific audiences, including scheduling and email tracking capabilities.
These features highlight Megalytics’ capability to streamline analytics reporting, offering insightful, efficient, and visually appealing reports for digital agencies, marketers, and business owners.
Megalytic is best suited for users who need straightforward, effective Google Analytics reporting. It’s particularly fitting for small to medium-sized businesses or marketing professionals seeking a simple yet powerful tool for creating analytics reports. The platform’s focus on user-friendly Google Analytics integration makes it ideal for those who require clear, concise reporting without extensive customization or advanced analytics features. However, for users needing more robust data analysis capabilities or a wide range of integrations, Megalytic may be less suitable.
Supermetrics
Supermetrics streamlines data integration and automation for marketing analytics, with user-friendly features and extensive connectors. It’s particularly efficient for single-user operations but is noted for high costs and performance lags with large data sets.
Supermetrics’ Strengths in Dashboard and Reporting Software
- Automated and Easy: Offers automated updates, query automation, and is user-friendly, particularly for less technical users
- Integration and Connectivity: Boasts a wide range of platform integrations and connectors, with the ability to schedule refreshes
- Data Management: Provides unsampled data, fast processing, and expanded data formatting options
- Templates and Reporting: Includes free templates for dashboards and supports automated reports with triggers
Challenges in Supermetrics’ Reporting Metrics Dashboards
- Optimizing Field Relevance: There’s room for enhancing the correlation between certain fields and ad platforms, along with expanding the range of available fields
- Expanding User Access: Currently tailored for individual use, there’s potential to broaden access for multiple users, enhancing team functionality
- Performance Enhancement for Large Data Sets: There are opportunities to improve the tool’s performance, particularly in processing large data sets more efficiently
- Balancing Cost and Value: The pricing strategy could be reviewed to better align with user expectations and perceived value
- Refining Documentation for Consistency: Enhancing the consistency and clarity of documentation, especially for metric names across different data sources, would improve user experience
According to reviews, Supermetrics is recognized for its comprehensive set of features that enhance data integration and reporting capabilities. The key features include:
- Customizable Dashboard: Supermetrics offers a customizable interface, allowing users to tailor their data presentation according to their needs.
- Data Connectors: It supports a wide range of data connectors, simplifying the integration of data from various sources such as advertising platforms, web analytics tools, and social media platforms.
- Automation and Time-Saving: The tool automates data extraction, transformation, and loading processes, significantly saving time and eliminating manual data extraction and manipulation.
- Robust Reporting Capabilities: Supermetrics provides powerful reporting features with a user-friendly interface. Users can create custom reports and dashboards, combine data from different sources, and visualize data using charts, tables, and graphs. It also offers various templates and pre-built dashboards for quick setup.
- Data Refresh and Scheduling: The tool allows scheduling of data refreshes at specific intervals to ensure that reports are always up-to-date, which is particularly useful for real-time or frequently changing data.
- Flexibility and Customization: Supermetrics offers a high degree of customization, enabling users to apply filters, create calculated metrics, add segments, and create custom dimensions to tailor their analysis to specific needs.
- Cross-Platform Support: It supports integration with many popular platforms like Google Analytics, Google Ads, Facebook Ads, Instagram, LinkedIn Ads, Microsoft Advertising, and more. This feature allows for the consolidation of data from multiple sources, providing a holistic view of marketing performance.
These features highlight Supermetrics’ capabilities in streamlining and enhancing the efficiency of marketing data reporting and analysis.
Supermetrics is particularly suitable for businesses and marketing professionals who require extensive data integration from various sources for in-depth analysis. Its strengths in automated updates, a wide range of connectors, and user-friendly UI make it ideal for users needing to consolidate and analyze large amounts of data efficiently. The platform is well-suited for larger agencies or companies with complex reporting needs and the capacity to invest in a more comprehensive tool. However, its cost and potential performance issues with large datasets might be considerations for smaller businesses or those with more limited data analysis requirements.
Oviond
Oviond is a digital marketing platform known for its ease of use, offering manual client onboarding, built-in dashboard templates, and effective data integration from multiple sources. It stands out for white-labeling capabilities and a clean interface, but users have noted a lack of tutorials and the absence of a mobile app. It is favored for its quick setup and intuitive design, although improvements could be made in providing automatic data sync and more comprehensive ecommerce parameters.
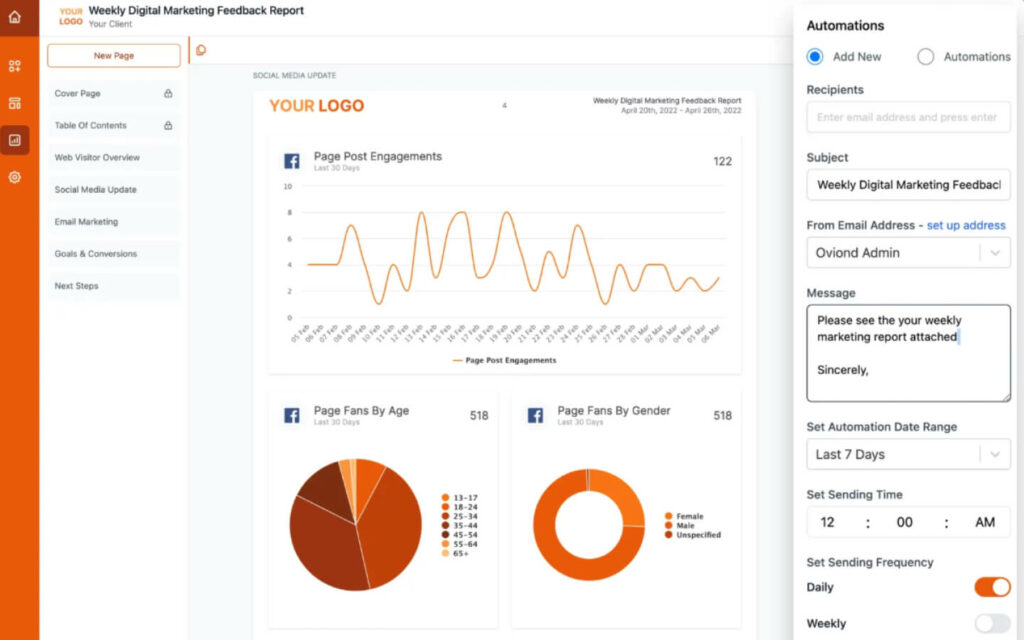
Strengths in Oviond’s Dashboard Reporting System
- Client Management: Allows manual onboarding of clients into folders with custom dashboards for each
- Built-in Templates: Comes with built-in dashboard templates covering various profiles such as Website Traffic, Sales Data, SEO Data, and Ads Data
- White Labeling: Offers white-label features for client previews with branded logos and the ability to connect your own domain/subdomain
- Intuitive and Easy Installation: Oviond is recognized for its intuitive interface and quick setup process, with users able to integrate data from multiple sources swiftly
- Ease of Dashboard Creation: The platform allows for the easy creation of dashboards, streamlining the process of aggregating data
- Comprehensive Data Integration: Oviond can pull data from key sources like Analytics and Social Media, facilitating thorough data analysis and reporting
- Efficient Client Onboarding and Project Classification: Offers efficient manual client onboarding into folders and allows for the classification of different projects with various data sources
- Clean Interface: The platform’s interface is praised for its clean and appealing design, enhancing user experience
Oviond’s Limitations in Reporting Metrics Dashboards
- Opportunity for Enhanced Learning Resources: There’s an opportunity to enrich the user experience with the addition of more comprehensive tutorials
- Adapting to External Platform Changes: The tool is evolving to adapt to recent changes in Facebook’s API, impacting its current utility
- Exploring Mobile Accessibility: The introduction of a mobile app could further enhance convenience and user accessibility
- Refining Widget Functionality: Enhancements in widget refresh capabilities and expanding Google My Business integration options per client could improve user satisfaction
According to reviews, Oviond is celebrated for its range of key features that cater to the needs of digital marketing professionals. These features include:
- Client Management and Integration: Oviond facilitates the management of different clients’ marketing performances in one place. Users can easily onboard clients into folders and create dedicated dashboards for each, enhancing client management efficiency.
- Ease of Use and Setup: The platform is noted for its user-friendly interface and minimalist style, making it easy to use and set up without requiring coding knowledge. This aspect is particularly appreciated in smaller companies and agencies where marketing teams handle reporting.
- Customizable Dashboards and White Labeling: Oviond allows for the creation of custom dashboards, where users can add their own metrics, designs, and colors. It also offers white-labeling features, enabling users to brand their reports with their own logo and company name. This customization extends to blending data from different channels and campaigns.
- Historical Data Analysis: The tool provides historical data analysis, depending on the limitations set by the data source. This feature allows users to measure and analyze data trends over time.
- Security: User reviews indicate that Oviond has not faced significant issues related to data security, suggesting a reliable level of data protection.
- Data Import/Export and Report Sharing: Users can import data from sources like Excel into Oviond and export data in various formats for offline viewing. Report sharing is streamlined with features for sharing via links, PDFs, and automated email sending, ensuring timely delivery of reports.
- Pre-Built Dashboard Templates: Oviond offers pre-built templates for various marketing channels and campaigns, particularly for platforms like Facebook and Google Ads. These templates help users quickly set up and customize dashboards to their specific needs.
- Visually Appealing Data Dashboards: The platform is ideal for creating visually appealing and structurally compelling marketing data dashboards, beneficial for marketing data analysis, KPI delivery, and strategic planning.
These features highlight Oviond’s strength in providing a comprehensive, user-friendly, and secure digital marketing reporting solution.
Oviond is particularly suitable for small to medium-sized digital marketing agencies seeking a user-friendly and comprehensive platform for client management and reporting with the advantage of competitive pricing. It offers efficient setup, intuitive design, and white-labeling features, aligning well with agencies that need to efficiently manage and present diverse marketing data. Despite its affordability, agencies should consider its lack of a mobile app in their decision-making process.
Creating Dashboard Analysis Reports
The creation of dashboard analysis reports is revolutionized by a variety of software tools, each tailored to meet specific needs.
Platforms like Agency Analytics and Swydo offer powerful integrations and customization options, making them suitable for comprehensive data management and personalized reporting. ReportGarden and Databox provide automated reporting and workflow management, ideal for agencies focused on efficiency and time-saving strategies. Meanwhile, tools like DashThis and Supermetrics simplify data integration from various sources, enhancing the ease of report creation. Oviond stands out for its user-friendly interface and client management capabilities.
These tools collectively facilitate a nuanced approach to dashboard analysis, catering to the diverse needs of digital marketing professionals seeking to create insightful, data-driven reports.
All Your Data in One Place
The ability to consolidate various data streams into a single, reliable platform is invaluable. Using a unified tool to aggregate data from diverse sources simplifies the analytical process, offering a cohesive and comprehensive view of marketing performance. This integration not only streamlines workflows but also enhances decision-making by providing clear, consolidated insights. The ease of connecting multiple channels to one platform means less time spent juggling between tools and more time focusing on strategic analysis and planning, making it an efficient solution for marketers seeking to harness the full potential of their data.
Get Started Using 100s of Pre-Built Reporting Metrics and Dashboard Templates
Embarking on data analysis and reporting is made significantly easier with platforms that offer hundreds of pre-built metrics and dashboard templates. Ready-to-use templates accelerate the setup process, allowing users to dive into data analysis without the need for extensive customization. They serve as a starting point for further refinement, tailored to specific business needs.
This approach not only saves time but also provides inspiration and best practices for effective data visualization. It’s ideal for those new to data analytics or businesses looking to quickly implement a data-driven strategy with minimal setup hassle.
Customize the Look and Feel of Your Dashboards
Customizing dashboards is a key feature in modern reporting tools, offering significant benefits. This customization extends to white labeling, where agencies can brand their reports with logos and color schemes, aligning with their or their clients’ branding guidelines. This not only enhances the professional appearance of reports but also instills a sense of trust and brand consistency in client communications. Personalizing dashboards also allows for a tailored user experience, ensuring that the most relevant data is highlighted in an intuitive and visually appealing manner, aiding in clearer understanding and decision-making.
Safe and Secure Data Management
The safe and secure management of data is paramount, especially in the field of marketing analytics. Modern dashboard and reporting tools prioritize robust security measures to protect sensitive data. These include encryption, secure data storage, and compliance with privacy regulations. Such features ensure that data is not only accurately reported but also securely handled, maintaining confidentiality and integrity. This focus on security fosters trust amongst users and clients, who know that their valuable data is managed responsibly and safeguarded against potential breaches. This ensures that these tools are an essential asset in any data-driven marketing strategy.
Data Sources and Plugins
The integration of various data sources and plugins is a cornerstone of modern marketing analytics tools. These integrations enable the aggregation of data from multiple channels like social media, SEO, PPC, and CRM systems into a unified platform. This holistic approach provides a more comprehensive view of marketing efforts and consumer behavior. The use of plugins further enhances this capability, allowing for customization and extended functionality. Such integrations not only streamline data analysis and reporting processes but also offer deeper insights, aiding businesses in making informed, data-driven decisions for their marketing strategies.
Linking multiple data sources to one platform amplifies these benefits, as it simplifies the monitoring and analysis of diverse marketing channels in one place. This centralization enhances efficiency, reducing the time and effort spent on data compilation and analysis. Automated reporting from these integrated platforms further streamlines the process, allowing businesses to generate client reports effortlessly and regularly. This automation ensures that clients receive timely, data-rich reports, providing them with a clear, ongoing understanding of campaign performance and ROI.
Conclusion
In conclusion, the exploration of dashboard and reporting software in this guide highlights a crucial truth in the realm of digital marketing: while different tools may cater to specific needs, the fundamental necessity of such software is undeniable for the growth and efficiency of marketing agencies.
Each tool discussed, from Agency Analytics to Oviond, demonstrates unique strengths, whether it’s in seamless data integration, user-friendly interfaces, or robust customization. This diversity in functionality means there’s a tool for every need and preference, ensuring that every marketing agency can find a solution that aligns with its specific requirements.
However, the common thread binding all these tools is their essential role in consolidating and clarifying data. This ability to transform raw data into actionable insights is not just a convenience; it’s a game-changer in a world increasingly driven by data-informed decisions. Agencies equipped with these tools can offer their clients not just data, but insights and strategies that are both timely and informed by a comprehensive understanding of various metrics.
The use of dashboard and reporting software thus becomes a hallmark of a forward-thinking, efficient, and competitive agency. It’s an investment in clarity, efficiency, and strategic foresight. Whether your focus is on detailed SEO analysis, social media metrics, or comprehensive campaign overviews, the right dashboard and reporting tool will not just meet your needs, it will elevate your agency’s analytical capabilities to new heights.
In embracing these tools, agencies are not just keeping pace with the digital marketing landscape; they’re leveraging its full potential for growth, client satisfaction, and sustained success. The transformative power of these tools is clear: they are not just about managing data, but about unlocking the stories and strategies that lie within, propelling your agency towards a future where data-driven decision making is the cornerstone of success.
Frequently Asked Questions on Dashboard and Reporting Software
Who will benefit from this software?
Dashboard and reporting software is ideal for digital marketing agencies, marketers, and business owners who need to consolidate, analyze, and report on data from multiple digital platforms. It’s designed for those seeking to streamline their marketing analytics and reporting processes, enhancing efficiency and insight.
How secure are the data and insights stored within dashboard software tools?
Dashboard and reporting software ensures the security of data and insights with advanced measures like encryption, secure servers, and strict access controls, adhering to data protection regulations for safety and privacy.
What are the benefits of using dashboard reporting software?
Using dashboard reporting software offers key benefits: it streamlines data analysis and reporting, provides real-time insights, enhances decision-making with comprehensive data views, and saves time through automation and integration of multiple data sources. It also improves data visualization, making complex data easily understandable.
Why is dashboard and reporting software essential for marketing agencies?
It’s essential for consolidating diverse data, streamlining decision-making, and providing clear, actionable insights to enhance marketing strategies and client reporting.
Can dashboard and reporting tools handle real-time data processing?
Yes, many of these tools are designed to process and display data in real-time, allowing for timely decision-making based on up-to-the-minute insights.
Is customization a significant feature of dashboard reporting tools?
Yes, customization is a critical feature, allowing users to tailor dashboards and reports to meet specific business needs and preferences.
Can these dashboard tools integrate with various data sources?
Yes, most dashboard and reporting tools are designed to seamlessly integrate with a range of data sources for comprehensive analysis.
Are these dashboard tools suitable for small businesses?
Many of these tools are scalable and can be suitable for small businesses, offering various pricing plans and customization to fit different needs.
Can these tools be used for real-time reporting?
Yes, many of these tools offer real-time reporting capabilities, providing live updates and insights into data.
Do these software solutions offer automated reporting?
Yes, automated reporting is a common feature, allowing for the scheduling and automatic generation of reports.
How user-friendly are these dashboard tools for non-technical users?
Many tools are designed with user-friendly interfaces and intuitive navigation, making them accessible for non-technical users.
Are there customization options for reporting and dashboards?
Yes, most tools offer extensive customization options for dashboards and reports to meet specific business or client needs.
What types of businesses can benefit from using dashboard and reporting software?
Any business that relies on data for decision-making, especially marketing agencies, e-commerce platforms, and small to large enterprises, can benefit from these tools.
Can these tools help in decision-making processes?
Absolutely, by providing clear, actionable insights from complex data sets, these tools aid significantly in informed decision-making.
Do these tools offer collaboration features?
Many of these tools include features for sharing and collaborating on reports and dashboards within teams or with clients.
Is it possible to track marketing ROI using these tools?
Yes, these tools can track various metrics and KPIs, making it easier to calculate and present marketing ROI to clients.
Can these tools handle large amounts of data?
Most of these tools are built to handle large data sets, offering scalability as business needs grow.
Do these tools provide support and training for users?
Yes, many offer comprehensive customer support and resources for learning to help users maximize their use of the tool.
Are there visual elements like graphs and charts in these tools?
Yes, visual elements such as graphs, charts, and color-coding are integral parts of these tools for easier data comprehension.
How do these tools aid in client communication for agencies?
By creating clear, concise, and visually appealing reports, these tools enhance the professionalism and effectiveness of client communication.
Are there any cost-effective options among these tools for smaller agencies?
Yes, many tools offer a range of pricing options, including some cost-effective choices suitable for smaller agencies or businesses with limited budgets.
