When compiling marketing reports, you’ll soon discover the need for a proficient reporting system for your clients, one that combines data from various sources. Many turn to familiar spreadsheet tools such as Google Sheets or Excel. These tools are not only part of your everyday workflow, but they also offer familiarity and, in the case of Google Sheets, the added benefit of being free. This approach is a common and intuitive first step in managing and presenting complex marketing data efficiently.
Table of Contents
What Is a Marketing Dashboard?
At its core, a marketing dashboard is a powerful tool that consolidates key marketing metrics and data points into a single, comprehensive visual interface. For many, Excel is the go-to software for creating these dashboards, offering a familiar and flexible environment to craft detailed marketing reports. By leveraging Excel, you can transform rows of data into actionable insights, presenting complex information in an easily digestible format.
“With a dashboard dialed in for your e-commerce operation, you’ll stay effortlessly on top of customer behavior and your marketing performance.”
Free Marketing Dashboard Templates and Examples
Whether you’re just starting out in digital marketing or have been at it for years, having the right tools can make all the difference. This is where free marketing dashboard templates come in really handy! Available from a variety of helpful platforms, these templates give you a ready-made blueprint for easily tracking and making sense of your marketing data.
For Excel lovers (you know who you are!), Excel marketing dashboard templates can be great. The format is comfortable and familiar, while still letting you customize things and dig into the details to analyze that data every which way. So, if spreadsheets are your happy place, these templates will allow you to geek out on your marketing analytics to your heart’s content!
Whether you’re looking at a comprehensive digital marketing KPI template in Excel or exploring various excel marketing dashboard examples, these free resources from Smartsheet are a boon for marketers seeking to make data-driven decisions without the overhead of costly software.
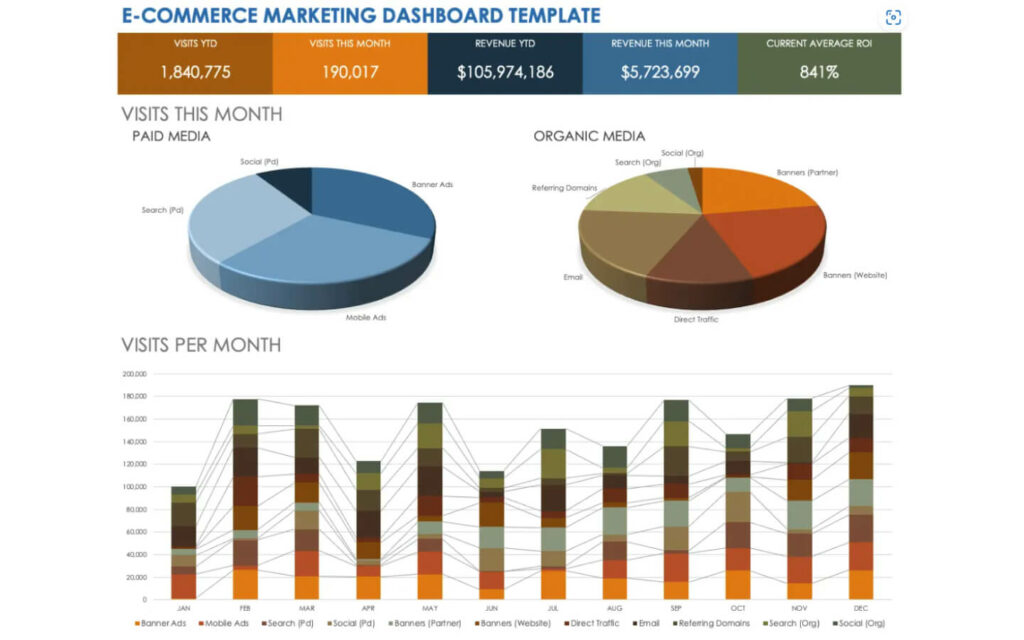
E-Commerce Marketing Dashboard Template
Running an e-commerce business these days keeps you on your toes! Having the right intel can make a huge difference in staying ahead. That’s why having a customized E-Commerce Marketing Dashboard Template tailored to your online store can be a total game changer.
This type of dashboard gives you an at-a-glance view of those vital e-commerce key performance indicators (KPIs) you need to keep an eye on. We’re talking essentials like website traffic sources, conversion rates, average order value, customer acquisition costs, and sales broken down by product or category.
The best part is, you can build this fully customizable dashboard in Excel. So you get the flexibility to tweak it to match your business needs exactly – no matter what size you are or what you sell. This way, you can easily track those KPI trends, see what’s working marketing-wise, figure out what to double down on inventory and promotion-wise, and keep making informed calls to fuel your growth.
With a dashboard dialed in for your e-commerce operation, you’ll stay effortlessly on top of customer behavior and your marketing performance. And that means you can keep guiding your business where you want it to go.
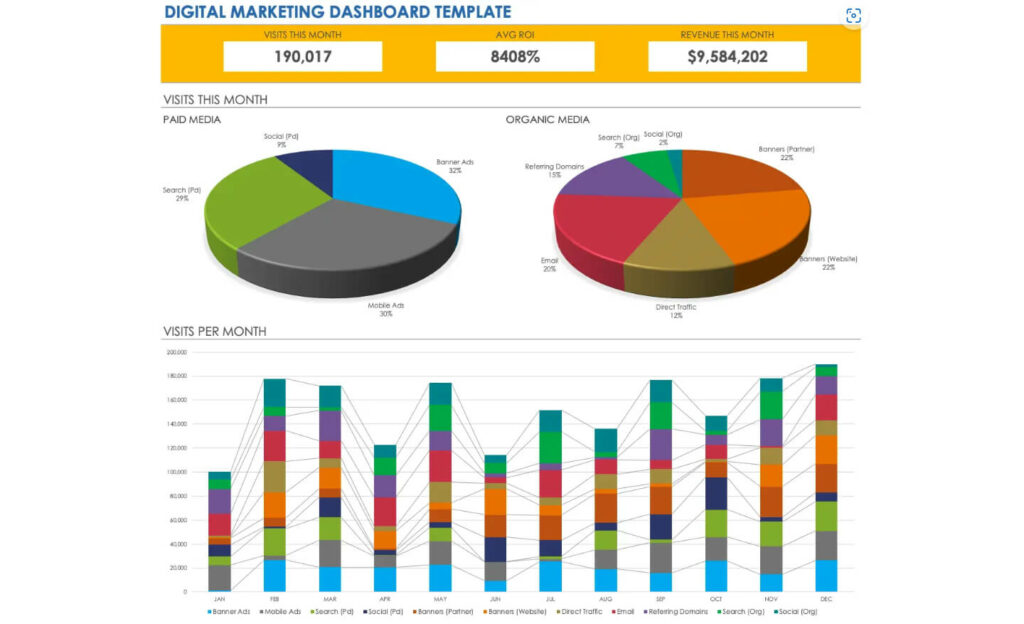
Digital Marketing Dashboard Template
Keeping tabs on all your digital marketing campaigns got you feeling overwhelmed? An Excel Digital Marketing Dashboard Template can make it way simpler. This handy customizable template lets you bring in the key stats from all those channels – social engagement, email performance, SEO, PPC, the works!
Having all those vital metrics in one place makes it a breeze to see how your campaigns are stacking up against your goals. You can tweak the template to spotlight the KPIs most crucial for each campaign. And with everything centralized, identifying trends and knowing what to fine tune is easy breezy.
So don’t let the headache of tracking all of your digital marketing efforts hold you back anymore! An Excel template tailored to your campaigns’ needs will simplify analyzing the data that matters most. That way, you can optimize the performance of all your digital marketing all in one view. Hello, better results with way less effort required. You got this!
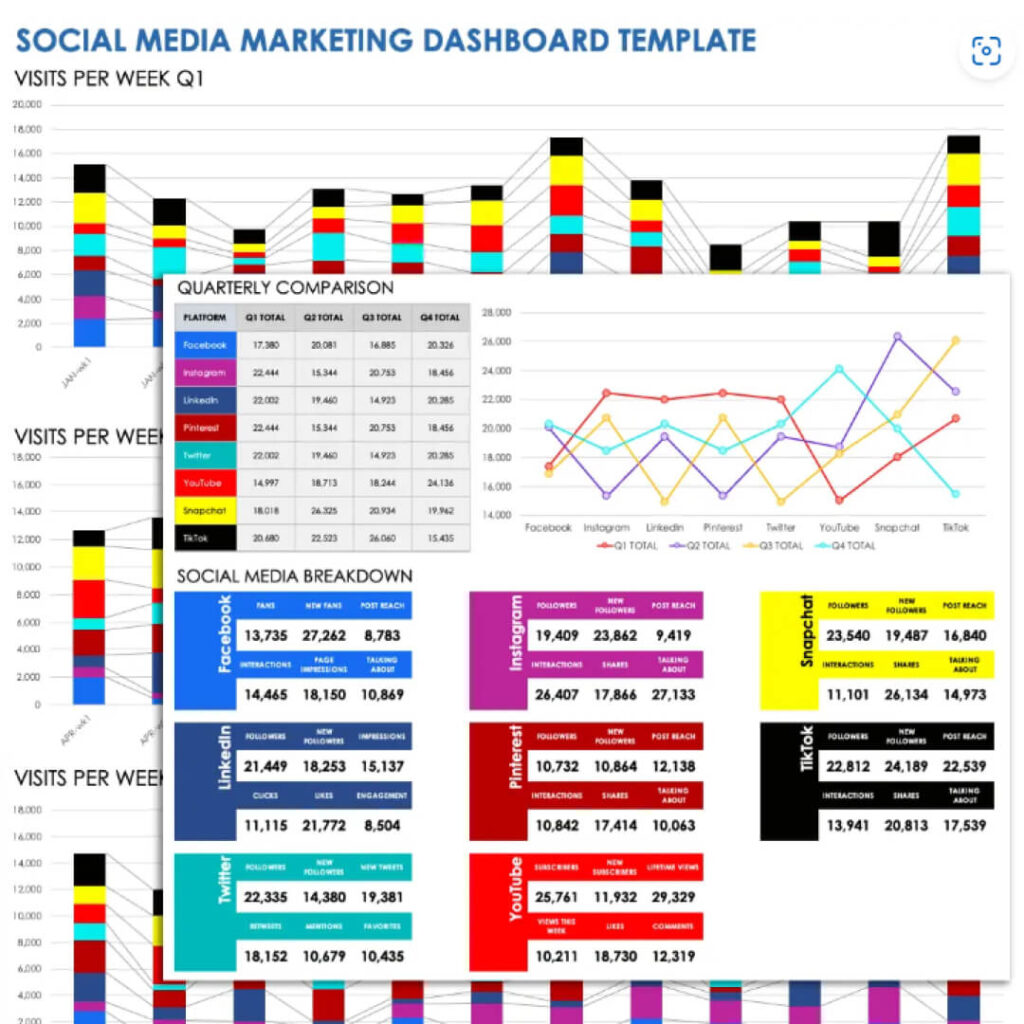
Social Media Marketing Dashboard Template
Juggling multiple social media channels for your marketing campaigns? It can get seriously chaotic trying to keep tabs on how all those posts, tweets, videos, etc. are performing. Talk about social media overload!
Luckily, a Social Media Marketing Dashboard Template helps make sense of it all in one place. These mega-useful templates let you easily track those all-important performance metrics from your different platforms – Facebook, Instagram, Twitter, YouTube, you name it!
As our friends at Smartsheet point out, having everything centralized in one dashboard creates the perfect bird’s eye view of what content is landing best with your audience. So you can see at a glance where your efforts are getting traction and double down on those channels and tactics working well.
No more flying blind across all your social platforms! A tailored Social Media Dashboard in Excel brings key data together to guide decisions and give your marketing strategy just the boost it needs. Time to get strategic with your social media game 😎 What metrics matter most to you?
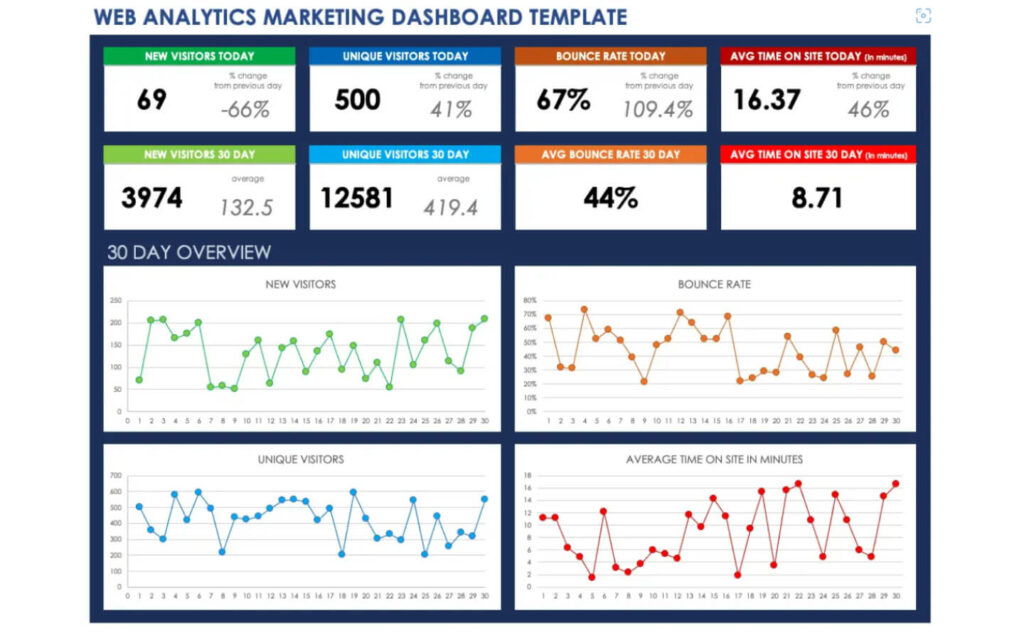
Web Analytics Marketing Dashboard Template
Whether you’re a webmaster, e-commerce manager or digital marketer, a Web Analytics Dashboard is essential for gauging website performance. Smartsheet’s handy template emphasizes key metrics like daily/monthly visitors, bounce rates and time spent on site. It also tracks percent change day-to-day and plots data over 30 days in easy-to-read charts. This at-a-glance view lets you monitor site health and catch any fluctuations in performance fast. With your vital website stats all in one organized dashboard, you’ll stay on top of things without having to crunch analytics numbers yourself.
Microsoft Excel | Google Sheet
Email Marketing Dashboard Template
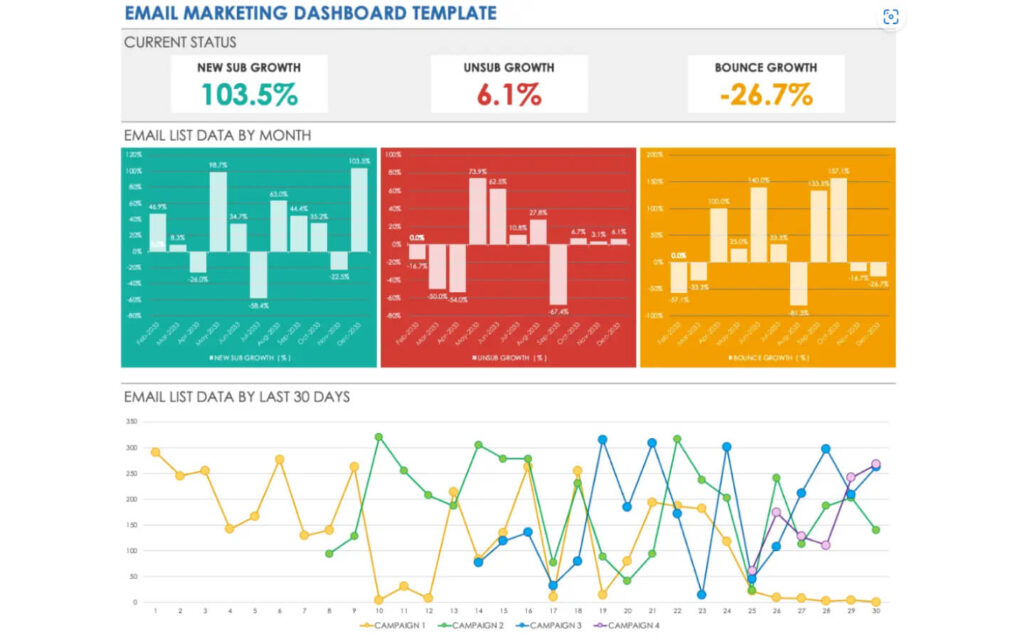
Keeping up with email marketing campaigns can be a major undertaking! Smartsheet’s handy Email Marketing Dashboard Template helps you stay on top of it with ease. This vital tool neatly tracks all those key stats each month like new signups, unsubscribes, bounce rates and more. You’ll get a bird’s eye view of subscriber growth rates too with easy-to-scan charts. Whether you’re a startup or enterprise marketer, this template has you covered for gaining insight fast into what’s working and what needs tweaking. Say bye to email chaos and hello to visualizing success!
Marketing Campaign Dashboard Template
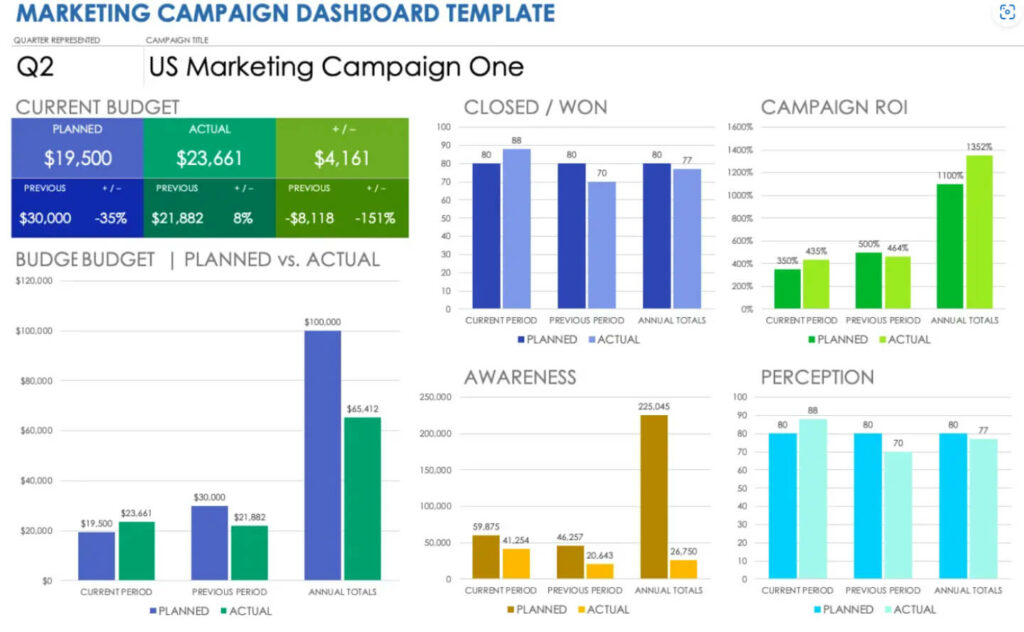
Keeping tabs on all your marketing campaigns? It can quickly turn into a hot mess trying to measure success and ROI across the board. Smartsheet’s got your back with their awesome Marketing Campaign Dashboard Template!
This mega handy template breaks things down to show campaign spending vs. returns, how you’re moving the needle on consumer awareness and perception, and how your pipeline and closed deals stack up to goals. No more flying blind!
It lays everything out clearly in year-to-date totals, side-by-side with previous time periods too. So at a glance, you can gauge what’s going right, what needs fine tuning, and ensure your marketing efforts stay locked in on target.
Whatever your campaign objectives, this template makes tracking and optimizing performance simple. Say bye to messy campaign metrics and hello to understanding what moves the needle! Then use those insights to take your marketing right where you want it to go.
Marketing KPI Dashboard Template
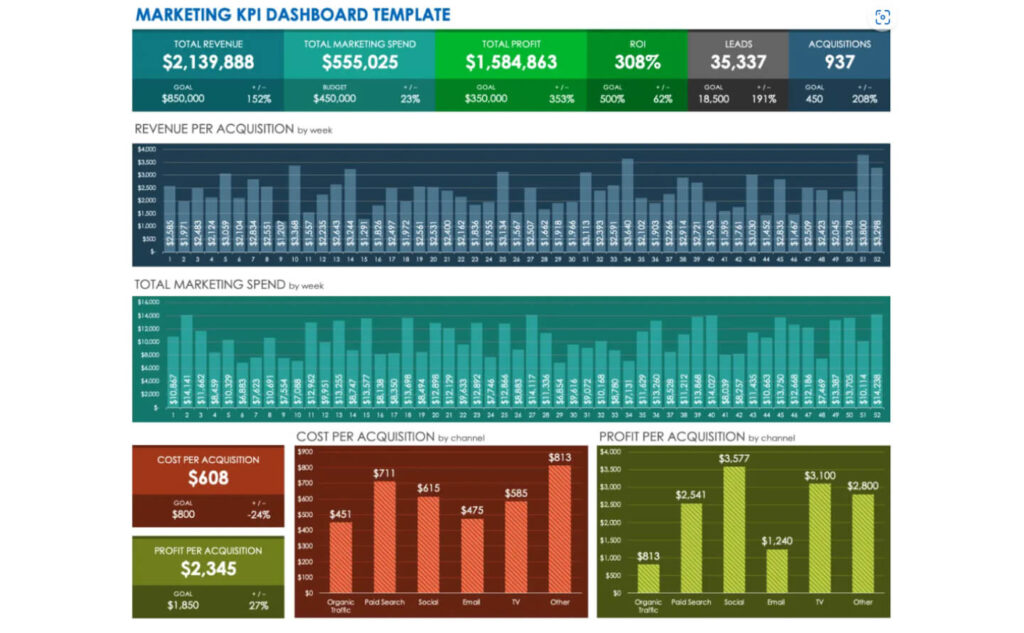
Want the inside scoop on how all your marketing efforts are stacking up? A handy Marketing KPI Dashboard Template makes it super simple to keep tabs on performance. Consider it your trusty sidekick for tracking key activities against your goals!
These visual dashboards allow you to easily compare your actual progress to the milestones you’ve set across different periods – daily, monthly or annually. So you can spot variances and trends across projects, products, services, sales and more in no time!
The templates showcase the intel in clear, easy to digest charts like bar graphs, pie charts and histograms. So at a quick glance you can see what KPIs are crushing it, and which ones need a boost. Way better than cluttered spreadsheets, am I right? 😅
Bottom line, this customizable template has got you covered for simplifying all your performance tracking needs. Say bye to marketing metrics confusion and hello to knowing exactly where things stand! Then use those insights to keep your strategic plans right on track. What KPIs matter most for your marketing success?
Marketing Dashboard PowerPoint Template
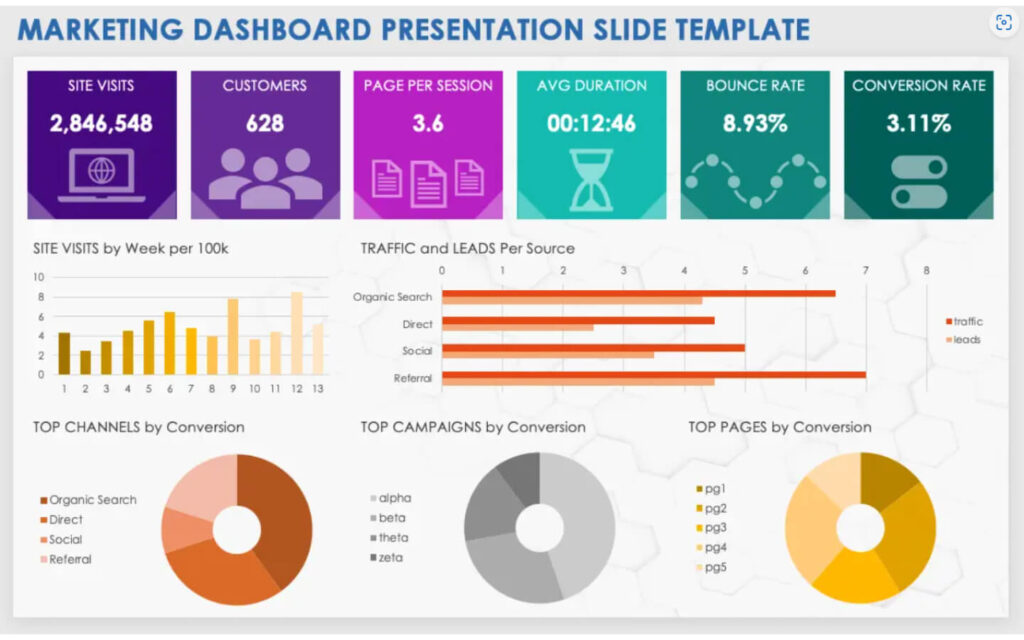
Wow the bosses by plugging these templates into PowerPoint or Google Slides. They’ll visually track monthly growth in visits, leads and customers, plus conversion rates and channel performance. With data presented clearly, your presentations will showcase impressive marketing insights.
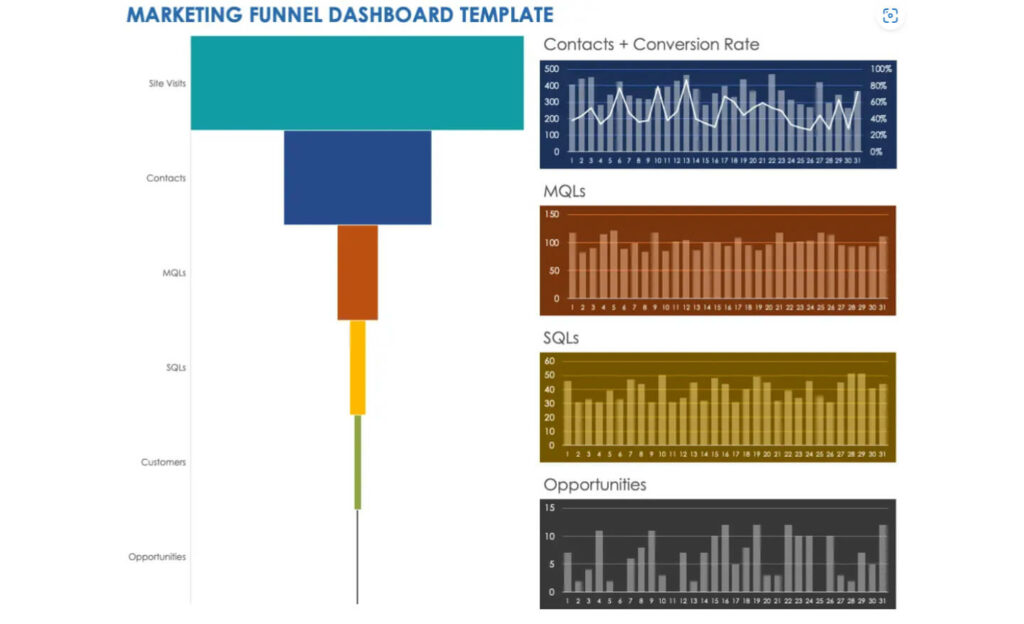
Marketing Funnel Dashboard Template
Tracking leads through your marketing funnel getting chaotic? The Marketing Funnel Dashboard Template makes it simple to see pipeline health from start to finish!
This mega-helpful tool gives you an at-a-glance view from initial website sessions all the way down the funnel to those precious marketing qualified leads (MQLs). No more guessing how well your funnel is converting!
Whether you’re a marketer, agency owner or what have you, this template lets you easily monitor funnel effectiveness. Spot any stick points causing bottlenecks and see what stage needs fine tuning.
Simplify how you track and analyze performance across your pipeline. This customizable template organizes all those vital metrics in one spot so you can optimize conversions.
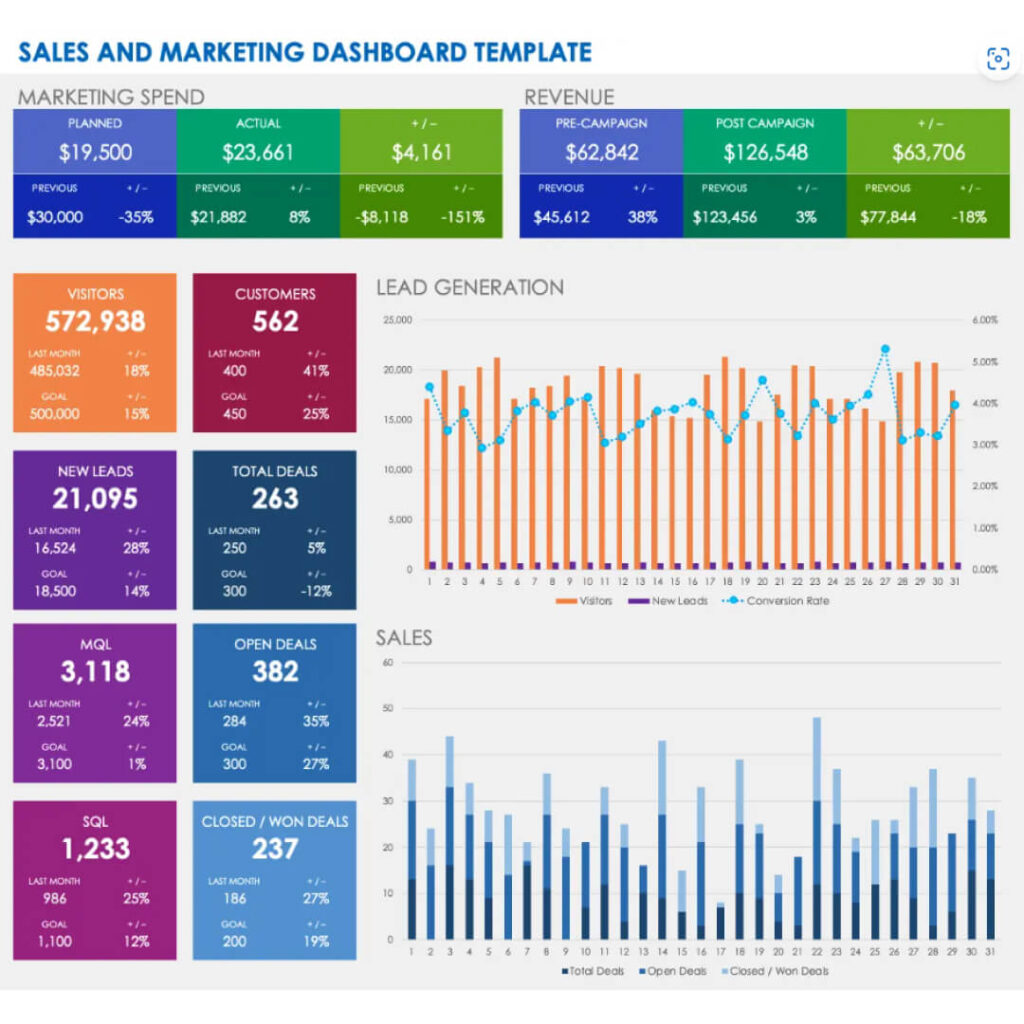
Sales and Marketing Dashboard Template
Managing a sales team? It can be tricky to keep tabs on all those performance metrics across team members, products, regions – you name it. But having the right intel makes all the difference! That’s where Smartsheet’s Sales Management Dashboard Template comes in super handy.
This must-have tool neatly consolidates key data points into one easy-to-access dashboard. So at a glance, you get valuable insights into what’s working and where there’s room for improvement. Track metrics by individual to pinpoint who needs support. Compare product and regional numbers to spot specific growth opportunities.
With an organized 360 view of your team’s performance, you can have informed conversations, ensure accountability, and make data-backed decisions to optimize. No more flying blind! Say bye to cluttered spreadsheets and hello to sales clarity. Where do you want to boost results? This customizable template will help you get granular so you can crush your team’s true potential.
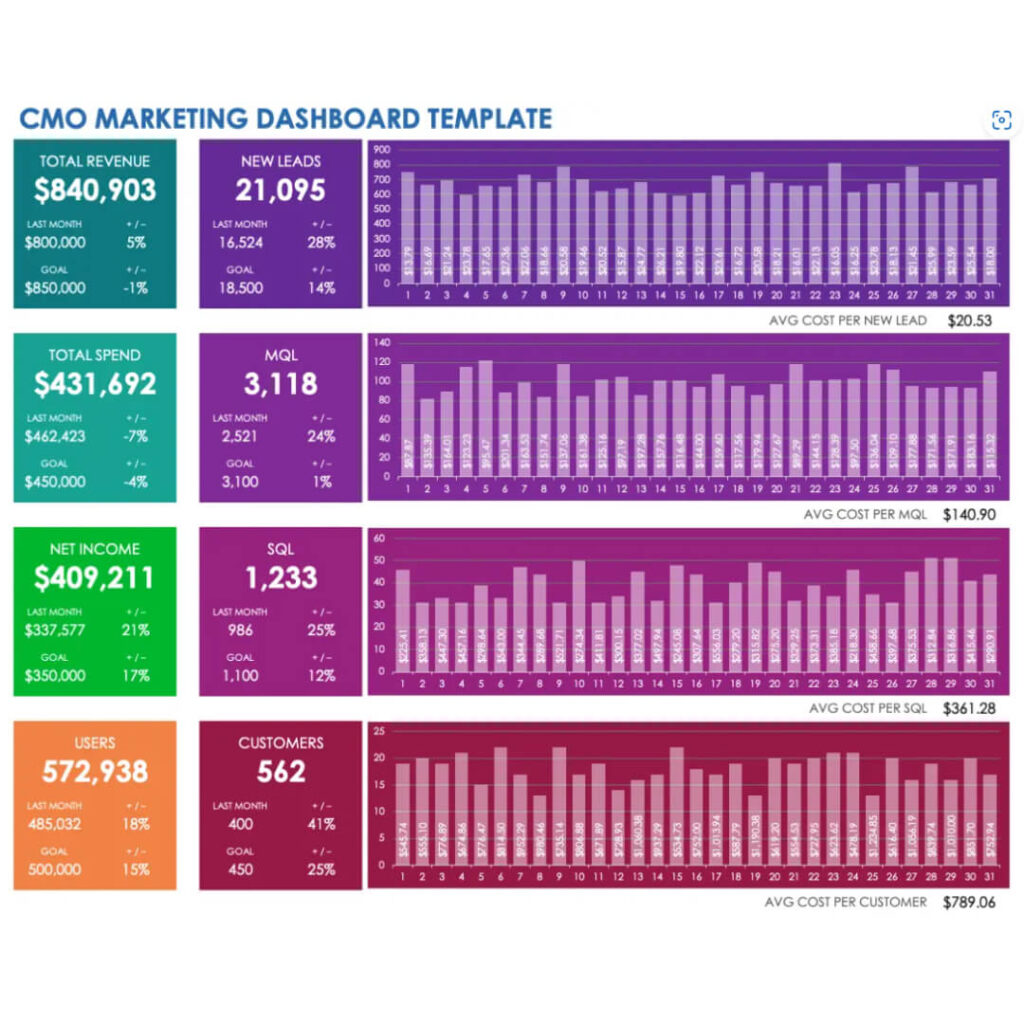
CMO Marketing Dashboard Template
As a top-level CMO, you’ve got a ton of crucial marketing metrics to keep an eye on. Juggling all that data is no joke! But having the right insights can be a total gamechanger for performance.
That’s where this tailored CMO Marketing Dashboard Template comes in super handy! It automatically calculates those vital totals – revenue, costs, net income. So you get an accurate overhead view of exactly where marketing stands.
The template drills down too into customer costs and value metrics. So you can easily analyze what efforts are working and what needs tweaking to boost results.
With data seamlessly consolidated into key performance snapshots, you’ll be able to back major decisions with solid intel. No more spreadsheets headaches! This dashboard simplifies tracking and serves up those must-know marketing insights you need to strategize like a boss. Now you can confidently steer performance right where you want it to go.
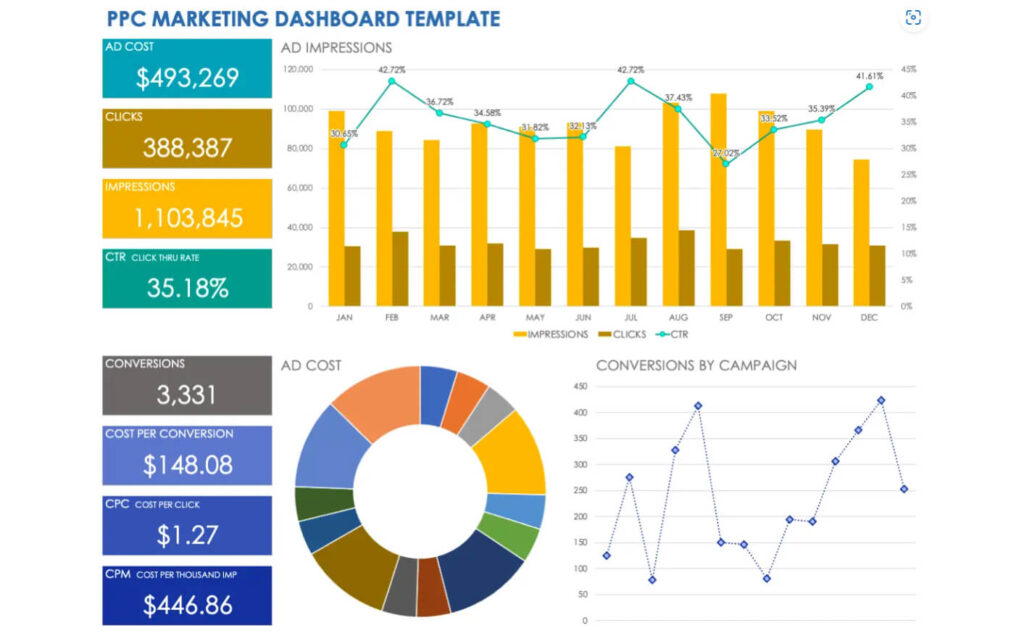
PPC Marketing Dashboard Template
The PPC Marketing Dashboard Template is meticulously tailored for managing Google Ads campaigns and versatile for other PPC platforms like Bing, Facebook and more. This robust framework is invaluable for marketers aiming to refine strategies, offering a clear view of campaign performance metrics and areas needing improvement. With data consolidated, it facilitates optimizing budgets, tracking conversions, and boosting results across networks.
Marketing Leads Dashboard Template
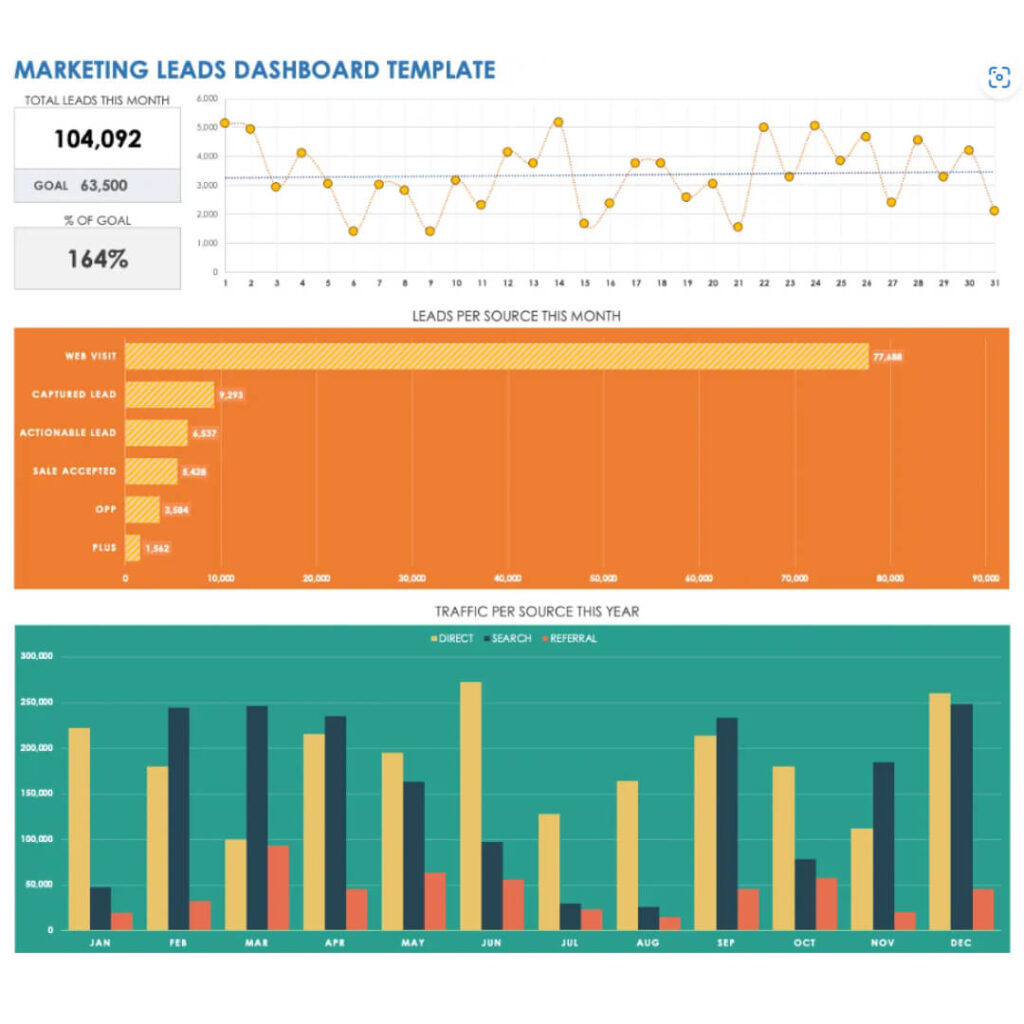
Managing complex marketing lead flows? No doubt it gets chaotic monitoring all those website visits, new leads, and pipeline progress. But keeping close tabs on generation metrics can be a game changer. That’s why this handy Marketing Leads Dashboard Template rules!
At a glance, you’ll be able to compare monthly lead totals to your key goals and dig into daily new lead generation rates. And it maps out your full pipeline – from initial web sessions to hot prospect hand-offs – for understanding exactly where things slow down. With those clear insights in place, you’ll be able to systematically optimize your strategy.
The template also displays how much referral vs direct vs organic traffic contributes and calculates proximity to lead targets. So you can easily spot generation gaps, adjust channel efforts accordingly, and ensure you’re on track to hit your goals. Woohoo for less legwork and way more lead gen clarity!
These are great, but how can I scale my marketing reporting?
Excel dashboards are super helpful for assembling those core marketing reports. But I feel you – when your digital marketing game is getting bigger, reporting needs to evolve too.
Lucky for us, next-level dashboard software has arrived to take data visualization up a serious notch! These digital rockstar platforms blast way beyond Excel’s classic metrics into the intricate world of online performance tracking. We’re talking decrypting campaign effectiveness across channels, monitoring customer engagement blow-by-blow, and so much more good stuff.
So if you’re ready to unlock a truly 360-degree view of your digital marketing universe – with snazzy visualizations to match – it’s time to play around with these advanced tools! They provide ultra-tailored tracking for every modern digital goal. Plus, with more metrics at your fingertips, you gain valuable insights for guiding strategy.
Making the leap from general to specialized can seem overwhelming. But just imagine the game-changing perspective you’ll gain on content performance, lead gen, and channel decisions! This is your springboard to the next level of digital marketing greatness. 🚀 Give one of those sleek customizable dashboards a test run and watch your reporting transform before your eyes.
“Say bye to Excel chaos and hello to unlocking your agency’s true potential. You’ve got this!“
Why Change to a Digital Marketing Dashboard?
As your agency grows and you juggle more client reporting needs, copying data between Facebook, Google Analytics, YouTube and more into Excel/Sheets can get seriously tedious. Not to mention eating up tons of time you could spend actually optimizing campaigns and supporting clients!
When your client base scales up, manual reporting just doesn’t cut it anymore. The copy-paste grind burns you out quick. And clients feel frustrated waiting on slow, basic reports rather than getting value from your strategic insights.
The good news is, it’s not you, it’s your tools! Upgrading to automated reporting through a digital marketing dashboard is a total game changer. You’ll ditch the busywork and open up way more time for high-impact analysis and client focus. We’re talking streamlined, efficient reporting fueling productivity and satisfaction all around.
So don’t settle for makeshift legacy tools dragging you down. Embrace the modern magic of marketing automation! Say bye to Excel chaos and hello to unlocking your agency’s true potential. You’ve got this! 🙌
One-Stop Marketing Data Repository
Centralizing core marketing data in a single location is a game-changer for agencies. It streamlines the process of accessing and analyzing crucial data, from customer behavior to campaign metrics. This consolidation not only enhances efficiency but also enables more accurate and comprehensive insights. It facilitates easier collaboration among team members, ensures data consistency, and speeds up decision-making. By having all key marketing data in one place, agencies can more effectively track performance, identify trends, and tailor their strategies to meet client needs and market dynamics.
Cutting Human Error with Instantaneous Data Updates
Integrating real-time data updates significantly reduces the risks associated with human error in marketing analytics. This approach ensures that the latest information is always at hand, enabling agencies to make decisions based on the most current data. It eliminates the need for manual data entry, which is often prone to mistakes, and ensures higher accuracy and reliability in reporting. Real-time updates provide a dynamic view of marketing performance, allowing for immediate adjustments and more informed strategy development, thereby enhancing the overall effectiveness of marketing efforts.
Full Visibility Across the Marketing Funnel
Enhancing transparency throughout the marketing funnel brings numerous benefits. It allows for clear visibility at each stage, from initial customer awareness to final conversion. This increased openness aids in identifying bottlenecks and inefficiencies, fostering an environment of trust and accountability. For clients, it means a deeper understanding of how their campaigns are performing and where their investments are going. For agencies, it leads to better communication, more informed decision-making, and the ability to adjust strategies proactively. Overall, this level of transparency is crucial for optimizing marketing effectiveness and building strong, trust-based client relationships.
Consistent Measurement Across Marketing Platforms
Adopting a standardized view for all marketing metrics significantly streamlines the analysis and reporting process. This uniform approach ensures that every metric, whether it’s related to social media engagement, website traffic, or conversion rates, is measured and presented in a consistent manner. It not only simplifies the interpretation of data across various marketing channels but also facilitates easier comparison and benchmarking. For agencies, this means being able to offer clients clear, comprehensible insights, while also maintaining efficiency in their internal data management and strategy evaluation processes.
How do I Migrate from Excel Marketing Dashboards to Digital Marketing Software?
Adapting to a new workflow, especially when moving away from familiar processes, can be challenging and daunting. However, the transition to a more advanced reporting tool is made seamless with reliable options available. These tools are designed to ensure an easy switch, offering both power and simplicity, and alleviating any concerns about leaving your comfort zone in workflow management.
Let’s Get Going: Where to Start
- Sign up for a free trial: Access a platform’s features to fully understand the potential of a paid plan through their free trial.
- Integrate your data: Connect your data sources effortlessly, typically in under a minute.
- Choose a template: Most platforms have a wide array of pre-built Dashboard and Report templates to choose from, or you can start from scratch.
- Share with others: Share your comprehensive Dashboards and Reports with clients or colleagues via URL, email, or as a PDF.
Great Digital Marketing Platforms to Try
Oviond
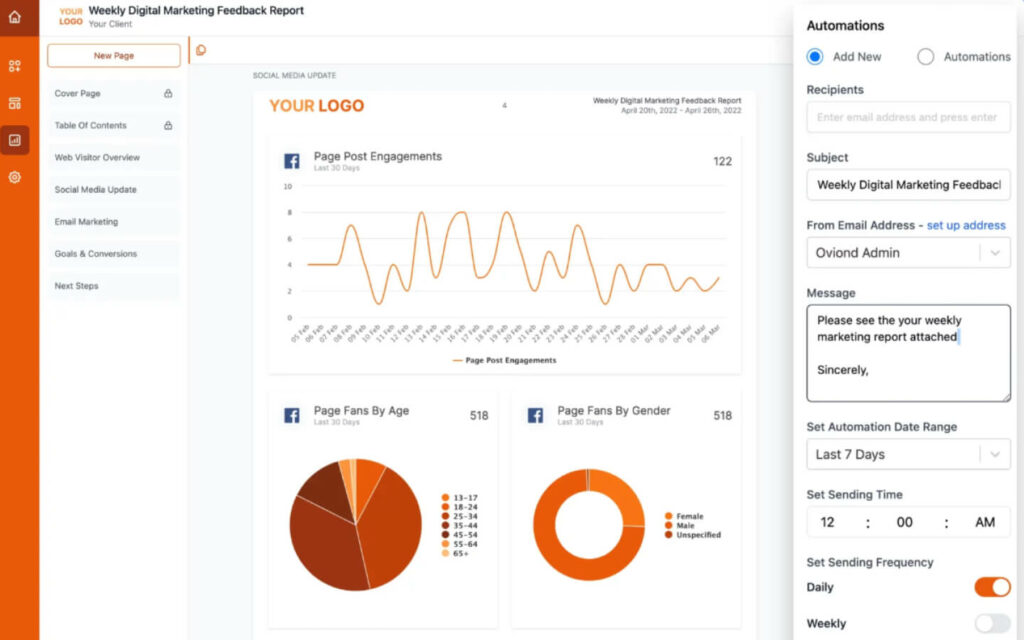
Oviond is a digital marketing reporting platform designed to simplify and streamline the process of handling data across multiple platforms. It addresses the common challenge of managing diverse data sources by offering a solution that makes reporting as easy as a few clicks. Oviond stands out with its integration capabilities, supporting over 50 different platforms. It also offers customizable templates and automation features, aiming to not just be a tool but a partner in success for its users. The platform is tailored to serve a range of clients, from small businesses to large marketing agencies, with the goal of improving efficiency, enhancing client satisfaction, and enriching the professional image of its users.
Positives of Oviond
- Ease of Use: Users find Oviond straightforward to navigate.
- Simple Interface: The platform boasts a user-friendly interface.
- Minimalist Report Design: The design of the reports is clean and minimalistic.
- White-label and Custom Reports: Offers the ability to personalize and brand reports.
- Responsive Customer Support: The support team is noted for being helpful and keeping users updated.
Swydo
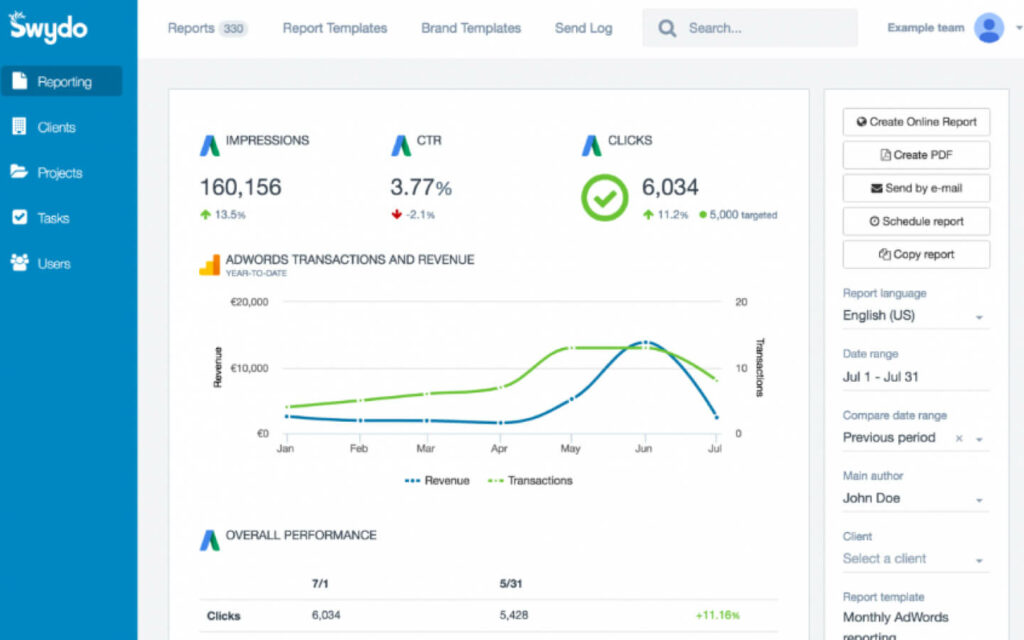
Swydo is an automated reporting and monitoring platform tailored for online marketers. It focuses on simplifying the creation of professional online marketing reports and dashboards, helping to save time and demonstrate the impact of marketing efforts. The platform emphasizes ease of use, particularly in PPC, social media, and analytics reporting, allowing the creation of insightful marketing reports quickly. It features simple KPI indicators to assess the performance of online campaigns and an easy-to-use interface with hundreds of templates and widgets for comprehensive, customized reporting. Swydo is designed to scale and automate client marketing reporting for agencies and brands, enhancing productivity and building client trust by showcasing marketing impact and ROI.
Positives of Swydo
- Automates Reporting: Swydo simplifies the reporting process for clients, making reports easy to understand.
- Cost-Effective and Flexible: It is less expensive than alternatives and highly flexible, suitable for all client reporting needs.
- User-Friendly: Swydo is known for its ease of use and reliability. The tool is flexible, with features like custom date range options on widgets.
- Customizable: It offers high customizability and is agile and enjoyable to work with
ReportGarden
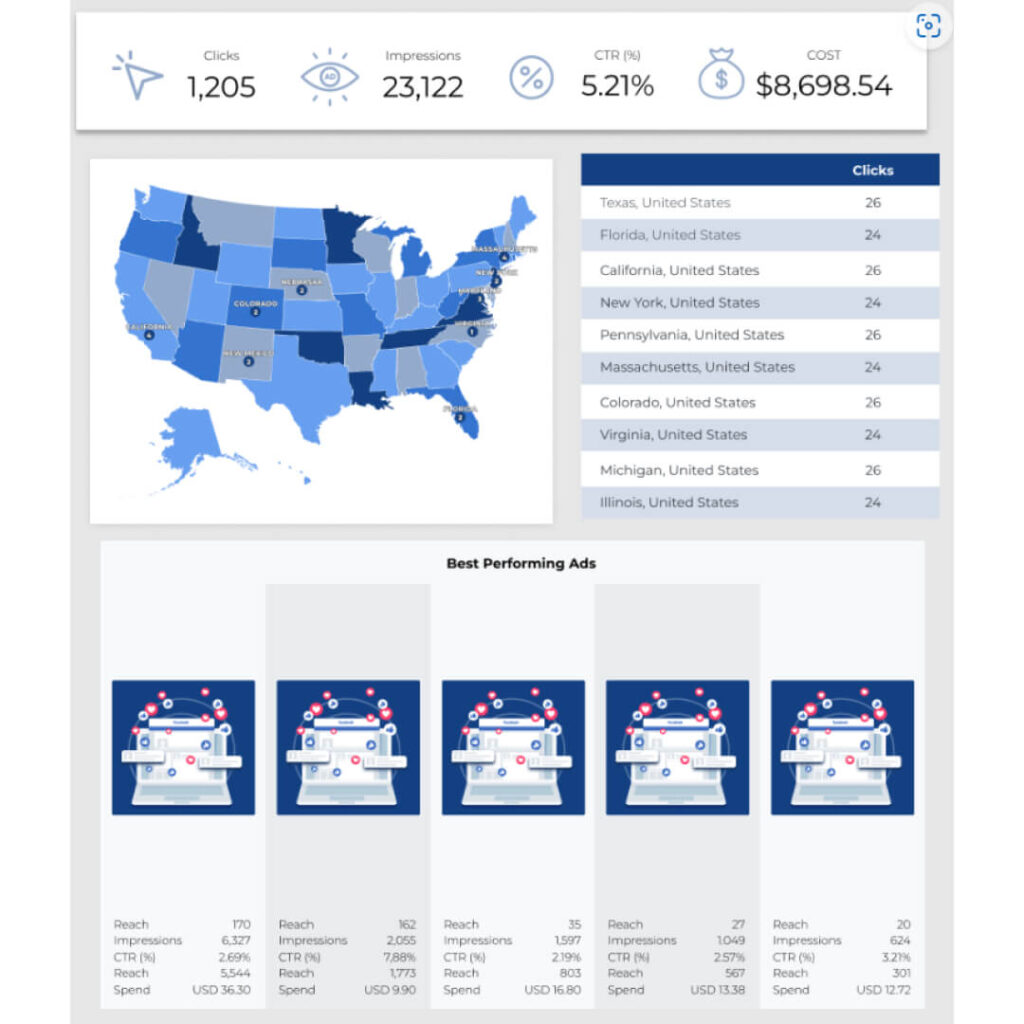
ReportGarden is a comprehensive reporting tool designed for digital advertising agencies and in-house marketing teams. It aids in creating performance reports, managing client data, and tracking SEO rankings and site audits. The platform simplifies the process of combining data from PPC, SEO, and social media accounts into a single client report, which not only saves time but also impresses clients with its ability to quickly generate visually appealing reports. Furthermore, ReportGarden is highly beneficial for automating client reporting and business processes, integrating with various platforms such as Google Analytics, AdWords, and Facebook Ads to create customizable reports. It is particularly useful for online ad agencies and freelancers who require professional client reports swiftly.
Positives of ReportGarden
- Simple Design and Layout: The platform features an easy-to-understand and simple design, making it user-friendly.
- Attractive Reports: Users appreciate the aesthetic appeal of the reports generated by ReportGarden.
- Colorful Graphs: The inclusion of colorful graphs enhances the visual presentation of data.
- Creation of Diverse Visual Elements: The platform allows for the creation of a variety of visual elements, adding to its versatility.
- Excellent Customer Service: Users have noted the high quality of customer support provided by ReportGarden

Conclusion
Embracing digital marketing platforms like these three examples offers a transformative leap from traditional Excel dashboards. These platforms not only simplify data management and reporting with their user-friendly interfaces and automation but also address specific challenges with customizable solutions. The transition is made smooth with free trials and easy integration, inviting you to experience efficiency, time-saving, and enhanced client relations. Each platform presents unique advantages, encouraging you to explore the potential of digital marketing software in elevating your agency’s capabilities.
Frequently Asked Questions about Excel Marketing Dashboard Templates
How do I create a marketing dashboard in Excel?
To create a marketing dashboard in Excel, start by collecting your marketing data. Then, open a new Excel workbook, input your data, and use Excel’s chart tools to create visual representations like graphs and charts. Utilize formulas to calculate key performance metrics. Finally, arrange these elements on one sheet for a comprehensive dashboard view, and regularly update it with new data for accuracy.
How do I create a sales dashboard in Excel?
To create a sales dashboard in Excel, begin by gathering your sales-related data. In a new Excel workbook, input this data and use Excel’s chart functions to create visual representations, such as graphs. Implement formulas for key sales metrics like total sales and conversion rates. Organize these charts and data points on a single sheet to form your dashboard. Regular updates with fresh data will ensure its ongoing effectiveness.
How do I create a simple marketing dashboard?
To create a simple marketing dashboard, first identify key metrics like website traffic and social media engagement. Gather this data from your marketing tools. Use a platform like Excel or Google Sheets to create your dashboard. Visualize the data with charts and graphs for clarity and organize these elements coherently on the dashboard. Remember to regularly update it with the latest data.
How do I create a marketing KPI dashboard in Excel?
To create a marketing KPI dashboard in Excel, first determine the key performance indicators (KPIs) relevant to your goals. Collect the corresponding data, then input it into an Excel workbook. Use Excel’s chart tools to visually represent these KPIs. Implement formulas for calculating specific metrics and arrange these visualizations on one sheet for a cohesive dashboard view. Regularly update the dashboard with new data for ongoing accuracy.
What are the three essential elements of a marketing dashboard?
Key Performance Indicators (KPIs): Crucial metrics like conversion rates and social media engagement.
Data Visualization: Tools such as charts and graphs for easy interpretation of data.
Real-Time Data Updates: Ensuring the dashboard displays the most current data for accurate decision-making.
What should be on a marketing dashboard?
A marketing dashboard should feature:
Key Performance Indicators: Metrics such as conversion rates and lead generation.
Campaign Performance Data: Effectiveness of marketing campaigns.
Website Analytics: Traffic, bounce rates, and page views.
Social Media Metrics: Engagement rates and follower growth.
Customer Engagement: Email metrics like open and click rates.
Sales Data: Correlation between marketing efforts and sales.
Budget and ROI: Overview of marketing spend and return on investment.
Trend Analysis: Insights into marketing trends and patterns.
What is a CMO dashboard?
A CMO (Chief Marketing Officer) dashboard is a specialized tool used by marketing executives to track and analyze the performance of marketing strategies and initiatives. It provides a high-level view of key marketing metrics and data, enabling CMOs to make informed decisions. These dashboards typically include data on marketing ROI, campaign performance, customer engagement metrics, market trends, and digital marketing analytics. The goal is to offer a comprehensive, real-time overview of the marketing department’s impact on the business, helping CMOs identify opportunities, allocate resources effectively, and align marketing objectives with overall business goals.
