



Oviond Blog

Analytics for Ecommerce: The 2026 Agency Reporting Guide

Ditch the reporting chaos. Our agency guide to analytics for ecommerce covers the KPIs, tools, and automated workflows you need to scale client reporting.

Co-Founder & CEO, Oviond
Analytics for Ecommerce: The 2026 Agency Reporting Guide

You're probably in the same loop every month.

An account manager is chasing numbers from Shopify. Someone else is checking GA4 because the revenue totals don't match. Paid media data is sitting in Google Ads and Meta Ads. Klaviyo is telling a different story about returning customers. A client review call is tomorrow morning, and your team is still copying charts into a slide deck hoping no formula breaks before send.

That isn't a reporting problem. It's an agency operations problem.

For agencies handling recurring client reporting across multiple ecommerce accounts, analytics for ecommerce has to do one job first. It has to make reporting reliable, repeatable, and easy to deliver at scale. If it doesn't, the data won't matter because the process will keep draining your team.

Table of Contents

The Real Reason Your Agency Hates Reporting

The worst reporting days all look the same. Your team isn't analyzing anything. They're hunting for exports, fixing date ranges, checking whether Shopify revenue includes refunds, and rewriting the same client commentary they wrote last month in slightly different words.

That's why reporting feels heavier than campaign work. Campaign work can scale. A broken reporting process can't.

A silhouette of a man looking out of a large window at a sunset city skyline.

Poor reporting is a retention risk

This isn't just internal frustration. It hits revenue. 75% of marketers terminate their relationship with digital marketing agencies specifically due to poor reporting, and the main things they want are clarity, forecasting accuracy, actionable insights, transparency, and customization, according to MarTech Series reporting data.

If you run an agency with 5 to 50 plus ecommerce clients, that stat should bother you.

Clients rarely leave because a chart looked ugly. They leave because the report made them work too hard to understand performance. They couldn't tell what changed. They couldn't tell what your team was doing about it. They stopped trusting the numbers, then they stopped trusting the relationship.

Practical rule: If your team needs a meeting to explain every report, the report isn't doing its job.

The issue isn't data access

Most agencies already have plenty of data. The problem is that it's scattered across ad platforms, analytics tools, ecommerce platforms, and retention tools. Then the agency piles one more layer on top with spreadsheets or patched-together dashboards.

That's why so much advice around analytics for ecommerce misses the point for agencies. It talks about store performance, but ignores reporting operations. Agency teams need a system built for recurring, multi-client, white-label delivery. That's a different problem entirely.

If you want a useful outside read on the broader discipline of mastering digital commerce data, it's worth reviewing. But for agencies, the key question is simpler. Can your team produce consistent client reporting without chaos every single month?

If the answer is no, your reporting stack needs a reset.

Ecommerce KPIs That Actually Matter to Clients

Most ecommerce reports still lead with revenue, purchases, and ROAS. That's lazy reporting. It tells the client what happened at the top line and hides the business reality underneath.

Clients don't keep agencies because a dashboard has more widgets. They keep agencies because the report helps them make better decisions about spend, retention, and margin.

An organizational chart showing essential ecommerce KPIs categorized into strategic growth, conversion engagement, and operational efficiency metrics.

Stop leading with revenue and ROAS

Revenue is incomplete. ROAS is often worse. A campaign can post strong revenue while pushing low-margin products, attracting discount-led buyers, or generating returns that don't show up cleanly in standard reporting.

For agencies, the fix is to report profit-aware KPIs. That means pulling performance closer to how the client runs the business.

Use this basic shift:

Old reporting habit Better agency reporting
Revenue Revenue with profitability context
ROAS POAS when profit inputs are available
Channel spend only CAC by channel and campaign
One-month wins LTV or CLV against acquisition cost
Platform totals MER and contribution to total growth

A practical benchmark also helps your team spot when the topline story is misleading. For high-volume fashion ecommerce stores with $50M to $100M revenue, the benchmark is 32% Customer Retention Rate and $480 CLV, according to Improvado's ecommerce analytics best practices. If a client's conversion rate looks healthy but those retention or lifetime value numbers are weak, you don't have growth. You have shallow acquisition.

Strong client reporting connects acquisition quality, retention, and margin. It doesn't stop at sales volume.

Use KPI stacks that match client decisions

Account managers need a cleaner structure than “all the metrics in one deck.” I'd use three layers.

  1. Board-level performance

    • CAC: What does it cost to acquire demand?
    • LTV or CLV: Is that acquisition worth it over time?
    • MER: Is total marketing spend producing efficient growth?
    • POAS: Is ad spend producing profit, not just orders?
  2. Channel-level diagnosis

    • Conversion rate by source
    • New versus returning customer mix
    • Repeat purchase signals
    • Return and cancellation impact where available
  3. Operational friction

    • Device split
    • Cart and checkout progression
    • Product or SKU mix
    • Campaign-level contribution issues

The client doesn't need every metric on page one. They need the few metrics that explain business movement, then enough detail underneath to support your recommendation.

A useful refresher on ecommerce KPIs agencies should track can help your team standardize this across accounts.

What to cut from the report

Some metrics still belong in dashboards, but not in the executive story.

  • Raw traffic spikes: Nice to see, not enough to guide budget.
  • Platform-specific vanity wins: Impression growth doesn't matter if acquisition quality slipped.
  • ROAS without return context: Agencies accidentally oversell weak campaigns.
  • Long metric dumps: Clients don't want a data archive. They want decisions.

Good analytics for ecommerce reporting is selective. That's what makes it useful.

Solving the Multi-Client Data Consolidation Problem

When an agency has a handful of ecommerce clients, people tolerate messy reporting. Once that client count grows, the reporting stack starts fighting back.

You can't build a dependable monthly process if one client uses Shopify, another uses WooCommerce, all of them use different ad mixes, and each account manager has their own spreadsheet logic for blending paid, analytics, and retention numbers.

The real issue is disconnected systems

The reporting problem starts with fragmentation. Ecommerce data lives in too many places. GA4 tracks site behavior. Shopify tracks orders. Ad platforms track spend and attributed conversions. Email platforms track flows and campaign revenue. None of them were built to tell a clean agency story by default.

That matters because ecommerce is now too large and too complex to manage with surface-level snapshots. Global retail ecommerce sales are projected to reach $6.9 trillion in 2026, up from an estimated $6.4 trillion in 2025, with online shopping accounting for about 20% of retail sales worldwide, according to Novadata's ecommerce statistics roundup. The same source notes average conversion rates sit between 2.5% and 3.0% across industries, while top performers exceed 5%, and mobile conversion at 1.8% trails desktop conversion at 3.6%. Agencies need reporting that separates these contexts cleanly, not one blended total that hides the true issue.

A dashboard that pulls channel data side by side is a start. It isn't enough unless the agency can align definitions and keep them consistent across clients.

What a usable consolidation layer looks like

You don't need your account managers acting like data engineers. You do need a stable consolidation layer between source systems and client reporting.

Here's what matters:

  • Unified source inputs: Pull in analytics, ad spend, ecommerce orders, and retention data into one reporting workflow.
  • Consistent metric definitions: CAC should mean the same thing across every client account.
  • Always-current views: Teams should stop exporting CSVs just to answer a client email.
  • Multi-client repeatability: One setup pattern should work across many ecommerce accounts.

A more advanced approach also helps future-proof attribution. Modern event streaming captures user actions continuously and lets agencies reprocess historical data with updated attribution models instead of getting stuck with one flawed view, as explained in this overview of ecommerce analytics architecture. That matters because agencies regularly inherit broken setups and changing channel mixes.

For practical examples of what unified client-facing views can look like, review these web analytics dashboard examples for agencies. The point isn't to build a giant BI system. The point is to stop making every account manager manually consolidate the same data every month.

Why Spreadsheets and Looker Studio Fail at Scale

Agencies usually outgrow reporting in stages. First it's spreadsheets. Then it's spreadsheets plus slides. Then someone builds dashboards in Looker Studio and calls it fixed. It isn't fixed. It's just moved.

A comparison infographic showing why manual spreadsheets and Looker Studio are limited for scaling client reporting tasks.

Spreadsheets break first

Spreadsheets are fine when one smart person owns five reports. They fall apart when a growing agency needs consistency across account managers, clients, and reporting cycles.

The problems are obvious:

  • Manual handling: Someone still has to export, paste, clean, and check.
  • Version confusion: Teams end up with multiple report copies and no confidence in which one is final.
  • Formula risk: One wrong cell reference can change the story.
  • Weak presentation: Branded delivery usually means extra work in slides or PDFs.

A spreadsheet can calculate. It can't run a scalable client reporting operation.

Looker Studio solves some problems and creates others

Looker Studio is useful. It's flexible, familiar, and often inexpensive to start with. That's why so many agencies use it. But agency pain shows up later.

Looker Studio asks agencies to act like maintainers. Somebody has to build templates, patch connectors, troubleshoot refresh issues, and manage client-specific copies. That's manageable with a smaller book of business. It gets rough once you're juggling many ecommerce accounts, custom branding demands, and recurring delivery expectations.

If your reporting stack depends on one internal power user, you don't have a system. You have a bottleneck.

Balanced comparison is crucial. AgencyAnalytics, Whatagraph, and Swydo all exist because agencies need more than generic dashboarding. They bring agency-friendly reporting workflows, and for some teams they'll be a better fit than continuing with a patched stack. The relevant comparison isn't “which tool is bad.” It's “which tool supports white-label, multi-client reporting without constant maintenance.”

What agencies should compare instead

When you evaluate reporting tools for analytics for ecommerce clients, stop comparing chart libraries. Compare operational fit.

Use this checklist:

Decision area What to check
White-label delivery Can you remove platform branding and use a custom domain?
Multi-client setup Can you duplicate templates and manage many clients cleanly?
Automated delivery Can reports send on schedule without manual intervention?
Branded dashboards Does the client experience feel like your agency, not a third-party tool?
Pricing logic Does cost scale sensibly with client count, not with every report or user?
Integration coverage Can you connect ecommerce, ad, analytics, and email data in one place?

A lot of teams stay with spreadsheets or Looker Studio because they've already invested in them. That's sunk-cost thinking. If the stack creates ongoing maintenance, reporting delays, and inconsistent client delivery, it's already too expensive.

If you're weighing generic dashboards against agency-native options, this comparison of alternatives to Looker Studio for agencies is a useful place to frame the trade-offs.

Agencies don't need more complexity. They need agency reporting that finally feels simple.

Designing Branded Reports Your Clients Will Value

A client report is part performance review, part account management, and part brand experience. Agencies often get the numbers roughly right and still miss the mark because the report looks generic, overloaded, or disconnected from decisions.

That's avoidable.

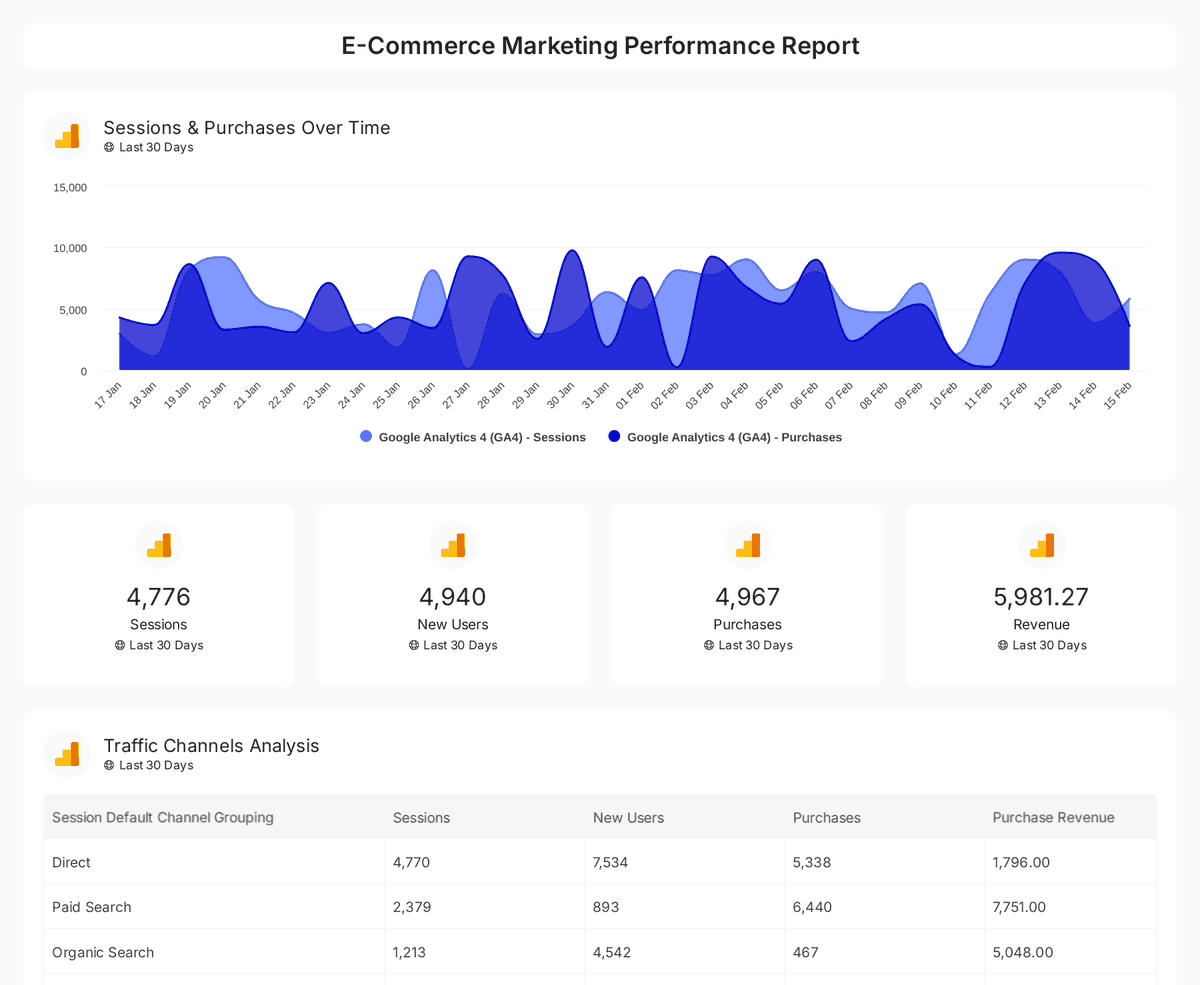
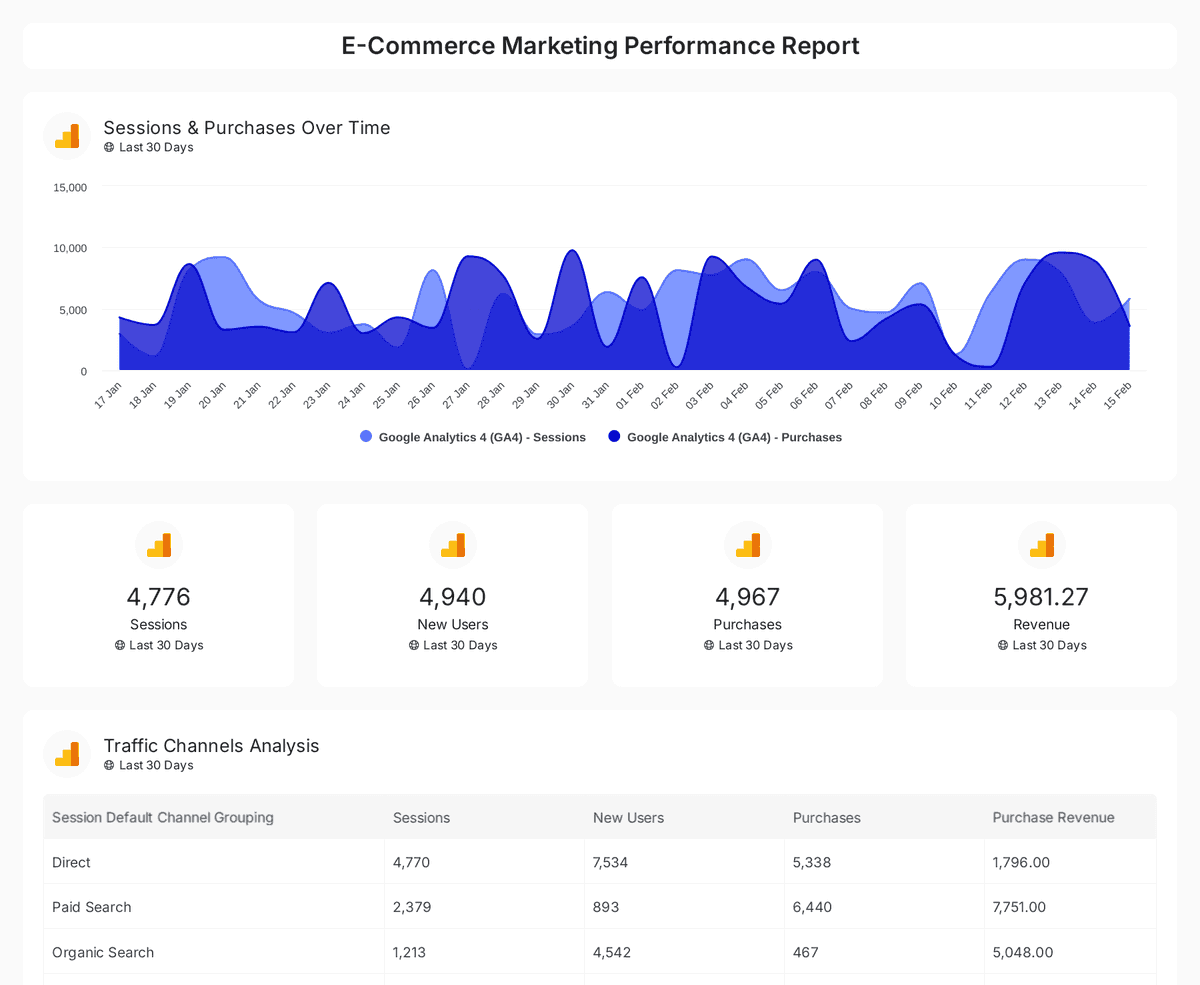
Screenshot from https://www.oviond.com

Start with the summary, not the channel dump

Most clients shouldn't open a report on page one and see twelve charts from four platforms. Start with the business summary. Then support it with channel detail.

A useful structure looks like this:

  1. Headline summary

    • What changed
    • Why it changed
    • What your agency is doing next
  2. Goal tracking

    • Show progress against agreed targets
    • Highlight misses without hiding them
    • Add short commentary, not paragraphs of filler
  3. Channel detail

    • Paid search
    • Paid social
    • Email
    • Organic or SEO
    • Ecommerce performance context

That format works because it matches how clients think. It also matches a strong reporting rule from Inbeat's guide to agency reporting: effective reporting should answer what changed, why it changed, and what action follows.

Client-facing filter: Every page should help the client make a decision or understand one you already made.

If your team struggles with what to include and what to leave out, Keyword Kick's SEO reporting advice is useful well beyond SEO. The same principle applies to ecommerce reporting. Skip clutter. Keep the narrative tight.

Branding matters more than agencies admit

White-label reporting isn't cosmetic. It changes how the client experiences your agency.

When a client receives a report on your brand, under your custom domain, with consistent styling and branded dashboards, the process feels deliberate. When they get a patched PDF, a Looker Studio link, and three screenshots in an email, the process feels improvised.

That's why agencies should standardize a few things:

  • Branded dashboards: Keep color, naming, and structure consistent.
  • Custom domain: Make client-facing links feel owned by your agency.
  • Custom sender setup: Reports should land from your agency, not a software vendor.
  • Reusable layouts: The same report logic should carry across accounts, even when channel mixes differ.

For a practical walkthrough of the white-label side, this guide on how agencies white-label reports and dashboards is worth reviewing.

Clients value reports they can read quickly, trust immediately, and share upward without explanation. That's the standard.

Automate and Scale Your Agency Reporting Workflow

Most agencies don't need more reporting effort. They need less manual handling and more consistency.

That's where the operating model changes. You stop treating reporting like a monthly production job and start treating it like a repeatable system.

Early in the process, it helps to see the workflow visually.

A six-step infographic showing how Oviond streamlines agency reporting with data integration, automation, and client dashboards.

Templates beat heroics

A lot of agencies still rely on senior team members to “own reporting quality.” That sounds responsible. It's fragile.

The scalable move is template-driven reporting. Build a reporting system once, then apply it across ecommerce clients with controlled customization.

That means:

  • Core report templates: One for ecommerce performance, one for paid media, one for executive summary.
  • Reusable KPI blocks: CAC, CLV, MER, channel performance, goal tracking.
  • Client-specific overlays: Branding, targets, notes, and selected views by service mix.
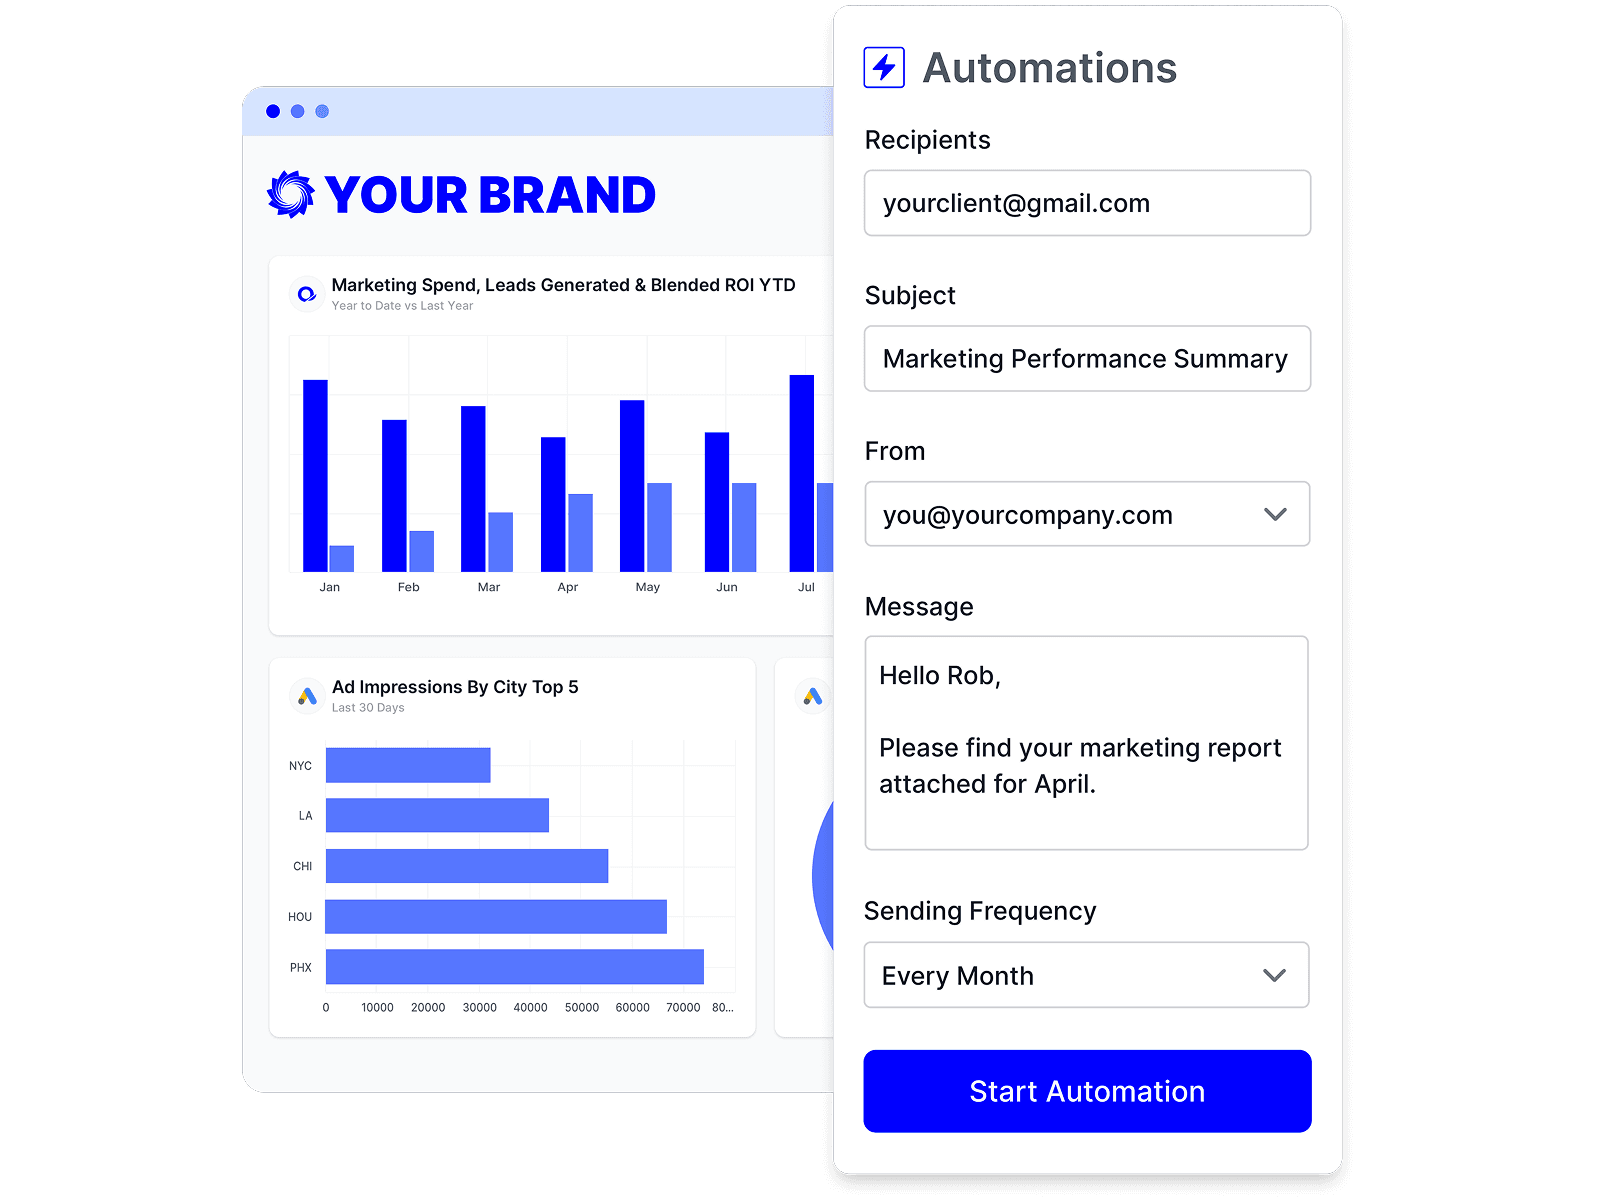
  • Automated delivery rules: Reports go out on schedule without someone remembering to press send.

This is also where automation changes economics. Agencies can reduce report creation time by up to 90% through automation tools, according to this analysis of agency reporting operations. That shift matters because it moves your team away from data entry and toward campaign decisions and client communication.

The second media element shows the workflow in motion.

Automation improves client service

Automated delivery isn't just an internal efficiency play. It changes the client relationship.

When reports are always current and consistently delivered, account managers can spend review calls discussing actions instead of apologizing for delays. Clients stop chasing updates. The agency stops rebuilding the same materials every month.

A strong workflow usually includes:

Workflow part What good looks like
Source connections Ecommerce, ad, analytics, email, and CRM inputs connected once
Template library Repeatable report formats for onboarding and recurring delivery
Branded output White-label dashboards, client-ready reports, custom domain
Scheduled sends Automated delivery by client, team, or stakeholder group
Internal QA Standard checks before a template rolls out broadly

Use AI setup carefully and practically

AI-assisted setup is useful when it reduces repetitive build work. It's not useful when it creates another messy layer your team can't govern.

Use AI or MCP-assisted setup for first drafts, report assembly, and templated summaries. Keep the logic, metric definitions, and client commentary under agency control. That's the right split.

If your current setup still depends on spreadsheets, manual exports, and one ops person holding it together, you don't need another workaround. You need a reporting workflow built for multi-client scale.

Your Path to Simple Agency Reporting

Analytics for ecommerce becomes manageable when agencies stop treating reporting like a custom craft project for every client.

The agencies that run cleanly do a few things well. They report on business metrics that clients care about. They consolidate disconnected data before it reaches the account team. They stop relying on spreadsheets and generic dashboards to carry a multi-client operation. They standardize white-label delivery. Then they automate the recurring work.

That's the whole game.

You don't need a BI team. You need a reporting system your agency can trust across every ecommerce account you manage. Once that system is in place, client reporting gets clearer, delivery gets easier, and your team gets back time for actual strategy.


If you want agency reporting that finally feels simple, take a look at Oviond. It's built for agencies managing multi-client reporting, with white-label dashboards, automated delivery, custom domain support, 50+ integrations, unlimited reports, unlimited users, and pricing that scales by client count instead of piling on per-user chaos.

Related articles

Simplify marketing reporting today

Stop juggling multiple tools. Start presenting clear, automated reports your clients will love