
Oviond Blog
Power BI vs Excel: Which Is Best for Client Reporting In
Deciding between Power BI vs Excel for client reporting? This guide compares capabilities, automation, and cost for multi-client marketing reports.

A comparison of Power BI vs Excel for agency reporting is probably not driven by curiosity. You're doing it because month-end is a mess.
One account manager is exporting Google Ads data. Another is fixing broken formulas in a spreadsheet someone duplicated three months ago. Client success is chasing the latest Meta numbers. Someone notices the branded PDF still has the wrong logo. Then a client asks for one more KPI, and the whole thing needs to be rebuilt again.
That's the core question behind Power BI vs Excel for agencies. Not which tool is “more powerful” in a vacuum. Which one holds up when you've got recurring client reporting across 5, 10, or 50+ accounts, different data sources, different stakeholders, and no appetite for adding more reporting admin every time you win a new client.
Table of Contents
- That End-of-Month Reporting Scramble You Know Too Well
- Power BI and Excel at a Glance for Agency Workflows
- Detailed Comparison for Agency Client Reporting
- Practical Use Cases in a Multi-Client Agency
- Beyond Spreadsheets The Rise of Agency Reporting Platforms
- The Final Verdict and Your Next Steps for Reporting
That End-of-Month Reporting Scramble You Know Too Well
By the last week of the month, the reporting pile starts to show. CSV exports. Spreadsheet tabs named “final”, “final v2”, and “use this one”. Notes from account managers pasted into cells. Screenshots dragged into decks because the chart formatting broke again.

If you manage reporting for multiple clients, this isn't a small annoyance. It's an operating problem. Manually collecting data from fragmented sources like Google Ads, Meta, and CRMs takes agency teams 2.5 to 5 hours per report when automation is absent, which eats directly into margin and delivery capacity, as outlined in this marketing reporting workflow breakdown.
That's why the Power BI vs Excel question shows up so often. Agencies hit a point where raw spreadsheet work stops being “good enough” and starts becoming expensive. Not because Excel is bad. Because recurring client reporting is a system, and most agencies are still handling it like a one-off task.
Practical rule: If reporting quality depends on who had time to clean the sheet this month, you don't have a reporting process. You have a recurring scramble.
I've seen agencies stay in that scramble longer than they should because Excel feels familiar. It's already there. Everybody can open it. Nobody needs approval to build another tab. That convenience is exactly why the mess grows unnoticed.
If your team is stuck deciding whether to keep patching spreadsheets or move toward a better workflow, this look at manual reporting vs automated digital marketing reporting addresses the core issue. The problem isn't just making reports. It's making them consistently, on brand, across a growing client base without rebuilding the same thing every month.
Power BI and Excel at a Glance for Agency Workflows
Before getting into the side-by-side detail, here's the blunt version. Excel is a spreadsheet that agencies have stretched into a reporting system. Power BI is a business intelligence tool that agencies often bend into a client reporting layer. Both can work. Neither feels naturally built for white-label, multi-client reporting.
| Area | Excel | Power BI |
|---|---|---|
| Core purpose | Ad hoc analysis, tables, calculations | Connected dashboards, data models, interactive reporting |
| Agency fit | Fine for small client counts and manual workflows | Stronger for connected reporting, but heavier to set up and manage |
| White-label client delivery | Crude and manual | Possible, but not naturally agency-friendly |
| Team familiarity | Very high | Moderate, depends on technical comfort |
| Multi-client operations | Gets messy fast | More structured, but more overhead |
Excel feels easy because everybody already knows it
That familiarity matters. A new account manager can open a workbook and start working. You can build quick pacing sheets, campaign trackers, budget calculators, and one-off analysis without much ceremony.
For agency operations, Excel still has a place. It's useful when you need to inspect raw numbers, clean up exports, or mock up KPI logic before standardizing it somewhere else. If you're trying to tighten an efficient Meta Ads workflow, Excel can still be a practical scratchpad.
The problem is that agencies rarely stop at scratchpad use. They turn Excel into the client reporting engine. That's where things break. Version control gets ugly. Branding is manual. Scheduled delivery is awkward. Client-by-client duplication creates a maintenance job nobody asked for.
Power BI is built for reporting, but not for agency simplicity
Power BI is much closer to a true reporting platform. It connects data sources, supports interactive dashboards, and gives you a more serious reporting environment than a workbook ever will. If your agency has technical talent, standardized data inputs, and internal appetite for setup work, it can absolutely outperform Excel for recurring reporting.
But it comes with weight. Data modeling, permissions, publishing, workspace setup, client access, and dashboard maintenance all need attention. That's manageable for some teams. It's a headache for agencies that just want live, branded client reporting without turning into a mini BI department.
If you're comparing your options from an agency point of view, this overview of dashboard and reporting software for agencies is useful because it frames reporting as an operations decision, not just a software feature list.
Detailed Comparison for Agency Client Reporting
Agency reporting pressure exposes tool weaknesses fast. A clean demo means nothing once you are managing 20 clients, five ad platforms, different KPI definitions, and a team that needs reports out the door without weekend cleanup.
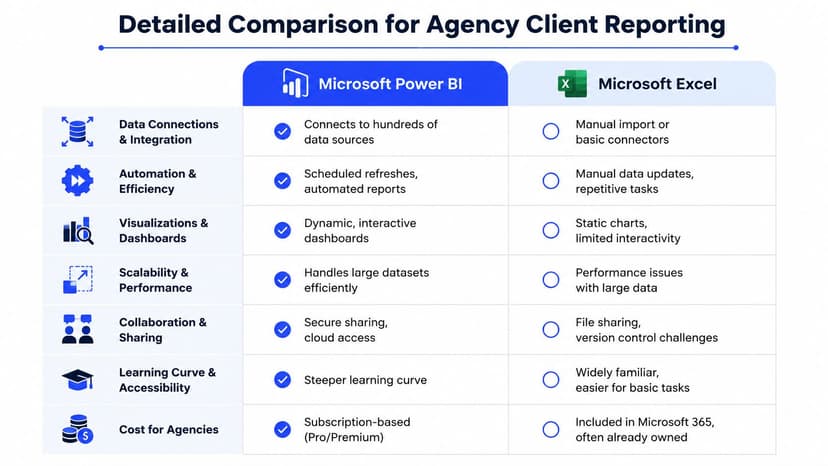
Data connections and integration
Power BI is the stronger reporting tool. Excel is the stronger working file.
That distinction matters in an agency. Reporting rarely pulls from one source. You are blending Google Ads, Meta, LinkedIn Ads, GA4, call tracking, CRM data, and one client's strange CSV export that nobody wants to talk about. Power BI is built to connect, model, and reuse that setup. Excel can connect too, but agencies usually end up with imports, copy-paste fixes, broken mappings, and manual checks that creep back into the process every month.
The pain shows up faster when clients start asking attribution questions that spreadsheets cannot explain cleanly. If your team is stuck there, this guide to solving ad attribution is a useful companion read.
For connected reporting across multiple clients, Power BI is the better foundation.
Dashboarding and visualization
Power BI produces a client-facing dashboard. Excel produces a spreadsheet that has been dressed up for client use.
That sounds harsh, but it is true. Power BI gives you filters, drill-down paths, interactive views, and a cleaner reading experience for clients who want to check performance without asking your team for a fresh export. Excel charts can still look decent, especially in a controlled template, but the experience stays tied to tabs, cells, and static layouts.
Agencies stretch Excel hard here. They build polished templates, lock tabs, add conditional formatting, and try to make the workbook feel presentation-ready. That approach works for a while. If your team still depends on spreadsheet-based reporting, these Excel marketing dashboard templates are a useful benchmark for what Excel can handle before the format starts fighting you.
Automation and delivery
At this stage, agency operations usually break.
Excel often needs human intervention. Someone refreshes data, checks formulas, swaps branding, exports the file, and makes sure the client did not receive the internal notes tab by mistake. Power BI reduces that manual handling because scheduled refresh and published dashboards are part of the product design.
That said, agencies should not confuse stronger automation with easier client delivery. Power BI solves the reporting engine better than Excel. It does not magically solve white-label presentation, client-by-client access, or the last-mile work of delivering polished reports to dozens of external stakeholders.
Scalability and data volume
Power BI handles larger reporting environments with less strain. Excel starts to drag once agencies push beyond summarized data.
According to this Power BI vs Excel architecture comparison, Excel has a hard cap of 1,048,576 rows per sheet and approximately 17.18 million total cells per worksheet, while Power BI is built to process much larger datasets through a columnar in-memory engine. That matters when your agency is aggregating daily performance data across many channels and many clients.
Here is the practical version:
- Small client portfolios with summarized data: Excel can still do the job.
- Multi-channel reporting with growing history: Power BI stays more stable.
- Agencies scaling account count and data sources at the same time: Excel workarounds pile up fast, and performance problems usually arrive after the reporting process is already messy.
Collaboration and control
Excel feels familiar. Familiar is not the same as safe.
Agencies know the pattern. An account manager updates the wrong version. A formula gets overwritten. A hidden tab gets exposed in a client copy. Then somebody spends an hour checking the document instead of reviewing performance. Excel makes it easy to start collaborating and easy to lose control.
Power BI is better for governed access because permissions are built more deliberately around published reports and shared views. For agency teams handling multiple clients inside one reporting environment, that matters. The more standardized your reporting becomes, the more dangerous workbook-based sharing gets.
Pricing and licensing
Excel wins the first budget conversation because many agencies already pay for Microsoft 365. That makes it look cheap.
The primary cost shows up in labor. Manual updates, duplicate templates, QA checks, export work, and version control are operating costs, even if they never appear on a software invoice.
Power BI requires a separate software decision and more setup discipline. It usually makes sense once your agency has enough clients, enough reporting complexity, and enough repetition to justify a proper BI layer. But from an agency perspective, there is still a gap between “strong BI tool” and “easy multi-client reporting system.” That gap matters if you need branded delivery, straightforward access control, and low-maintenance reporting across a client portfolio.
For most agencies, the honest comparison is simple. Excel is easier to start. Power BI is better for structured reporting. Neither was built specifically for high-volume, white-label agency reporting.
Practical Use Cases in a Multi-Client Agency
The easiest way to judge Power BI vs Excel is to look at how agencies end up using them.

The Excel agency
This is the agency with a manageable client list, tight budget control, and a team that can tolerate manual process for a while. Reporting lives in templates. Each client has a workbook. Account managers update tabs, swap logos, and export a PDF or presentation deck.
That can work when the service mix is simple and reporting expectations are basic. The trouble starts when one client wants daily pacing, another wants channel comparisons, and a third wants CRM data blended in with ad spend. The spreadsheet stack grows. So does the maintenance.
The Power BI agency
This agency has hit a wall with manual reporting and wants proper connected dashboards. They invest in setup. They build data models. They create cleaner views. Internal stakeholders like it because reporting finally looks and feels structured.
Then the agency side of the business pushes back. White-label delivery is clunky. Client-by-client permissions need attention. Small reporting changes turn into build work. The system is stronger than Excel, but it still doesn't feel light.
A tool can be technically better and still be operationally wrong for the way an agency delivers services.
A good example of the gap between technical reporting and client-facing reporting is in the video below. It's useful to watch with an ops lens, not just a dashboard lens.
Where both start to crack
Both tools break under pressure in different ways.
- Excel breaks through repetition: too many copies, too many manual updates, too much version chasing.
- Power BI breaks through overhead: too much setup, too much admin, too much distance between the dashboard and the client delivery experience.
- Agencies feel both breaks sooner: because recurring reporting is client work, not just internal analysis.
That's why the debate often feels unsatisfying. Excel is too manual. Power BI can be too heavy. The agency still needs branded dashboards, automated delivery, custom domain options, and a simple way to manage reporting across many clients without turning every change into a project.
Beyond Spreadsheets The Rise of Agency Reporting Platforms
Monday morning. Your account team is chasing late numbers, a client wants their logo added before noon, and someone notices two dashboards for different accounts are pulling from the same template with different filters. This is the point where the Power BI vs Excel argument stops being useful. Agency reporting is an operations problem.
Generic tools keep pushing agencies into extra process because they were not built for client delivery across dozens of accounts. Excel handles flexible analysis. Power BI handles structured BI. Agencies need repeatable reporting, white-label presentation, controlled client access, and fast rollout across many clients without turning every request into internal production work.
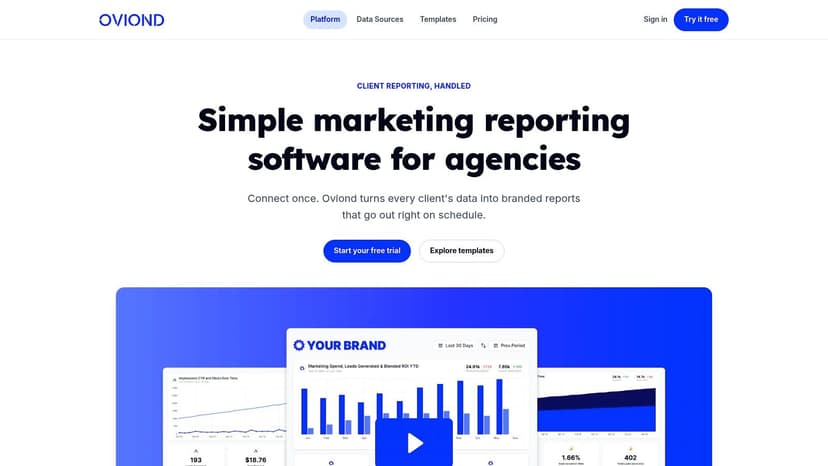
That gap created a separate category for a reason. Agency reporting platforms are built around service delivery. The job is not just to show data. The job is to deliver consistent, branded reporting to many clients, on schedule, with less manual handling from ops and account managers.
The difference shows up in the details that create workload:
- White-label delivery: client-facing dashboards and reports look like your agency, not the software vendor.
- Custom domain options: clients log into a branded environment that supports your positioning.
- Multi-client management: teams manage a portfolio from one setup instead of maintaining scattered one-off builds.
- Automated delivery: recurring reports go out on time without monthly assembly work.
- Agency-friendly administration: account teams can manage routine changes without relying on a BI specialist for every update.
That is why many agencies outgrow both spreadsheets and general BI tools. They need reporting operations that hold up under scale. The best platforms in this category keep the structure tight enough for ops, but simple enough that client teams can still move fast.
Looker Studio often becomes the interim step because it feels lighter. Then the same agency runs into connector instability, template drift, and reporting inconsistency across accounts. AgencyAnalytics, Whatagraph, Swydo, and Oviond sit in the more relevant category because they start with the agency use case instead of forcing one onto an internal BI product.
If you want a practical blueprint for what repeatable client reporting should include, this article on social media reporting system development is worth reading. It focuses on process design and delivery standards, which is the part agencies usually underestimate.
A good agency platform should do five things well. It should support branded client delivery, reduce template sprawl, centralize account management, automate recurring outputs, and stay usable for account managers who are not data engineers.
If your team is still buried in spreadsheet reporting, this guide on migrating from Excel to a reporting platform will help you map the transition. The smart move is not buying a fancier charting layer. It is choosing a reporting system that fits how agencies operate under client pressure.
The Final Verdict and Your Next Steps for Reporting
Month-end hits. An account manager is chasing numbers across ad platforms, someone has the wrong spreadsheet version open, and a client wants a branded report in an hour. That is the test.
Excel can get a small agency through that moment for a while. Power BI can give you more control and better analysis. Neither is the best operating system for a growing agency that has to deliver repeatable, white-label reporting across a stack of client accounts.
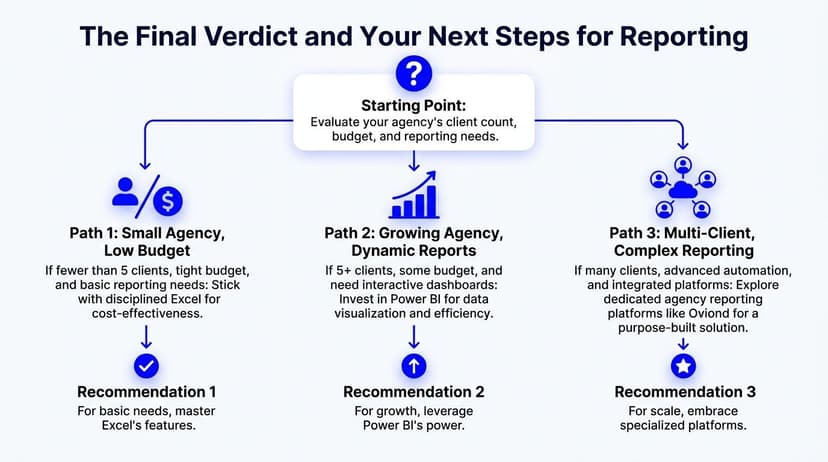
My direct recommendation
Use Excel if you have a small client base, simple reporting, and a team that can follow process without fail. Keep tight control over templates, file ownership, and approvals. The moment reporting starts depending on manual copy-paste across multiple accounts, Excel becomes an operations problem, not just a reporting tool.
Use Power BI if your agency has real BI talent in-house and you need deeper analysis across larger datasets. It handles data modeling far better than Excel. It still asks your team to do extra work around client delivery, branding, account structure, and day-to-day usability for account managers.
For most agencies past the early stage, the better decision is to stop forcing internal analytics tools into a client reporting job. Choose a platform built for agency reporting.
That is the key distinction. Power BI is more capable than Excel from a data and governance perspective, as noted earlier. Agency fit is a different question. If your team manages multiple clients, recurring deadlines, branded outputs, and non-technical users, fit matters more than raw feature depth.
The right reporting system cuts admin time, keeps delivery consistent, and stays under control as client count grows.
A sensible migration checklist
Do not start with software demos. Start with the reporting model your agency needs to run well.
- Standardize your KPI set. Define what every client report must contain before you rebuild dashboards.
- Map every data source. Include ad platforms, analytics, CRM data, SEO tools, email platforms, and the spreadsheets your team still relies on.
- Separate analysis from delivery. Your strategists may need one environment for exploration and another for client-ready reporting.
- Choose the delivery format. Decide whether clients should get a live dashboard, scheduled email, branded link, embedded view, or PDF.
- Set rules for access, approvals, and branding. Agencies live or die on consistency here.
- Pilot the new setup with a few clients first. Fix the workflow before you roll it out across the whole account base.
If reporting feels heavier every quarter, the verdict is already in. Your current setup is slowing the agency down.
If you want agency reporting that finally feels simple, take a look at Oviond. It's built for agencies managing multi-client reporting with white-label dashboards, branded reports, custom domain delivery, 70+ integrations, automated delivery, unlimited reports and users, and AI/MCP-assisted setup. It's the simpler, agency-native alternative to spreadsheet sprawl and Looker Studio chaos.
Related articles
Simplify marketing reporting today
Stop juggling multiple tools. Start presenting clear, automated reports your clients will love