
Oviond Blog
10 Databox Alternative Tools for Agency Reporting in 2026
Searching for a Databox alternative? We review 10 top reporting tools for marketing agencies, comparing features, white-labeling, and pricing for 2026.

Is your agency still stuck building reports the hard way at the end of every month? You're pulling numbers from Google Ads, GA4, Search Console, Meta, LinkedIn, email, and maybe CRM data, then trying to package it all into something that looks polished enough for a client call. Databox is a familiar name in that workflow, but a real databox alternative for agencies has to solve a different problem, namely multi-client reporting, white-label delivery, and pricing that doesn't get messy as the roster grows. This list gets straight to the point. If you're managing 5 to 50+ clients and want reporting that feels professional without living in spreadsheets, these are the tools worth comparing.
Table of Contents
- 1. Oviond
- 1. Oviond
- 2. AgencyAnalytics
- 3. Whatagraph
- 4. DashThis
- 5. Swydo
- 6. NinjaCat
- 7. TapClicks
- 8. Klipfolio (Klips)
- 10. Geckoboard
- 10. Geckoboard
- Top 10 Databox Alternatives: Core Features Comparison
- How to Choose the Right Reporting Tool for Your Agency
1. Oviond
An agency lead looking at report automation usually wants the same three things, less manual cleanup, cleaner client delivery, and pricing that still makes sense as the account list grows. Oviond fits that brief well because it is built around white-label client reporting and the day-to-day problems that come with scattered client data, repeated monthly rebuilds, and inconsistent branding across deliverables. It gives agencies a practical way to keep reporting organized without rebuilding the same workflow for every account.
Why agencies pick it
Oviond connects to 60+ sources, including GA4, Google Ads, Meta, LinkedIn, Shopify, Mailchimp, YouTube, and Google Search Console, then turns that data into drag-and-drop dashboards and branded reports. The plan setup is easy to understand, with one plan that includes everything, starting at $39/month billed annually for the first five clients or $49 month-to-month. Pricing scales by client count, which is more workable for agencies than models that charge extra for every user or every report. That matters in real agency operations because the reporting load usually grows with client count, not with the number of people who need access.
The bigger operational value is the package around the dashboards. Oviond includes unlimited users, unlimited dashboards, unlimited reports, custom domains, custom email senders, scheduled delivery, reusable assets, and AI-assisted report creation through its MCP server. Compare Oviond with AgencyAnalytics if you want to see how the agency reporting workflow differs in practice.
It also removes the need to rebuild reports from scratch for each client. A team that is sending the same KPI structure every month can standardize layouts, keep branding consistent, and reduce the last-minute cleanup that usually eats into client-facing time. The product site is worth a trial if your current process still depends on manual cleanup before every client send.
1. Oviond
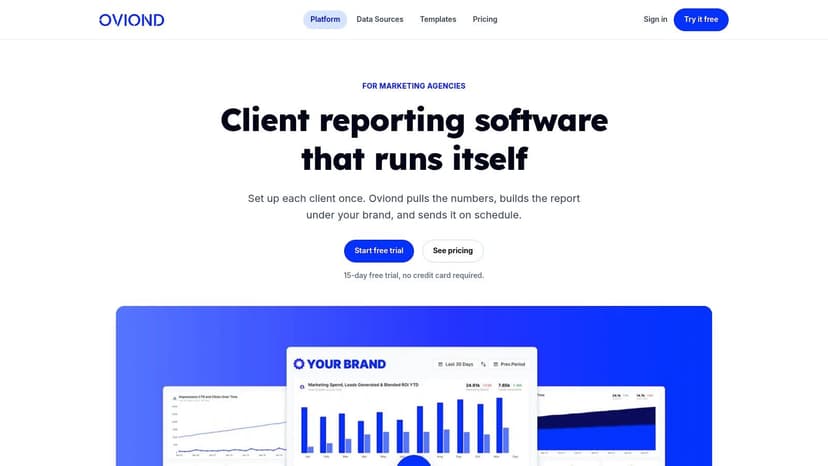
Oviond fits agencies that need white-label client reporting without turning every monthly send into a custom build. It is set up for the day-to-day problems that slow teams down, scattered client data, repeated manual rebuilds, and branding that looks inconsistent from one report to the next. The practical appeal is straightforward, agency reporting that stays organized without extra busywork.
Why agencies pick it
Oviond pulls from 60+ sources, including GA4, Google Ads, Meta, LinkedIn, Shopify, Mailchimp, YouTube, and Google Search Console, then turns that data into drag-and-drop dashboards and branded reports. The plan structure is easy to explain to clients and internal teams, one plan with everything included, starting at $39/month billed annually for the first five clients or $49 month-to-month. Pricing scales by client count instead of by seat, which is usually easier for agencies to manage because the reporting workload rises with accounts, not with headcount.
The operational value is in the package around the dashboards. Oviond includes unlimited users, unlimited dashboards, unlimited reports, custom domains, custom email senders, scheduled delivery, reusable assets, and AI-assisted report creation through its MCP server. It also includes migration support and human support from the entry plan, which matters when you are switching reporting systems while active clients still expect clean monthly delivery.
Practical rule: If your team keeps rebuilding the same monthly structure for every retainer, use a tool that lets you standardize one template and reuse it across accounts. That is where Oviond feels built for agency work instead of generic dashboarding.
The trade-offs are real. Deep customization can take time, and highly bespoke reporting setups may still require patience. Some users report rough edges such as PDF export bugs and niche connector gaps, so if your agency depends on unusual data sources, test those first before moving client reporting over.
Where it fits best
Oviond makes the most sense for marketing agencies, account leads, and ops managers who want to centralize channels, automate delivery, and keep the client-facing experience polished. Its included white-labeling and custom domain support matter when clients should see your brand, not your software vendor's. The reusable templates for PPC, e-commerce, GA4, social, and website performance also help standardize reporting across a growing book of business.
The bigger point is that Oviond avoids the usual agency tax. You are not paying per seat, you are not bolting on white-labeling as an extra layer, and you are not forcing your team to stitch together dashboards, reports, and exports separately. For agencies that want one reporting stack instead of a bundle of disconnected tools, that is a meaningful difference.
If you want to compare it directly against another common agency option, see the AgencyAnalytics alternative comparison. The product site is at Oviond, and it is worth a trial if your current process still depends on manual cleanup before every client send.
2. AgencyAnalytics
AgencyAnalytics fits agencies that need client reporting to stay predictable across a busy roster. The platform is built around unlimited reports, unlimited dashboards, unlimited users, client portals, and white-labeling with a custom domain and custom email. For recurring retainers, that mix is practical because it gives account teams a stable delivery process without turning every report into a special project.
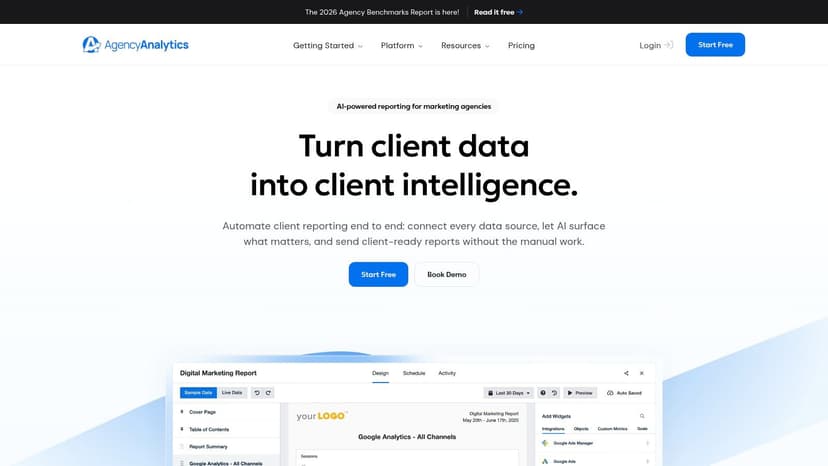
AgencyAnalytics also reflects how the category has split for agencies. A 2026 comparison lists it at about $59/month, well below Databox's reported starting point of about $159/month and its lack of a forever-free plan in 2026, while still giving teams a reporting stack that feels more agency-specific than a generic dashboard tool. That price gap matters because many agencies are no longer buying a chart builder, they are buying a delivery layer that will not become awkward as client count grows. The broader market comparison also points to Databox's 130+ integrations and 4,000+ ready-to-use metrics, but AgencyAnalytics stands out when packaging and client workflow matter more than raw metric volume.
What it does well
The platform's 85+ integrations and unlimited data sources per client make it easier to centralize common agency stacks without babysitting every connection. The optional Rank Tracker and AI Tracker add SEO and brand presence coverage, which helps if you want recurring reporting and search monitoring in one place. That combination keeps reports professional without forcing a separate SEO tool into the workflow.
AgencyAnalytics is also strong on client-facing delivery. Scheduled reports, a client portal, and deeper white-labeling give account managers a cleaner handoff to clients who expect branded materials. The 14-day free trial and 30-day money-back policy lower the risk of testing it against a live account structure. If you want a direct comparison, see the AgencyAnalytics alternative comparison for a closer look at how it stacks up in agency reporting use cases.
What to watch
Per-client billing can feel expensive if your roster is still small or unstable. Add-ons for rank tracking and AI credits can also raise the total bill, so the headline price is only part of the decision. If your agency only needs a few dashboards and very simple deliverables, the platform may offer more than you need.
For agencies comparing tools directly, the question is whether you want a reporting system that feels agency-ready out of the box or a broader analytics workspace you will shape yourself. AgencyAnalytics is the former, and for many client-success teams that is the easier operational choice. Visit AgencyAnalytics if your work depends on clean, repeatable monthly reporting.
3. Whatagraph
Whatagraph is a good choice when your agency wants a visual reporting layer that doesn't collapse under multi-client complexity. It's aimed at teams that care about governed reporting, white-label delivery, and a more polished client experience than a basic dashboard tool can usually provide. The platform also fits agencies that don't want to babysit integrations all month.
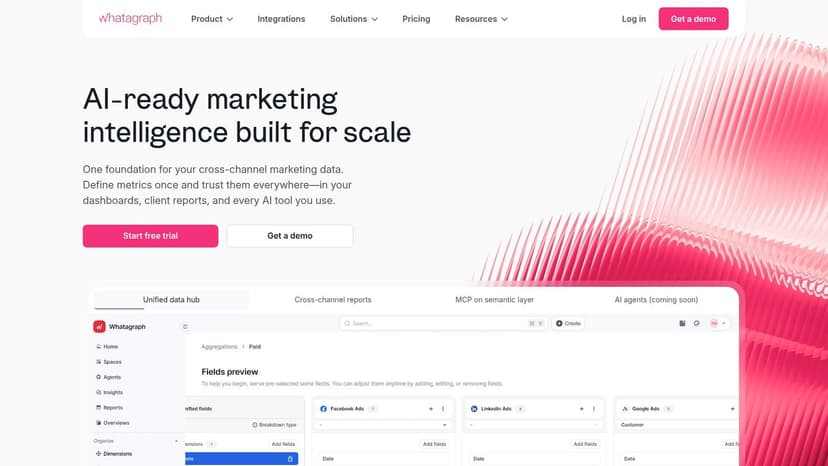
The connector side is the headline. One 2026 comparison says Whatagraph has 50+ sources in one listing, and another review positions it as a governed, white-label reporting layer with AI reporting and 30-minute data refresh rates. That matters for agencies because the pain isn't just getting data in, it's getting data in reliably enough that your team isn't fielding “why is this number different?” emails every Monday morning. The platform's broader positioning also lines up with agencies managing 15 or more clients, which is where templated reporting starts to become a real operational lever.
Where it stands out
Whatagraph leans heavily into presentation quality. The reports are visual, the branding options are strong on higher tiers, and the workflow is designed for agencies that need something clients can open without extra explanation. Unlimited users are included, which removes the annoying collaboration penalty that shows up in a lot of other tools.
It also brings AI summaries through Whatagraph IQ and a more governed data foundation, which is useful when your team wants summaries without writing them from scratch every time. In practice, that means fewer hand-built report narratives and less time cleaning up context before client send-out.
If you manage several brands or business units, governed templates matter more than flashy charts. They keep your team from rebuilding the same logic for every account.
Where it can pinch
The source-credit model can add cost at scale, especially if your client stack is broad. Prices are listed in euros, which makes planning less intuitive for some teams, and advanced connectors are gated to higher tiers. That's fine if your roster is stable, but it's something to check closely before standardizing on it.
For agencies that want a polished reporting environment and are willing to pay for it, Whatagraph is a credible option. For smaller teams, the base price may be harder to justify than simpler alternatives. See Whatagraph if your agency's reputation depends on how the report looks as much as what it contains. If you want a direct comparison, the Whatagraph alternative page is useful reading.
4. DashThis
DashThis fits agencies that need reporting to move fast without turning setup into a project of its own. It works well when the priority is getting client dashboards live quickly, keeping them easy to read, and avoiding the friction that comes with heavier reporting platforms. The visual style stays plain and clear, which is often what account managers need when they are sending reports to clients who do not want a long walkthrough.
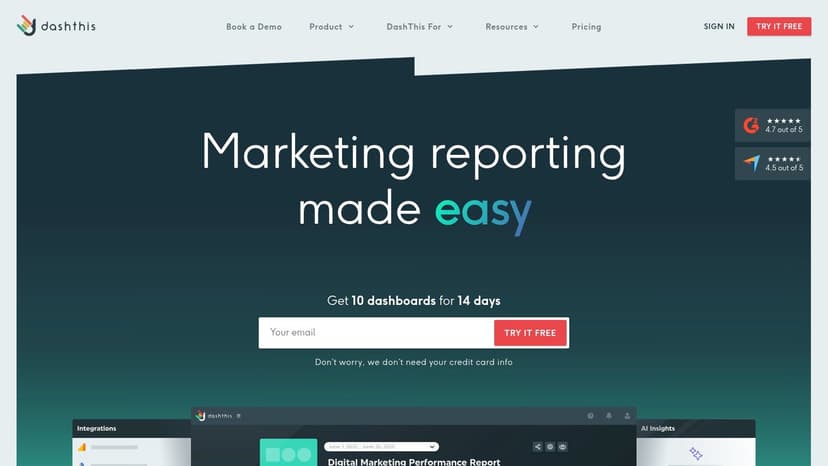
DashThis also sits in the middle of the category split between free and premium tools. A 2026 comparison lists it from about $35/month, and the same market snapshot places Looker Studio as free for unlimited users, reports, and data sources, with Pro features starting around $9 per user per month. That comparison helps frame DashThis properly, it is not aiming to be the lowest-cost option, it is aiming to be the fast one that still feels client-ready.
Why it works for agencies
The biggest advantage is setup speed. DashThis gives you templates for PPC, social, GA4, and e-commerce reporting, so your team is not rebuilding every dashboard from a blank screen. It also includes unlimited users on all plans, which keeps collaboration simple as account loads grow.
Calculated widgets and access to unlimited integrations help when you need blended metrics without manually recreating the same logic every month. White-labeling, a custom domain, and custom email options appear on mid and high tiers, so the client-facing finish can stay professional. That matters for agencies that want the reporting layer to look polished without spending extra time on design work each cycle.
What to think about
The entry plan is limited, with only 3 dashboards, so the economics change quickly if you support a larger client list. AI Insights Pro is also a paid add-on, so the AI layer is not included in the base package. That makes DashThis practical, but not always the cheapest choice once reporting volume starts to grow.
For small agencies that want a clean, dependable, low-friction reporting layer, it is a smart comparison point. For larger shops with many clients and multiple channel mixes, compare the dashboard count carefully before committing. Visit DashThis if you need a quick-deploy option that will not make your team relearn reporting from scratch.
5. Swydo
Swydo is built for agencies that value predictability more than flash. If your team manages many clients with fairly consistent channel stacks, its pricing and workflow can be a better fit than tools that charge based on seats or ever-expanding extras. It's one of the cleaner examples of agency-first reporting software.
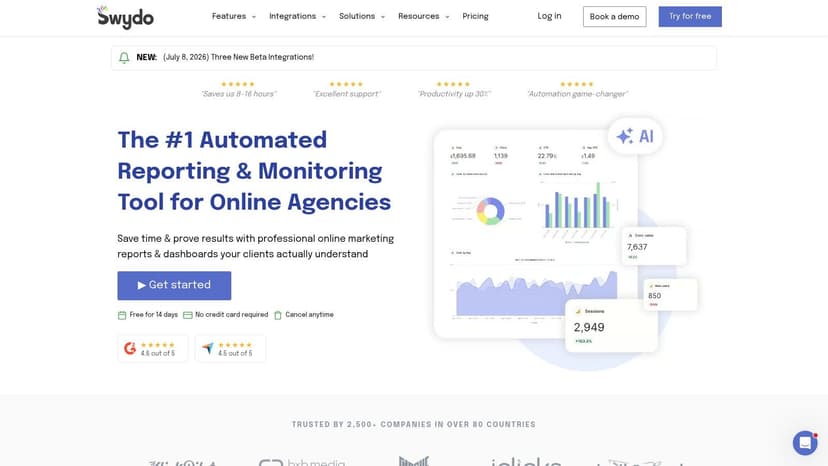
A 2026 agency comparison says Swydo bundles 32+ integrations with unlimited users, dashboards, and reports for €62/month, and that pricing is tied to active data sources instead of client count. That matters because a lot of agencies don't scale in a neat line. One client may use only Google and Meta, while another needs email, search, and sheets on top. Swydo's model makes that source load easier to forecast.
What agencies use it for
The platform includes goals, alerts, combined data sources, custom metrics, and Google Sheets import, which helps cover connector gaps without forcing the team into a separate ETL workflow. It also offers full white-labeling and client-friendly PDF or email scheduling, which makes the final delivery feel organized even when the back end is messy.
The value is the billing logic. Unlimited users and reporting capacity remove the usual collaboration tax, so operations teams can bring in the people who need access without worrying about another seat fee. That makes Swydo attractive when your team is spread across account management, reporting, and client success.
Practical rule: Per-source pricing works best when your agency sells repeatable service packages. If every client has a different stack, the math gets harder to forecast.
What to check first
The integration catalog is smaller than some broader platforms, so verify every must-have connector before you standardize on it. If your clients rely on niche ad platforms or less common marketing tools, you may need Google Sheets imports or another workaround.
Swydo is best viewed as a practical reporting engine, not a sprawling data platform. That's a strength if your goal is consistent agency delivery. See Swydo if you want predictable client reporting without unnecessary complexity. For a direct comparison, the Swydo alternative page is useful.
6. NinjaCat
NinjaCat is the kind of platform agencies move toward when reporting has outgrown simple dashboards. It's built for multi-account reporting, governed data, and presentation-ready outputs that can support more complex client structures, including franchises and multi-location businesses. This isn't a lightweight tool.
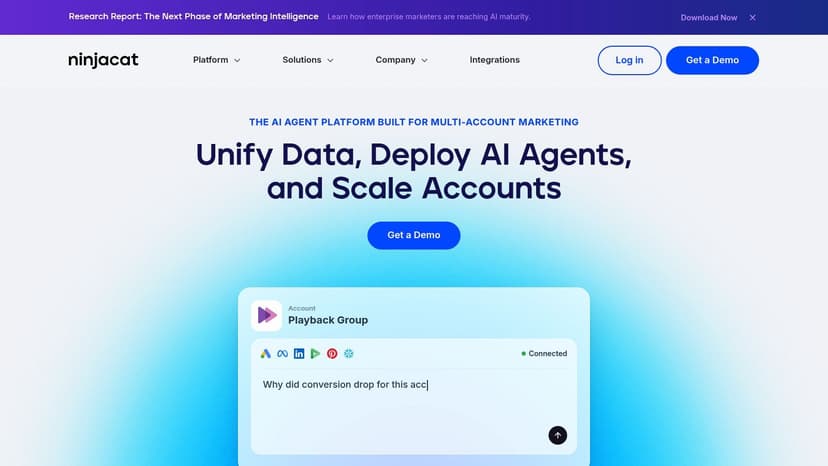
The technical posture is clear. It offers white-label reports, dashboards, and emails, plus roll-up reporting and a governed data layer. It's the kind of setup that makes sense when an agency needs consistent reporting across complex account hierarchies instead of one-off client dashboards.
Why larger agencies look at it
NinjaCat's reporting system is built for standardization. Template-driven presentations, roll-up structures, and governed calculations reduce the amount of ad hoc work required from account teams. That helps when multiple people touch the same client portfolio and you want fewer surprises in the final output.
The platform also supports natural language querying through Data Apps and templating for presentations, which gives the team a more guided path than a pure BI stack would. For agencies that operate like a marketing operations group, that structure can be valuable.
The trade-off
The price is custom and typically higher, so it's not a casual switch. It can also be overkill for smaller agencies that just need clean dashboards and monthly PDFs. If your reporting stack is still relatively simple, NinjaCat can feel like too much machinery for the job.
That said, it has a place. If your agency handles many brands, many locations, or client structures that need roll-ups and governance, the tool earns its keep by reducing chaos. Go to NinjaCat if your reporting needs have clearly moved beyond basic dashboarding.
7. TapClicks
TapClicks is for agencies that want reporting to sit inside a broader marketing operations system. It's more than a dashboard tool, and that's the point. When your team needs data unification, reporting, workflow routing, and presentation output in one ecosystem, TapClicks becomes relevant.
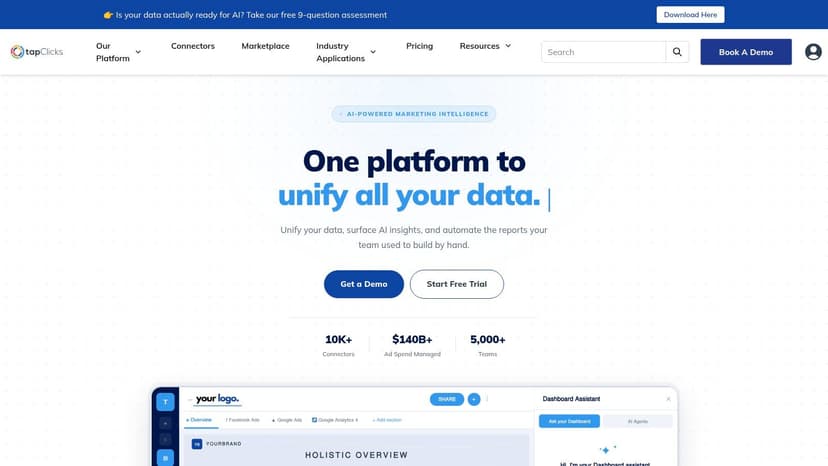
Connector breadth is a major part of the pitch. Independent comparison material places TapClicks at 250+ connectors, and another market comparison notes broader marketplace coverage at scale. That sort of reach matters when your agency handles diverse channel stacks and wants fewer compromises in client reporting.
Where it fits operationally
TapClicks includes SmartReports for automated reporting, SmartStory for one-click decks, and SmartAnalytics for dashboards. It also bundles workflow features through TapOrders and other operational modules, so it can help agencies move from report production into actual process management. That's useful if your reporting team keeps getting pulled into order routing or marketing ops cleanup.
The AI layer is another distinction. The platform's AI-driven narratives and deck generation are designed for agencies that need client-ready output without building every presentation manually. That can be a relief when the monthly reporting cycle also includes QBR prep.
Where it gets heavy
The downside is implementation weight. Pricing isn't publicly listed, and the platform usually requires sales engagement. Setup can also be heavier than lighter tools, which is a real consideration if you want a quick switch. This is not the tool to choose if your biggest issue is getting a cleaner monthly report out the door.
TapClicks makes sense when reporting and operations are already intertwined in your agency. If that's your world, the broader ecosystem can justify itself. Visit TapClicks if your reporting stack needs to live alongside workflow, automation, and delivery management.
8. Klipfolio (Klips)
Klipfolio fits agencies that need more control than a templated reporting product usually allows. It works well for teams that are comfortable with spreadsheets, SQL, or more technical KPI logic, and it can handle a wider mix of custom data sources than a basic agency dashboard tool.
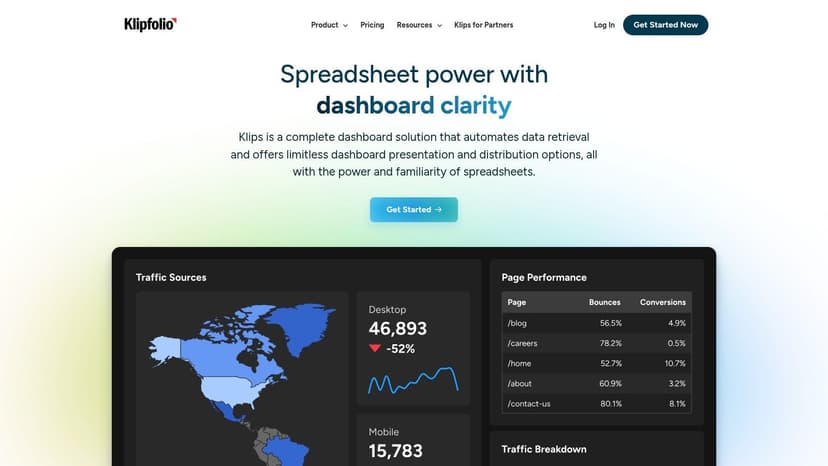
A 2026 comparison describes Klipfolio as supporting 200+ services and APIs, plus Excel, Sheets, SQL, and REST connections. Another source notes Databox's 130+ native integrations and 4,000+ ready-to-use metrics, so the key comparison is how much custom work your team wants to handle.
Why agencies choose it
Klipfolio is useful when your agency needs custom KPIs and unusual data sources. The formula logic is flexible, the dashboards are highly customizable, and the platform offers onboarding support to help teams get moving faster. That makes it a practical fit for agencies with technical strength that still want a presentation layer more polished than a pure BI environment.
The pricing model is also clearer than what you get from some enterprise tools. The entry tier can work for teams that need deeper customization without moving straight into a heavyweight analytics stack.
The reality check
Klipfolio requires more hands-on setup than plug-and-play tools. That works if your operations lead or analyst likes building logic and tuning widgets. It creates friction if your client team wants reports that run with little ongoing maintenance.
Practical rule: Choose Klipfolio when your agency needs flexibility, not when your priority is the lowest-friction client reporting workflow.
For agencies with technical capacity that want a configurable dashboard environment, it deserves a close look. Visit Klipfolio if your reporting process relies on custom logic and non-standard metrics.
10. Geckoboard

Geckoboard is the comparison that fits agencies looking for live KPI visibility more than client report production. It works well for internal monitoring, office screens, Slack snapshots, and quick performance checks, while agencies that need polished client deliverables usually need something else. That difference matters once reporting has to look client-ready.
Independent comparison material describes Geckoboard with 90+ data sources and live refresh, and a 2026 comparison places it from about $35/month. Databox now starts at about $159/month in one industry comparison, so the cost gap is part of the conversation. Geckoboard sits closer to team visibility than to full client reporting.
Where it shines
Geckoboard is quick to set up for live KPI dashboards. Shareable links, TV rotation, Slack, Teams, and email snapshots make it easy to keep the team aware of what matters. Unlimited viewers on paid tiers also helps when a lot of people need visibility but not edit access.
That makes it useful for agencies that want an always-on internal readout of paid media performance, lead flow, or support metrics. It is a strong operational monitor when the goal is fast status checks instead of presentation-heavy reporting.
What to consider
Geckoboard does not go far on white-labeling or advanced client presentation. If your clients expect branded reporting with custom domains and full report design control, the platform will feel limited. Agencies that need polished client-facing delivery usually need a different tool.
For internal KPI tracking, it does the job well. For agencies that need something clients can open, review, and share without extra explanation, the fit is weaker.
10. Geckoboard
Geckoboard is the right comparison if your agency wants live KPI visibility more than client report production. It's designed for internal monitoring, office screens, Slack snapshots, and quick performance reads, not polished multi-page client deliverables. That distinction matters.
Independent comparison material describes Geckoboard with 90+ data sources and live refresh, and another 2026 comparison places it from about $35/month. The market contrast is useful here. Databox now starts at about $159/month in one industry comparison, while Geckoboard sits closer to team visibility than client reporting.
Where it shines
Geckoboard is fast for live KPI dashboards. Shareable links, TV rotation, Slack, Teams, and email snapshots make it easy to keep the team aware of what matters. Unlimited viewers on paid tiers also helps when a lot of people need visibility but not edit access.
That makes it useful for agencies that want an always-on internal readout of paid media performance, lead flow, or support metrics. It's a strong operational monitor.
Where it falls short for agencies
It is not built for deep white-labeling or advanced client presentation. If your clients expect branded reporting with custom domains and full report design control, Geckoboard can feel too limited. It's better as an internal wallboard than a client-facing reporting system.
For agency ops teams, that's the core decision. If you need to keep the team aligned on live numbers, Geckoboard works. If you need polished recurring reporting for clients, it's the wrong category. Visit Geckoboard if your main use case is internal KPI visibility rather than external reporting.
Top 10 Databox Alternatives: Core Features Comparison
| Product | Core features | UX / Quality (★) | Value & Pricing (💰) | Target audience (👥) | Unique selling points (✨/🏆) |
|---|---|---|---|---|---|
| Oviond 🏆 | 60+ connectors, live dashboards, drag‑drop builder, templates, AI (MCP), API | ★★★★☆ | 💰 Starts $39/mo (annual) for up to 5 clients; scales by client; unlimited dashboards & users | 👥 Marketing agencies & in‑house teams | ✨ Full white‑label (custom domains & email), AI-assisted reports, unlimited team users, migration & human support 🏆 |
| AgencyAnalytics | 85+ integrations, unified dashboards, client portal, SEO add‑ons | ★★★★ | 💰 Per‑client pricing; predictable tiers; add‑ons extra | 👥 Agencies wanting per‑client billing & SEO tooling | ✨ Strong SEO add‑ons, roll‑up reporting, mature agency focus |
| Whatagraph | Template‑driven visual reports, AI summaries, enterprise connectors | ★★★★ | 💰 Tiered (EUR); advanced connectors gated to higher tiers | 👥 Multi‑brand teams & client‑facing reporting | ✨ Highly visual templates, AI summaries, enterprise connectors |
| DashThis | Prebuilt templates, calculated widgets, white‑label on mid/high tiers | ★★★★ | 💰 Dashboard‑based pricing; entry plan caps sources/dashboards | 👥 Agencies needing fast deployment & simple dashboards | ✨ Quick setup, transparent source limits, useful templates |
| Swydo | Unlimited reports/users, goals/alerts, pricing by active data sources | ★★★★ | 💰 Base fee + per‑source pricing; cost‑efficient for few‑source clients | 👥 Agencies managing many clients with few platforms | ✨ Per‑source pricing model, Google Sheets import, AI summaries |
| NinjaCat | White‑label, roll‑ups, governed data layer, presentation templating | ★★★★ | 💰 Custom enterprise pricing (higher entry) | 👥 Enterprise/multi‑location agencies & media groups | ✨ Robust roll‑ups, data governance, presentation‑ready templating |
| TapClicks | 250+ connectors, SmartReports/SmartStory, AI narratives, workflows | ★★★★ | 💰 Custom pricing via sales; built for scale | 👥 Large agencies, media companies & franchises | ✨ One‑click executive decks, AI agents, broad connector coverage |
| Klipfolio (Klips) | 200+ connections, advanced formulas, SQL/Sheets/REST support | ★★★★ | 💰 Mid‑range; DIY build model, good value vs heavy BI | 👥 Technical teams, spreadsheet/SQL users | ✨ Deep customization, developer‑friendly connectors & formulas |
| Google Looker Studio | Google connectors, interactive shareable dashboards, template gallery | ★★★★ | 💰 Core product is free; Looker Studio Pro via Google Cloud (paid) | 👥 Teams wanting low cost + Google ecosystem integration | ✨ Free core, huge template/connector marketplace, GA4/BigQuery native |
| Geckoboard | Real‑time KPI wallboards, TV rotation, Slack/Teams snapshots | ★★★★ | 💰 Simple pricing; focused on internal visibility | 👥 Ops, sales & support teams needing live KPIs | ✨ Real‑time dashboards, TV/display & snapshot sharing for teams |
How to Choose the Right Reporting Tool for Your Agency
The best databox alternative is the one that fits your agency's actual workflow, not the one with the longest feature list. Start by mapping the platforms you report on most often, then match that against the tool's connector coverage and how stable those connectors feel in practice. If you mostly live in Google, Looker Studio may still be enough. If your client base spans many channels, the reporting layer has to do more than show charts.
Pricing needs the same kind of reality check. Databox's reported starting point of $159/month, plus extra charges for data sources and a separate white-label add-on in 2026 comparisons, is a good reminder to look at total cost, not just the entry price. Compare that with tools that bundle white-labeling, unlimited users, and client-based or source-based pricing into one plan, because agencies don't scale cleanly by seat count.
White-labeling is another priority for most agency teams. A logo alone isn't enough if your client-facing dashboards still feel like vendor software. If you need branded dashboards, custom domains, custom email senders, and automated delivery, tools like Oviond, AgencyAnalytics, Whatagraph, and Swydo deserve serious attention.
Also test the workflow, not just the demo. Build one real client report, check the connector behavior, send it to yourself, and see how long it takes to reproduce for the second client. That second build tells you more about scalability than any sales deck will.
For most marketing agencies, Oviond is the clearest fit when the goal is simple, professional, white-label client reporting that scales without seat fees or add-on clutter. It brings together branded dashboards, scheduled delivery, unlimited users, and AI-assisted setup in one plan, which is exactly the kind of operational simplicity agencies need when the roster starts growing. If you're tired of rebuilding reports by hand, this is the point where switching starts to make sense.
If your agency wants client reporting that feels clean, branded, and easy to scale, take a look at Oviond. It brings white-label dashboards, automated delivery, and agency-friendly pricing into one workflow, so your team can spend less time rebuilding reports and more time serving clients.
Related articles
Simplify marketing reporting today
Stop juggling multiple tools. Start presenting clear, automated reports your clients will love