
Oviond Blog
Whatagraph Alternative: 10 Reporting Tools for Agencies
Discover 10 top whatagraph alternative platforms that simplify agency client reporting with white-label dashboards, live data, and automated delivery.

You're in the middle of monthly reporting chaos right now. One client wants paid media numbers in a branded PDF, another wants a live dashboard, and someone on your team is still exporting screenshots from three platforms because the Looker Studio file broke again. If you're looking for a Whatagraph alternative that fits agency work, not just pretty slides, this list is for you.
The issue isn't dashboards. It's the grind around them, scattered data, manual updates, inconsistent branding, and reporting that gets harder every time you add a new client. For agencies managing 5 to 50+ clients, the wrong tool turns reporting into a recurring fire drill. The right one gives you white-label client reporting, automated delivery, and a setup your account managers can keep up with.
Below, you'll get 10 tools agencies use instead of Whatagraph, with Oviond front and center as the simpler, agency-native choice. The focus here is practical fit, not feature theater. If your team wants branded dashboards, custom domain support, unlimited reports, and a pricing model tied to client count, start with Oviond and work down the list from there.
Backlink: Dooza alternatives
Table of Contents
- 1. Oviond
- 2. AgencyAnalytics
- 3. DashThis
- 4. Databox
- 5. Swydo
- 6. Klipfolio
- 7. NinjaCat
- 8. TapClicks
- 9. Supermetrics
- 10. Looker Studio and Looker Studio Pro
- Top 10 Whatagraph Alternatives Comparison
- Taking Your Reporting to the Next Level
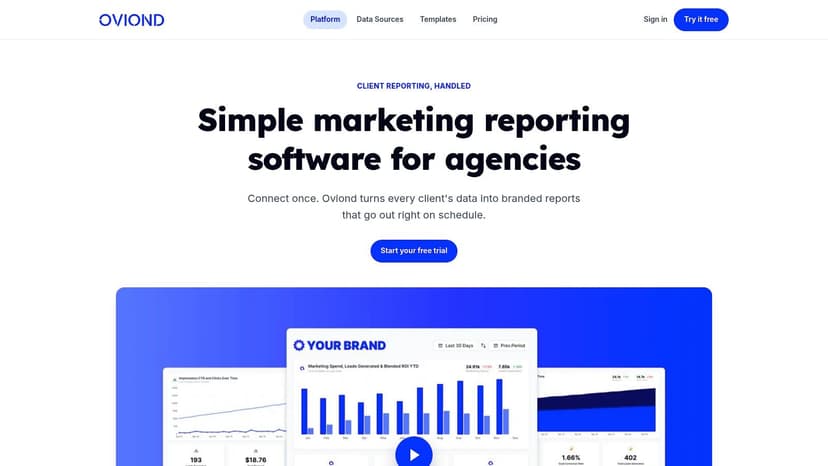
1. Oviond
Oviond is the cleanest fit if your agency is tired of stitching together spreadsheets, connector tools, and half-finished reports. It's built for white-label client reporting from day one, with custom domains, custom email senders, logos, and styling so the final output looks like it came straight from your agency. That matters when you're sending recurring reports across multiple clients and don't want vendor branding getting in the way.
It also gives agencies the practical stuff they need to scale. Oviond supports 60+ data sources across analytics, ads, social, email, CRM, e-commerce, and Google Sheets, and it includes unlimited live dashboards and unlimited reports in one plan. For agency ops teams, that combination cuts down on seat management, report sprawl, and the usual “which plan covers which client?” guessing game. The dashboard and reporting software overview shows how the platform is structured around reusable assets, scheduled delivery, and drag-and-drop setup.
Practical rule: if your team still rebuilds the same monthly report for every client, you need automation and reusable templates before you need another visualization tool.
Oviond's pricing model is also built for agencies, not one-off users. The plan starts at $39/month billed annually for up to five clients, or $49 month-to-month, and pricing scales by client count rather than by endless add-on surprises. It also includes full API access, calculated metrics, goals, and MCP-ready AI support for assistants like Claude and ChatGPT, which makes it easier to standardize reporting across a growing book of business.
The best part is the operational fit. Oviond is the kind of tool you pick when you want agency reporting that finally feels simple. If your team manages recurring reporting for a few dozen clients, wants branded dashboards and automated delivery, and doesn't want to bolt together five different systems, this is the first platform to look at.
Migration note: if you're moving from spreadsheets or Looker Studio, start by rebuilding one recurring client pack, then replicate the template across similar accounts. That keeps the switch manageable and shows the team where the time savings come from.
Pros
- True white-label delivery with custom domains and custom email senders on every plan.
- 60+ data sources with support for analytics, ads, social, email, CRM, e-commerce, and Google Sheets.
- Unlimited reports and dashboards keep scaling simple as client volume grows.
- AI-assisted setup and summaries help teams move faster without adding developer work.
- Agency-friendly pricing starts at $39/month billed annually and scales by client count.
Cons
- Occasional integration disconnects can require manual reconnection for critical feeds.
- Learning curve can be real for first-time users who want something ultra-minimal.
Website: Oviond
2. AgencyAnalytics
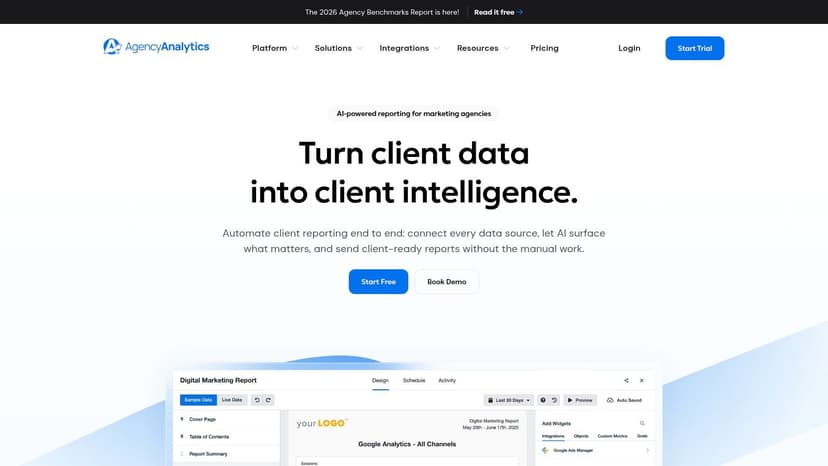
AgencyAnalytics fits agencies that want client reporting in one place and care about presentation as much as delivery. It works well for SEO, PPC, and multi-channel account teams that need dashboards, reports, and client portal workflows without stitching together a separate stack. Oviond gives you more flexibility in how you shape the process, while AgencyAnalytics gives you a more guided setup that is easier to standardize across accounts. For agencies with 5 to 50+ clients, that trade-off matters.
If your team wants a well-integrated white-label setup, AgencyAnalytics has the pieces agencies usually ask for. The platform offers 85+ integrations, white-label portals, custom domains, custom email senders, scheduled reports, goals, alerts, anomaly detection, and API access. That mix works for agencies that need dependable delivery and do not want to manage seats every time another account manager needs access. The pricing cue in the brief is $25/client/month, so you can map spend directly to client count instead of guessing at a flat platform fee.
For teams comparing Whatagraph alternative options, AgencyAnalytics belongs in the same shortlist because it balances client-facing polish with enough operational control to keep recurring reporting on schedule. It is a better fit than a pure BI tool for agencies that want reports sent on time without building every dashboard from scratch.
Migration note: agencies moving from Whatagraph usually keep the report structure but rebuild the client experience. Start with your most common dashboard layout, then lock down naming, alerts, and delivery rules before rolling it out across similar accounts.
The cost can climb if you keep adding extras. Rank tracking, AI tracker, and database connectors can increase the total as your workflow grows. That does not weaken the platform. It just means you should separate the features you use every day from the add-ons you only need for a few clients.
For agencies that want a practical reporting stack, the platform becomes a logical choice. If your clients mostly need marketing dashboards, scheduled updates, and a clean portal, AgencyAnalytics is a direct fit. If your reporting depends on heavier warehouse modeling, Oviond is the better place to stay.
Pros
- Strong white-label client portal with custom domains and sender options.
- 85+ integrations cover most agency reporting stacks.
- Unlimited users reduce seat-management friction.
- Per-client pricing is easy to match to agency growth.
Cons
- Add-ons can raise total cost as your workflow gets more complex.
- Best for marketing data, not deep warehouse or BI modeling.
Website: AgencyAnalytics
3. DashThis
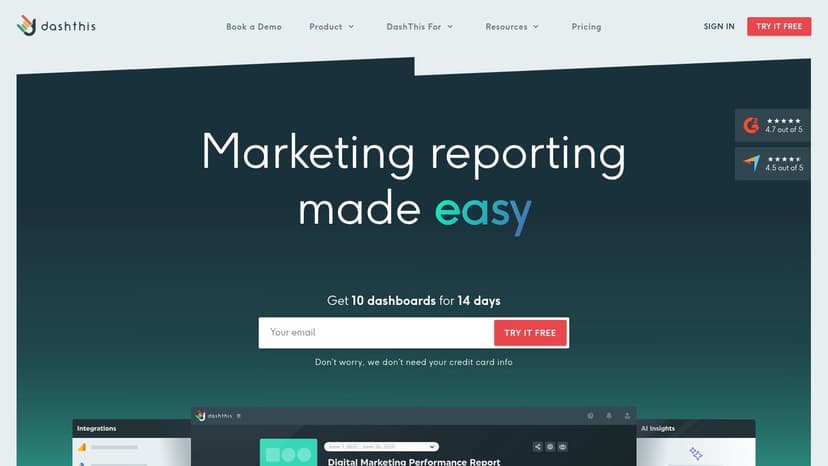
DashThis is the cleaner choice for agencies that need reporting out the door fast and do not want to spend half a week training the team. It is built around straightforward dashboards, scheduled reports, and template-driven setup, so account managers can keep moving without constant support from ops. For agencies under pressure to hit monthly delivery deadlines, that matters more than clever extras.
The comparison data in the brief gives DashThis a useful benchmark. Whatagraph connects to 60+ data sources, while DashThis is positioned with 85+ integrations and a client-friendly white-label setup. The point is not to win an integration numbers contest. The point is to get enough client data into one place without turning every build into a custom project.
DashThis also keeps collaboration simple. Unlimited users on every tier mean you do not have to manage seats every time a strategist, analyst, or account manager needs access. That helps agencies with growing teams and 5 to 50+ client portfolios keep access organized without adding admin work. The trade-off is source management. As the portfolio grows and each account brings more channels, you need a clear naming system, template rules, and a repeatable handoff process.
If your agency needs a practical way to standardize recurring reporting, start with your most common dashboard layout, then lock down delivery rules and reuse it across similar accounts. Keep the report structure consistent and only customize the sections that change by client. For a useful framework on that discipline, see reporting best practices.
DashThis fits agencies that want branded reporting without the overhead of a technical stack. It is built to produce dashboards quickly, not to act as a warehouse layer. If your team mainly needs client updates, scheduled summaries, and a polished portal, that is a sensible trade-off. If your reporting depends on deeper modeling or more complex data shaping, Oviond is the better place to stay.
Pros
- Fast setup with templates that shorten report build time.
- White-label options with custom domains and custom email senders.
- Unlimited users on every plan.
- Clear fit for simple client updates and recurring reporting.
Cons
- Source limits per plan need active management as portfolios grow.
- Less flexible than more technical or modeling-heavy tools.
Website: DashThis
4. Databox
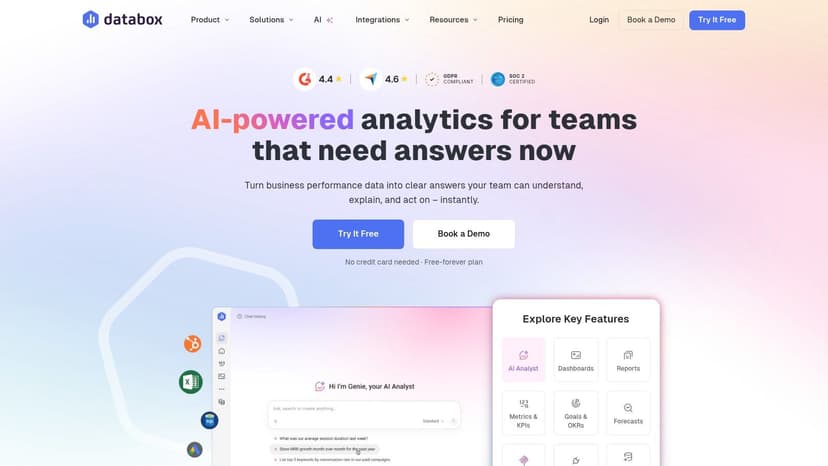
Databox fits agencies that want KPI monitoring and AI-assisted summaries more than a traditional client reporting workflow. It's the kind of tool teams use when they want performance visible during the day, not just at the end of the month. That makes it useful for internal optimization, but it can also work for client reporting if your account managers want a cleaner way to show progress and trends.
The verified comparison data gives Databox a clear place in the market. It's described with 130+ integrations, unlimited dashboards and reports on team tiers, anomaly detection, goals, AI analyst features, and a 15-minute max sync on higher plans. The key agency question is whether you want that kind of insight layer, or whether you need a more polished client delivery experience. For many agencies, Databox is strong on visibility and weaker on branded presentation compared with Oviond.
That's where the trade-off becomes obvious. Databox is useful for teams that track targets, trend lines, and summaries. Oviond is stronger when the report itself is the deliverable and you want every part of that deliverable to feel white-labeled and agency-owned.
Migration note: if you're shifting from Whatagraph because you want better insight summaries, keep your KPI definitions tight. Databox works best when the metrics are already agreed on, not when every client wants a new custom story each month.
The pricing model also matters. The source material in the brief points to unlimited users on Pro and Growth plans, which helps agencies avoid seat charges as teams grow. But white-labeling and SSO sit higher up the stack, so this is a better fit for teams willing to pay for capability rather than expecting it on the entry tier.
Pros
- AI summaries and forecasting support faster reporting commentary.
- Unlimited users on team tiers reduce collaboration friction.
- 130+ integrations cover a broad agency stack.
- Goals and anomaly detection help with performance management.
Cons
- Entry tiers can feel narrow once you start adding sources.
- White-labeling is not the default on lower plans.
Website: Databox
5. Swydo
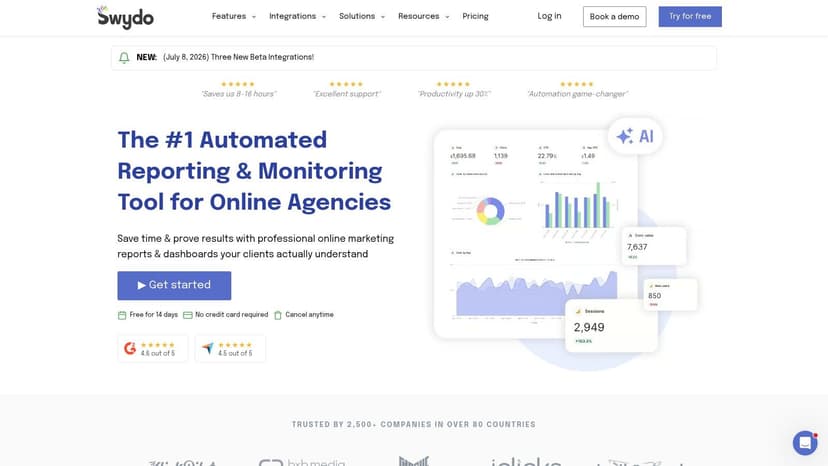
Swydo is a practical pick for agencies that want predictable reporting costs tied to data source usage, not a complicated license structure. It's built around automation, scheduling, approvals, and templated reporting, with unlimited clients and users on all plans. That makes it easier for account managers to roll out recurring delivery without worrying about user seats every time a new person joins the workflow.
The cleanest way to understand Swydo is this. If your agency wants a reporting system that stays simple as you add clients, Swydo is worth a serious look. If your accounts are heavy on multi-platform complexity, the per-source model can get expensive faster than you want. The live pricing calculator helps, but the math still matters once you manage a lot of connected accounts.
Swydo works best for agencies that care about consistency. You can standardize report structures, schedule delivery, and keep reporting operational without turning the process into a technical project. It's not trying to replace a BI layer, and that's fine. Most agencies don't need another BI layer. They need reliable client reporting that doesn't become a monthly scramble.
Practical rule: choose Swydo when your reporting model is stable, your client list grows steadily, and you want the cost structure to track data-source usage instead of headcount.
The platform's weaker spot is advanced modeling. If your team needs deeper data manipulation or more custom calculations, you'll hit the ceiling sooner than you would with a more extensible reporting stack.
Pros
- Unlimited clients and users on all plans.
- Automation and templates reduce recurring report work.
- Predictable cost structure tied to source usage.
- Pause subscription option helps seasonal agencies.
Cons
- Per-source costs can rise quickly with complex accounts.
- Less advanced modeling than BI-oriented platforms.
Website: Swydo
6. Klipfolio
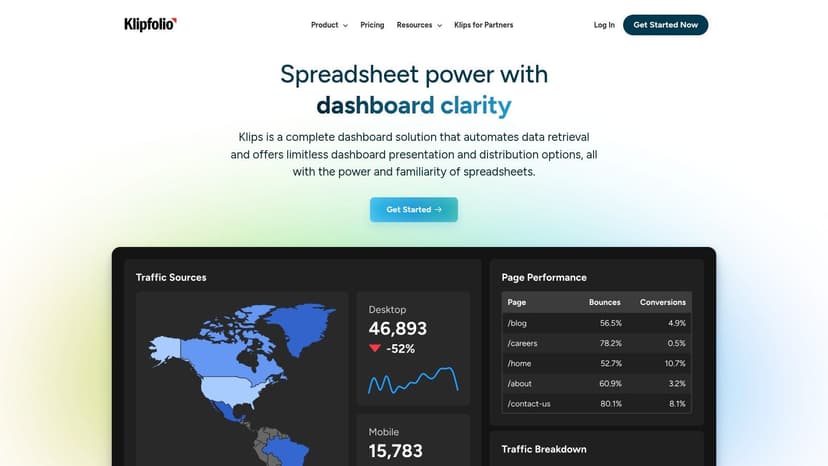
Klipfolio is for agencies that want control. Not just nice dashboards, but deep customization, formulas, and the ability to shape reporting around odd data sources and unusual client requirements. If your team is comfortable with more technical setup, it gives you a lot of room to build exactly what you want.
The verified data shows the connector depth clearly. Klipfolio is described with 200+ services and APIs supported, plus pixel-level control, custom themes, white-label capabilities, automated refresh, scheduling, and developer docs. That makes it more flexible than a lot of client-first reporting tools, but it also means the setup is more hands-on. This isn't the tool you buy when you want the shortest possible path from data source to branded PDF.
For agencies with messy stacks, though, that flexibility is useful. If you've got custom APIs, REST sources, or reports that need non-standard calculations, Klipfolio gives your ops lead more room to build a durable process. The cost is more learning, more configuration, and more internal ownership.
Migration note: when moving from Whatagraph or spreadsheets, don't try to recreate every visual on day one. Start with your most repeated client report, then layer in custom calculations once the base workflow is stable.
The public pricing reference in the brief starts at $120/month, which puts it above some of the simpler agency tools. That makes sense if you're buying flexibility, not simplicity.
Pros
- Deep customization for complex reporting needs.
- Broad connector support for APIs and custom sources.
- White-label options for agency delivery.
- Strong fit for technical teams that want control.
Cons
- More technical setup than simpler client reporting tools.
- Pricing details may require sales navigation.
Website: Klipfolio
7. NinjaCat
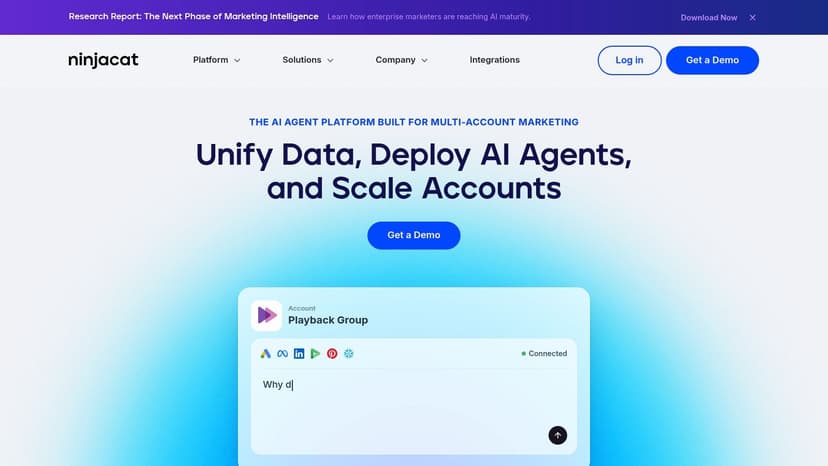
NinjaCat is a better fit for larger agencies that already feel the pain of messy, multi-account reporting. It's positioned as an enterprise-style marketing data hub with dashboards, scheduled reporting, AI-assisted insights, and multi-client organization. In plain terms, it's for teams that have moved beyond lightweight reporting and need a more structured operating layer.
The distinction becomes clear. If your agency has large portfolios, multiple brands, and a lot of moving parts, NinjaCat gives you a more mature environment than the smaller agency tools. It's less about quick setup and more about handling complexity without everything falling apart when client count rises.
The brief notes that NinjaCat has no public price list and requires a sales conversation. That's not unusual for this tier of platform, but it does mean smaller agencies shouldn't treat it as a casual upgrade. If you're under a dozen clients and mostly need branded reporting, Oviond or AgencyAnalytics is the cleaner path. If your reporting is already operationally heavy, NinjaCat belongs in the conversation.
Practical rule: pick NinjaCat when reporting has become a multi-team process, not just an account manager task.
It's also worth noting that the platform's AI work appears tied to workflow and insight generation rather than just prettier charts. That can help agencies that need more than static dashboards, especially when reporting has to scale across several brands.
Pros
- Built for large, multi-account environments.
- AI-assisted workflows help scale reporting operations.
- White-label options support client delivery.
- Mature services for complex deployments.
Cons
- No public pricing makes early comparison harder.
- Too much platform for smaller agencies with simple needs.
Website: NinjaCat
8. TapClicks
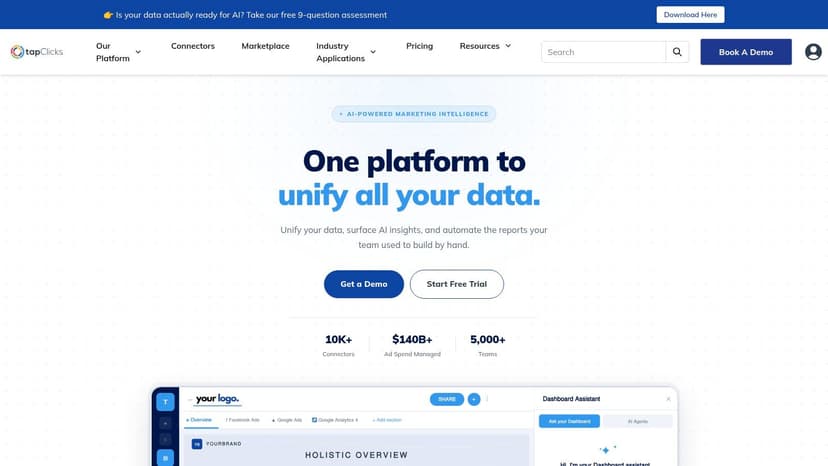
TapClicks is the broadest stack in this list, and it shows. It combines data integration, warehousing, transformation, dashboards, and client reporting into a single marketing operations suite. That makes it a strong option for larger agencies or media groups that want fewer vendors and more control over the whole reporting pipeline.
The upside is obvious. TapClicks can reduce tool sprawl because you're not just buying a dashboard, you're buying the data layer underneath it. The brief says it includes hundreds of data connectors, plus warehousing and transformation, multi-client management, scheduled reporting, automated insights, support tiers, and professional services. That's a serious stack for teams with serious reporting complexity.
The downside is just as obvious. It's a bigger commitment. Pricing is not listed publicly, and the platform may be more than a 5 to 50 client agency needs if the team just wants branded dashboards and recurring delivery. You don't buy TapClicks because you need something lighter. You buy it because reporting has become part of your broader data operations.
Migration note: if you're considering TapClicks, map your existing reporting flow from connector to final delivery before you talk to sales. That will save you from overbuying features you won't use.
For agencies that already know they need warehousing, transformation, and reporting in one place, TapClicks can be a strong step up. For everyone else, it's probably too much platform.
Pros
- Full stack approach reduces vendor sprawl.
- Hundreds of connectors support large data environments.
- Structured services and support help with complex onboarding.
- Scales well for big account portfolios.
Cons
- Pricing is not public.
- May be more complex than most agency teams need.
Website: TapClicks
9. Supermetrics
Supermetrics is not a reporting dashboard. It's a data pipeline. That distinction matters, because agencies often compare it to Whatagraph and then realize they still need a visualization layer. The tool extracts marketing data into destinations like Google Sheets, Looker Studio, Excel, BigQuery, Power BI, and Supermetrics Cloud, which makes it a strong choice when your team already has a reporting workflow and just needs broader connector coverage.
The brief is clear about the scale. Supermetrics supports 150+ data sources and 10+ destinations, which is why it keeps showing up in Whatagraph-alternative conversations. It's broad, reliable, and useful for agencies that need long-tail connectors or want to keep building reports in their preferred BI or sheet environment. The price starts from a fixed subscription tier structure, but costs can rise as source and account usage expands.
That's the catch. If you want the fastest route to a client-ready, branded report, Supermetrics is not enough on its own. If you want control over data extraction and already have a reporting layer, it's very useful. This is a strong backend choice, not a client-facing reporting system.
Practical rule: choose Supermetrics when your agency has already committed to Looker Studio, Sheets, or Power BI, and you just need dependable pipelines feeding that stack.
For agencies comparing a Whatagraph alternative against a data-stack approach, this is the clearest split in the market. Supermetrics helps you move data. Oviond helps you deliver the finished report.
Pros
- Broad connector coverage for marketing data.
- Multiple destinations support Sheets, BI tools, and warehouses.
- Works with your existing reporting layer.
- Good documentation and familiar tiering.
Cons
- Not a reporting platform by itself.
- Costs can rise as source count grows.
Website: Supermetrics
10. Looker Studio and Looker Studio Pro
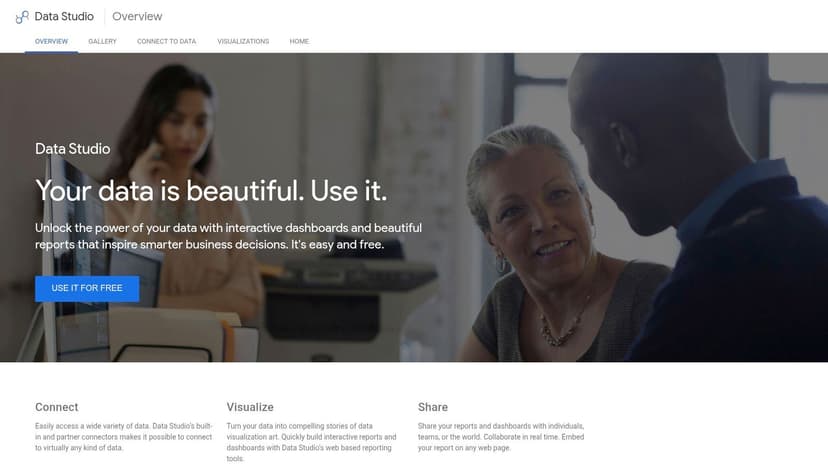
Looker Studio is the default starting point for a lot of agencies because it's familiar, flexible, and free at the core. If your team already lives in the Google stack, it connects naturally to Google Ads, GA4, Sheets, and BigQuery. That makes it a decent foundation for agencies that don't mind building reports manually and maintaining them over time.
The problem is the same one most agencies run into. It's easy to start, but messy to scale. Many non-Google connectors require paid third-party tools, and the Pro tier adds governance and support, but it can be hard to estimate cost cleanly. The Google Looker Studio guide for digital marketers is a useful reminder that free doesn't mean low-maintenance.
For smaller teams, Looker Studio can still work. For agencies managing recurring reporting across many clients, it often becomes a patchwork of connectors, permissions, and template upkeep. That's why it stays on the list, but not near the top if your goal is polished white-label delivery with less operational drag.
Practical rule: use Looker Studio when your team wants control and already knows how to maintain the build. Use a client-reporting platform when you want less hand-holding and more consistency.
The biggest value here is freedom, not polish. If you want a free core tool and your reports are tied heavily to Google data, it's a reasonable choice. If you want branded client reporting with simpler handoff, Oviond is the better fit.
Pros
- Free core product lowers hard costs.
- Strong Google ecosystem fit with Ads, GA4, Sheets, and BigQuery.
- Flexible dashboard design for teams that like control.
- Large connector ecosystem through partners.
Cons
- Many connectors need paid add-ons.
- Maintenance burden grows as client count rises.
Website: Looker Studio
Top 10 Whatagraph Alternatives Comparison
| Platform | Key features | UX / Quality (★) | Pricing / Value (💰) | Target audience (👥) | Unique selling points (✨) |
|---|---|---|---|---|---|
| 🏆 Oviond | 60+ connectors, unlimited dashboards/reports, drag‑drop, white‑label, AI & API | ★★★★☆ live data, templates, human support | 💰 Starts $39/mo (annual, up to 5 clients); per‑client scale | 👥 Agencies & in‑house teams needing white‑label scale | ✨ AI-assisted report creation, true white‑label (custom domains/email), migration help |
| AgencyAnalytics | 85+ integrations, white‑label portals, automations, unlimited users | ★★★★☆ strong client portals & automation | 💰 Per‑client pricing; predictable but add‑ons raise cost | 👥 Agencies managing many clients wanting per‑client billing | ✨ Client portals, predictable per‑client billing, robust white‑label |
| DashThis | Templates, source blending, white‑label, unlimited users | ★★★★☆ quick setup, template-driven | 💰 Dashboards/sources pricing; mid‑market | 👥 Agencies needing fast, template-based reports | ✨ Rapid templates + simple white‑label setup |
| Databox | 130+ integrations, AI analyst, forecasting, goals | ★★★★☆ AI summaries & forecasting strengths | 💰 Flexible tiers; entry has few sources, add-ons possible | 👥 KPI-driven teams wanting AI insights & forecasts | ✨ Built-in AI analyst (Genie), forecasting & templates |
| Swydo | Automations, unlimited clients/users, reporting templates | ★★★☆☆ straightforward automation | 💰 Per‑source pricing; cost tied to connectors | 👥 Agencies preferring source‑based billing | ✨ Live pricing calculator, pause subscriptions option |
| Klipfolio | APIs/SQL, pixel control, custom themes, 200+ services | ★★★★☆ powerful but technical (formula-heavy) | 💰 Public reference from ~$120/mo; enterprise tiers | 👥 Teams needing deep customization & developer control | ✨ Spreadsheet-like formulas, pixel-level visual control |
| NinjaCat | Centralized hub, AI workflows, multi-account mgmt | ★★★★☆ enterprise-focused, scalable | 💰 Custom pricing (sales) | 👥 Large agencies & brands with complex, multi-account needs | ✨ Enterprise multi-brand management + AI workflows |
| TapClicks | Connectors + warehousing + ETL + dashboards (full stack) | ★★★★☆ full-stack for complex ops | 💰 Custom pricing; aimed at enterprise | 👥 Large agencies/media groups needing full marketing stack | ✨ End‑to‑end (connect → store → transform → visualize) |
| Supermetrics | Connector-first: Sheets/Looker/BigQuery/Excel connectors | ★★★★☆ best-in-class connector reliability | 💰 Tiered by destination & sources; costs grow with scale | 👥 Teams who prefer own BI/Sheets & need broad connectors | ✨ Broadest connector coverage; preserves preferred viz layer |
| Looker Studio (Pro) | Interactive dashboards, Google Ads/GA4/BigQuery native | ★★★☆☆ familiar UI; relies on connectors for non‑Google data | 💰 Free core; Pro adds enterprise pricing per user/project | 👥 Google stack users & cost-sensitive teams | ✨ Free core product + tight Google ecosystem integration |
Taking Your Reporting to the Next Level
If your agency is still living inside spreadsheets, PDFs, or a patched-together Looker Studio setup, the fix is not another round of manual cleanup. You need a reporting system that matches how agencies work, with live data, white-label delivery, and a setup your team can repeat across every client without rebuilding from scratch.
For small and mid-sized agencies, Oviond is the clearest starting point. It gives you white-label client reporting, custom domains, unlimited reports, unlimited dashboards, unlimited team users, and pricing that scales by client count instead of punishing you for growth. That combination makes it the most straightforward option for teams that want branded reporting without spreadsheet chaos or tool sprawl.
If your agency needs more structure around SEO and client portals, AgencyAnalytics is a strong alternative. If you want simple dashboards with fast rollout, DashThis is easy to live with. If your team cares more about KPI tracking and AI summaries, Databox belongs on the shortlist. And if your reporting stack is already built around pipelines and external BI tools, Supermetrics or Looker Studio can still work, but only if you're ready to own the maintenance.
The decision is simple. If you want a reporting layer that feels agency-native and is built for recurring client work, start with Oviond. If you want to keep patching together tools, you can do that too, but you'll keep paying for it in time, consistency, and client-facing polish.
Start a free Oviond trial, connect one client, build one branded report, and see how much cleaner your reporting workflow feels when it's finally built for agencies instead of forcing agencies to adapt to it.
A CTA for Oviond.
Related articles
Simplify marketing reporting today
Stop juggling multiple tools. Start presenting clear, automated reports your clients will love