
Oviond Blog
Data and Measurement for Agencies: Master Reporting Guide
Master data and measurement for multi-client agency reporting. Learn KPI frameworks, governance, attribution, and automate white-label dashboards.

You know the feeling. A client pings at 4:47 p.m. asking why last month's leads don't match this month's dashboard, and your team is staring at 15 tabs, a broken Looker Studio link, and a spreadsheet somebody swore was the “final” version. That isn't a reporting problem. It's a data and measurement problem, and for agencies, it shows up as friction, mistrust, and too much manual cleanup.
The agencies that stay sane past a handful of clients stop treating reporting like a file-sharing task. They build rules for what each metric means, where it comes from, and how it gets checked before it reaches a client. That discipline is what turns raw platform output into a report you can defend, month after month. If you want a useful adjacent read on channel-specific reporting, the ultimate guide to e-commerce metrics is a solid companion, especially if you're trying to translate noisy platform data into something clients can act on.
Table of Contents
- Why Agency Reporting Breaks Without a Measurement System
- The Three Steps of Measurement Every Agency Should Follow
- Channel-Specific KPIs That Actually Matter to Clients
- Building a Measurement Plan and Choosing Attribution
- Common Data and Measurement Pitfalls Agencies Must Fix
- Comparing Reporting Platforms for Multi-Client Agencies
- Implementation Roadmap for Unified Client Reporting
- Your Next Steps to Better Agency Measurement
Why Agency Reporting Breaks Without a Measurement System
The crack usually shows up on reporting day. One account manager pulls Google Ads numbers, another grabs GA4, someone else exports CRM leads, and the final deck still doesn't match what the client saw last month. The issue isn't that the team lacks data. It's that nobody agreed on the measurement rules before the numbers got stitched together.
Raw data is not a client report
Cornell's measurement material makes the core point clearly, measurement is not just “getting numbers,” it's assigning variables to the right scale so analysis is valid, and statistics is the set of techniques for the collection, organization, analysis, interpretation, and presentation of numerically stated information (Cornell measurement and statistics PDF). In agency work, that distinction matters because a nominal field like channel or country can be counted, but not averaged, while ratio data like revenue or conversions support full arithmetic because they have a true zero.
That's why spreadsheets break down so quickly. A spreadsheet can store numbers, but it can't enforce meaning. If one client's “lead” includes form fills and another client's includes booked calls, the same column label becomes misleading fast.
Practical rule: define the metric before you build the dashboard. If the meaning is fuzzy, the report will be too.
The work gets easier when you treat reporting as measurement infrastructure, not formatting. That's also why a structured process beats a folder full of exports, and why a reporting workflow should be designed around the decision a client is trying to make. The gap between raw platform data and a defensible report is where most agencies lose time, confidence, and consistency.
Why this matters at scale
Once client count rises, inconsistency compounds. One team member rounds numbers differently, another swaps a proxy metric in without warning, and a third changes the formula in a dashboard nobody owns. The report still looks polished, but the story behind it is unstable.
A useful mental model is simple, if the same metric would lead to different decisions depending on who built it, it's not a shared metric yet. Agencies that survive scale create one source of truth for each client and one rule set for how data gets turned into a report. That's the difference between “we have dashboards” and “we have measurement.”
The Three Steps of Measurement Every Agency Should Follow
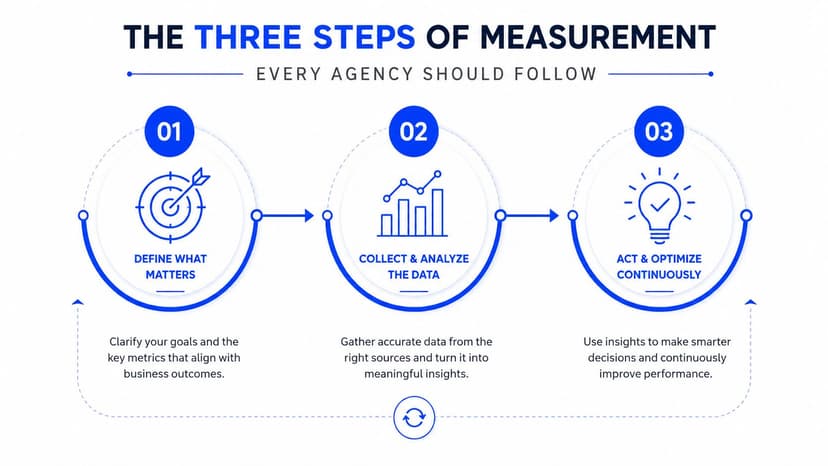
Measurement has three explicit steps, conceptualization, operationalization, and validation (measurement steps source). Agencies skip the first two all the time and then wonder why the third one turns into a fire drill during client review.
Start with conceptualization
Conceptualization means deciding what you mean by the thing you want to measure. A B2B SaaS client may define a lead as a demo request that enters the CRM, while a local services client may define a lead as a phone call longer than a set threshold or a form submission that reaches the sales desk.
The same word, different business meaning. If you don't pin that down first, your dashboard will look consistent while measuring the wrong thing.
That's also where e-commerce and lead gen diverge. For an e-commerce client, conversion usually means purchase. For a lead-gen client, it may mean qualified form submissions, booked appointments, or CRM opportunities. The concept comes first, the metric comes second.
Turn the concept into a number
Operationalization is where the concept becomes something queryable in GA4, Google Ads, Meta, or a CRM. A Google Ads click might be just a click for one report, but it may also be part of a funnel view, a landing page quality check, or a cost-per-lead calculation depending on the client's objective. The platform didn't change, the measurement choice did.
The report should answer a business question, not just mirror platform labels.
Agency teams get disciplined. They decide which system owns the number, what counts as a valid event, and what gets excluded. If the source data doesn't match the concept, the number is decorative, not useful.
Validate before the client does
Validation is the check that the metric reflects what it was supposed to measure. A practical way to work through any KPI request is to ask three questions: how was it measured, does it measure what it claims, and how do we know (measurement validation guidance). That checklist is especially useful when a client asks for a metric nobody defined at kickoff.
For agencies, the win is repeatability. Once a KPI passes these three steps, it can move into a template, a dashboard, and a recurring report without being re-litigated every month.
Channel-Specific KPIs That Actually Matter to Clients
Clients don't need every column from every platform. They need a small set of metrics that help them decide where to spend, what to fix, and what to ignore. That's where measurement scale matters, because statistical summaries only make sense when the metric definition matches the scale, nominal, ordinal, interval, or ratio (University of Michigan measurement notes).
Focus the KPI set by funnel stage
A clean agency report usually separates top of funnel, mid funnel, and bottom of funnel instead of dumping every available metric into one list. The right KPIs differ by channel and by business model, so the goal is not completeness, it's decision usefulness.
| Channel | Top of Funnel | Mid Funnel | Bottom of Funnel |
|---|---|---|---|
| Paid Search | Impressions, clicks | Landing page engagement, engaged sessions | Conversions, cost per conversion |
| Paid Social | Reach, video views, link clicks | Site visits, add-to-cart or lead-start events | Purchases, qualified leads |
| Organic Search | Impressions, clicks from search | Landing page engagement | Leads or revenue tied to organic traffic |
| Opens, clicks | Site visits, content engagement | Purchases, booked calls, CRM opportunities | |
| CRM | New contacts, segment counts | MQLs, SQLs, opportunity stages | Closed-won, pipeline value |
The point of a table like this isn't to freeze every client into the same format. It's to keep the report tied to the decision. If a metric won't change budget allocation, creative, or targeting, it probably doesn't need a permanent place in the deck.
Use calculated metrics carefully
Some of the most useful agency metrics are built by blending data across sources, then adding custom logic around cost, pipeline, or goal progress. That can be powerful, but only if the inputs are consistent. If one platform labels a conversion differently than another, the calculation inherits that ambiguity.
That's why the report should separate raw metrics from calculated ones. The raw numbers show what happened. The calculated metrics show how the agency wants the client to interpret it.
Don't report everything that exists
Inside the report, use a short list of KPIs that map to the client's funnel stage and business model. The KPI-versus-metric guidance is useful here, because it helps teams decide which figures deserve client-facing visibility and which ones should stay in the working layer.
A report that names fewer metrics, but defines them better, is easier to trust and easier to scale across more clients.
Building a Measurement Plan and Choosing Attribution
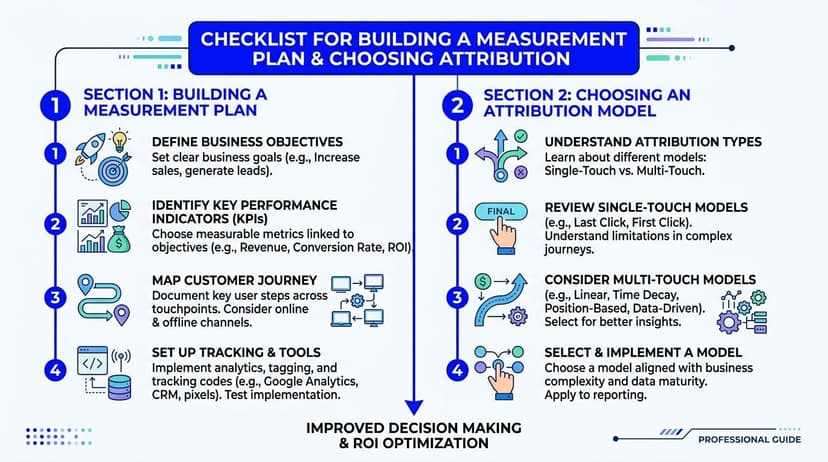
A measurement plan keeps an agency from improvising every time a client changes direction. It names the objective, the data source, the reporting cadence, and the person who owns the decision when the metric moves. Without that document, attribution debates take over the meeting.
Build the plan around decisions
A useful measurement plan usually includes six things, business objectives, key questions, data sources, metric definitions, reporting cadence, and decision owners. That structure keeps the team focused on what the client is trying to do, not just what the platform can export.
If the objective is pipeline growth, the plan should say which CRM stage counts, which source is authoritative, and who acts when the metric underperforms. If the objective is e-commerce revenue, the plan should tie the report to purchase data and explain whether refunds, discounts, or ad-platform conversion windows are part of the definition.
Agency rule: if two people can read the KPI differently, the measurement plan isn't done yet.
The plan also gives your team a clean handoff. Account managers can explain the number without guessing, and ops can update the template without rebuilding the logic from scratch.
Choose attribution with the client's patience in mind
Most clients default to last-click because it's easy to understand and easy to defend in a meeting. That doesn't make it perfect, but it does make it practical when the client wants a simple answer and the team needs consistency month over month.
Multi-touch models can be more informative, especially when a client has longer buying cycles or multiple high-intent touchpoints. The trade-off is complexity. If the client won't use the extra detail to make a different decision, the model may just create confusion.
The best move is to document the attribution model in the plan and keep it stable until there's a real reason to change it. That prevents “why did the numbers move?” conversations that are really just model changes in disguise.
White-label the logic, not just the layout
Your measurement plan should be reusable across clients, but not copy-pasted blindly. Keep the structure the same, then swap in the client-specific definitions. That's what lets an agency scale reporting without turning every dashboard into a one-off project.
A good plan is boring in the best way. It makes the report predictable, the team faster, and the client conversation calmer.
Common Data and Measurement Pitfalls Agencies Must Fix
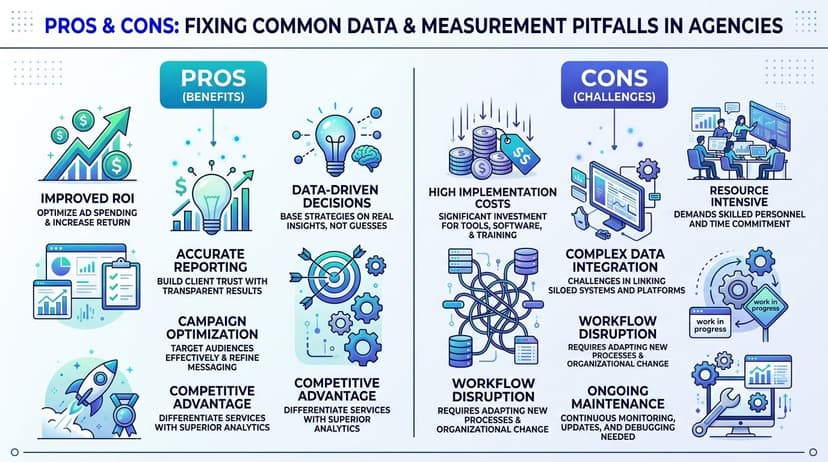
Most reporting failures aren't dramatic. They're small, repeatable mistakes that keep showing up until the client notices that the numbers don't line up. The biggest one is trusting indirect metrics too much, especially when direct collection is available but ignored. Guidance from the NCBI is blunt, proxy measures are less accurate than direct collection and should be treated as second-best, not interchangeable with true measurements (NCBI measurement guidance).
Proxy data is useful, but not equal
Agencies use proxies all the time. A partial CRM export, a platform estimate, or a modeled audience segment can still support planning when direct data isn't available. The mistake is presenting those numbers as if they carry the same confidence as directly measured data.
If you need a source that helps teams evaluate startup and market data more carefully, Webclaw's analytics resource for startup data is a practical example of how raw information gets turned into something more usable. The lesson is the same for agencies, label indirect data as indirect, and keep the uncertainty visible.
Calibration problems hide behind polished dashboards
A dashboard can look precise while the input pipeline is drifting. Measurement quality depends on calibration, meaning a known input is applied and the output is checked against it so the input-output relationship is reliable (Wiley excerpt on calibration). If the source changes, the report can still render cleanly while the underlying signal shifts.
That's what breaks trust in agency reporting. A tracking change, API update, or mislabeled event doesn't always throw an error. It just alters the story.
Clean visuals do not prove clean data.
Dashboard sprawl creates contradictions
Another common failure is report sprawl. One client has a monthly deck, a live dashboard, a social report, a paid media snapshot, and a “working” spreadsheet that all tell slightly different stories. Nobody owns the definitions, so every file becomes a competing version of the truth.
The fix is governance. Pick one authoritative source for each KPI, document who can change it, and retire duplicate views that don't add a decision. The data quality issues guide is worth keeping handy if your team needs a practical way to audit conflicting numbers before a client call.
Don't overclaim from descriptive summaries
Descriptive statistics tell you what the observed data show, while inferential work is about what might hold for a larger population (LibreTexts statistics basics/01:_Introduction_to_Statistics/1.01:_Basic_Definitions_and_Concepts)). Agencies often blur that line and start explaining why a campaign changed based on a small slice of data that only describes the slice itself.
The safe habit is simple. Report what you can support, label what is inferred, and keep the client-facing story narrower than the raw spreadsheet.
Comparing Reporting Platforms for Multi-Client Agencies
The right reporting platform depends on how many clients you manage, how often reports change, and how much brand control the client expects. A spreadsheet can work for a small roster, but it gets brittle fast when every client wants a different layout, custom branding, and recurring delivery. Looker Studio gives flexibility, but many agencies still run into fragile links, inconsistent styling, and manual upkeep.
Compare on agency criteria, not feature lists
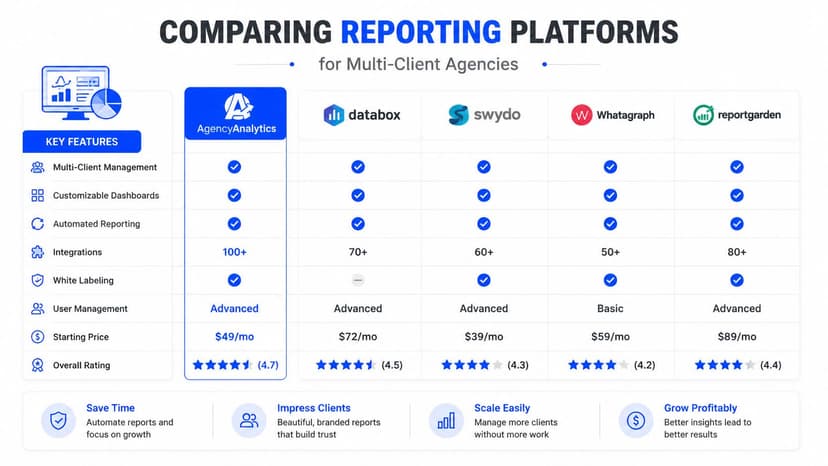
The useful comparison is not “how many charts does it have.” It's whether the platform supports white-label delivery, custom domains, recurring automation, multi-client organization, and collaboration without making every teammate a paid seat.
- Spreadsheets: flexible, familiar, and fast to start, but weak on standardization and easy to break at scale.
- Looker Studio: helpful for visualizing data, but often fragile for agencies that need strong branding and repeatable client delivery.
- AgencyAnalytics, Whatagraph, and Swydo: purpose-built for marketing reporting, each with different trade-offs in workflow, branding, and pricing.
- Oviond: consolidates performance data from analytics, paid media, search, social, email, CRM, and e-commerce into live dashboards and scheduled branded reports, supports white-label delivery, custom domains, and AI-assisted creation via an MCP server, with pricing starting from $40/month billed annually for 10 clients (Oviond product information).
What usually matters most
Agencies moving from spreadsheets to a platform usually care about the same things first, recurring delivery, branded presentation, reusable templates, and fewer moving parts. The software choice should make it easier to standardize client reporting across similar account types without making the team fight the tool every month.
If you're comparing options, the reporting platform overview gives a broader view of the available options. The useful question is still the same, which platform fits your client mix without forcing more manual work back onto the team?
Make the choice based on scale
For a small agency, a simpler setup can be enough. For a growing agency with many recurring reports, the better fit is usually the one that reduces duplication, keeps branding consistent, and lets account managers answer client questions without rebuilding dashboards from scratch.
That's the true test. If the platform lowers operational friction as client count grows, it's doing the job.
Implementation Roadmap for Unified Client Reporting
Migration works better when it's handled in phases instead of a big-bang switch. The first pass is an audit, not a redesign. You need to know which clients are creating the most reporting drag before you decide what gets rebuilt first.
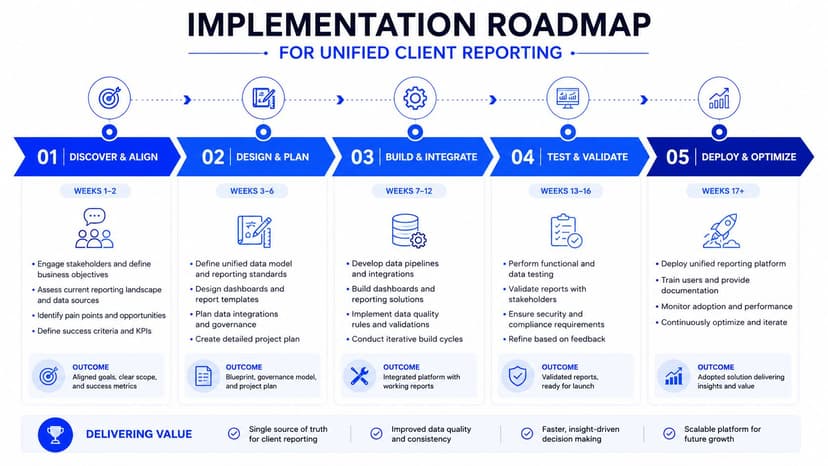
Phase 1 audit the mess
Start by listing every current data source, report format, and owner. Then identify the clients with the most complex reporting needs, because they usually reveal the structural issues hiding in simpler accounts.
This stage is about finding duplication, broken definitions, and manual steps that don't need to survive the move. If a report exists only because someone once copied it into a slide deck, it's a candidate for retirement.
Phase 2 standardize templates
Build template dashboards for your most common client types. Reusable queries, calculated metrics, and goal tracking make cloning much easier, especially when several clients share the same business model or channel mix.
A white-label platform becomes useful operationally. Once the structure is stable, account managers can keep the client-facing view consistent while ops updates the logic in one place.
Phase 3 automate delivery
Set up recurring report delivery, client-branded presentation, and always-current data refresh so no one is chasing the latest export. Once the delivery system is predictable, the team stops burning time on version control and email follow-ups.
At this point, the report should feel like a service, not a monthly project. That's the change clients notice first.
Phase 4 train the team
Unlimited users matter here because reporting systems fail when only one person knows how they work. Build naming conventions, define who can edit shared templates, and write down the rules for what changes require review.
A dashboard only scales when more than one person can safely maintain it.
If you're using a unified reporting system, a platform like Oviond is built around that style of workflow, with client-count pricing, unlimited reports and dashboards, and team access designed for agency collaboration. The operational benefit isn't flash, it's fewer handoffs and fewer places for reporting to break.
Your Next Steps to Better Agency Measurement
Most agencies don't need more data. They need a cleaner way to decide what the data means, how it should be measured, and who owns the numbers when a client asks hard questions. That starts with the three-step process, conceptualization, operationalization, validation, then moves into channel-specific KPIs, a written measurement plan, and a reporting stack that doesn't fall apart when client count rises.
The fastest win is not a total rebuild. Pick one client, audit the current setup against this framework, and replace one manual report with a dashboard that has clear definitions and one source of truth. If that pilot is easier to maintain, easier to explain, and easier to trust, you've got a repeatable pattern for the rest of the roster.
Agency reporting that finally feels simple comes from treating measurement like infrastructure. Build it once, govern it well, and let it scale with the business instead of fighting it every month.
If your agency is still stitching together reports from spreadsheets, Looker Studio, and scattered platform exports, Oviond can pull that workflow into one white-label system built for multi-client reporting. Visit Oviond to see how live dashboards, branded delivery, and template-driven setup can make agency reporting simpler to run and easier to defend.
Related articles
Simplify marketing reporting today
Stop juggling multiple tools. Start presenting clear, automated reports your clients will love