
Oviond Blog
Fixing Data Quality Issues in Agency Client Reporting
Tired of messy reports? Learn to spot, fix, and prevent common data quality issues in your agency's client reporting workflow with this practical guide.

By the last week of the month, most agencies are running the same routine. Someone exports numbers from Google Ads. Someone else checks Meta. GA4 says one thing, the CRM says another, and the report still has to go out with the client's logo on it by tomorrow morning.
That's when data quality issues stop feeling like a technical topic and start feeling like an account management problem. The numbers don't line up, the team wastes time chasing the mismatch, and the client sees hesitation instead of confidence. In a multi-client agency workflow, that pressure stacks up fast.
The hard part is that these problems rarely come from one dramatic failure. They come from dozens of small ones. A broken naming convention. A disconnected source. A date range mismatch. A copied formula in a spreadsheet that no one noticed until the monthly review. If you're still piecing together recurring reports across spreadsheets, Looker Studio, and platform exports, the reporting process itself can create the mess you're trying to explain.
There is a cleaner way to handle it. Not by pretending every metric will be perfect, but by building a reporting system that makes errors easier to catch, easier to trace, and much less likely to reach the client.
Table of Contents
- The All-Too-Familiar Pain of Month-End Reporting
- Common Data Quality Issues in Marketing Reports
- The Hidden Costs of Inaccurate Agency Reporting
- How to Spot and Diagnose Data Issues in Your Reports
- From Manual Fixes to Automated Systems
- Your Agency's Data Quality Checklist
- Make Your Agency Reporting Feel Simple
The All-Too-Familiar Pain of Month-End Reporting
Month-end reporting usually doesn't break in one obvious place. It frays at the edges.
An account manager opens the Google Ads export and sees conversions higher than expected. GA4 shows fewer. The CRM has leads that don't match either source. Someone checks filters. Someone checks attribution settings. Someone asks whether the date range is set to the client's timezone or the platform default. Meanwhile, five other client reports are waiting in the queue.

This is normal agency life when reporting depends on too many handoffs. One team member pulls source data. Another cleans it up in Sheets. Another copies charts into a client deck or a Looker Studio view that needs constant maintenance. When you manage recurring reporting across 5 to 50+ clients, the process itself becomes a source of data quality issues.
Why clients notice faster than agencies expect
Clients don't always know where the mismatch came from. They do know when the agency sounds unsure. That's the key risk.
62% of respondents have stopped or considered stopping their collaboration with a digital marketing agency due to insufficient transparency in reporting, making clarity and accuracy the top factors clients evaluate, according to this MarTech Series coverage on agency reporting transparency.
Practical rule: If a client has to ask twice why two reports show different numbers, the problem isn't just the metric. It's the reporting system.
For agencies, reporting isn't an admin task. It's part of retention. It's how you show progress, explain setbacks, and tie channel activity back to outcomes. That's why clean reporting workflows matter just as much as campaign execution.
The scramble usually points to a system problem
When the same reporting issues keep showing up, they usually trace back to process, not effort. Teams work hard. The workflow is what breaks.
A lot of agencies start looking at reporting efficiency only after the month-end scramble becomes routine. That's usually the right moment to step back and review the process through an agency reporting efficiency lens. You can't scale client reporting if every report depends on manual detective work.
Common Data Quality Issues in Marketing Reports
Most agency reporting problems fit into a handful of patterns. Once you can name them, they become easier to fix.
The five issues that show up most often
Incomplete data is the simplest one to spot. A report has missing days, blank fields, or a channel that didn't refresh. In agency terms, that might mean a dashboard that skipped weekend spend or a lead report with form fills but no source detail.
Inaccurate data is harder because the numbers look complete, just wrong. Revenue doesn't match the client's sales system. Lead totals differ from the CRM. A campaign appears to have outperformed when the tracking setup was faulty.
Inconsistent data causes a lot of pain in PPC and cross-channel reporting. One platform uses “Paid Search,” another uses “cpc,” and a third has a custom label from a client's UTM habit six months ago. The numbers may all be valid on their own, but the roll-up is messy.
Duplicate data often sneaks in during manual imports or blended reporting. The same campaign row appears twice. A source gets connected twice. A spreadsheet tab gets appended instead of replaced.
Irrelevant data sounds less serious, but it clutters dashboards and confuses clients. Agencies often keep outdated metrics in reports long after they stop helping decisions.
Most reporting errors start with people, not platforms
A lot of technical articles miss the actual root cause. 70% of data errors are traced to manual entry and a lack of training on data standards, not system failures, according to Data Ladder's review of common data quality issues. In agency work, that shows up when clients and teams enter inconsistent campaign metadata across 50+ channels.
That's why naming conventions matter so much. If one account manager uses “Brand_US_Search” and another uses “brand search us,” your platform isn't the problem. Your standards are.
A simple internal data dictionary provides more assistance than is typically expected. It doesn't need to be fancy. It just needs to define what key fields mean, how channels should be named, what counts as a lead, and which source wins when numbers conflict.
Clean reports usually start with boring rules. Consistent naming, clear ownership, and fewer manual edits beat heroic cleanup at the end of the month.
Agency examples that make this obvious
Consider a lead-gen agency reporting on paid search, paid social, email, and CRM outcomes. The Google Ads data might be fine. Meta might also be fine. The CRM might be fine too. But if campaign names don't align, source labels are inconsistent, and form fields are optional, the final report becomes unreliable.
This gets even messier when agencies report on lifecycle metrics. If your client also wants email performance tied into acquisition reporting, even foundational activities like what is email list building need consistent tagging and source tracking, or the downstream report won't hold up.
If you manage reporting across many platforms, it helps to standardize the source layer first. A clean list of marketing data sources for agency reporting makes it easier to decide which connectors matter, which metrics are core, and where inconsistencies are likely to appear.
The Hidden Costs of Inaccurate Agency Reporting
Bad reporting costs more than a little embarrassment on a client call.
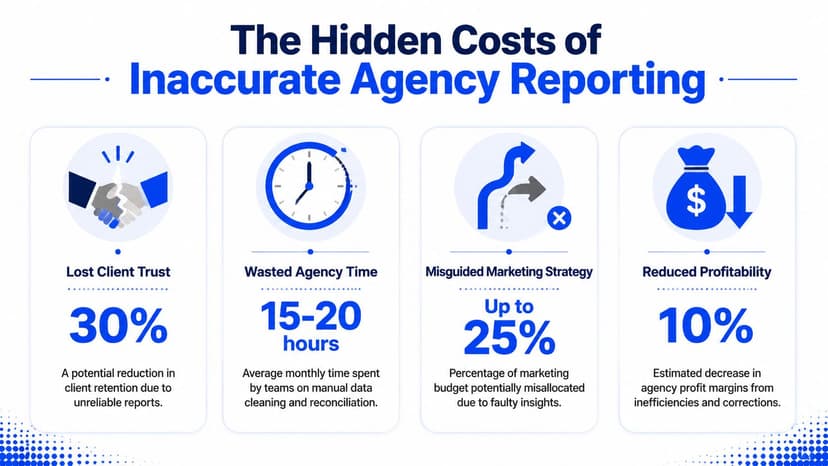
When a team doesn't trust the report, they stop using it as a decision tool. They use it as a reconciliation exercise. That means account managers spend time checking exports, comparing totals, and explaining caveats instead of spotting opportunities or preparing strategy for the next month.
At the wider business level, poor data quality has a serious financial impact. Gartner research found the average annual cost of poor data quality is $12.9 million per organization, as summarized by Integrate.io's data quality research roundup. That figure isn't agency-specific, but the message applies directly to agency operations. Data integrity isn't a side issue. It affects profitability.
The costs agencies feel first
The first cost is wasted payroll. Manual report cleanup isn't billable strategy work. It's operational rework.
The second cost is client trust. Once a client starts questioning the report, every recommendation becomes harder to sell. If the numbers feel shaky, your strategy sounds shakier too.
The third cost is scale resistance. A reporting process that works for six clients can fall apart at twenty. Agencies don't usually hit a wall because they lack reporting talent. They hit a wall because their workflow depends on too many manual checks.
Why this becomes a margin problem
Manually collecting data from fragmented sources like Google Ads, Meta, and CRMs takes 2.5 to 5 hours per report without automation, based on this agency reporting workflow discussion on LinkedIn. Even if the work gets done, that kind of manual crunching eats into margins and raises the chance of human error.
There's also a credibility issue inside the report itself. Nearly 45% of marketing data is inaccurate, incomplete, or outdated, according to inBeat's agency reporting analysis. If agencies don't validate and reconcile key figures before presenting them, clients notice.
Reports don't need to be flashy. They need to be defensible.
That's the standard that protects retention and supports growth. Agencies that treat reporting as an operational system usually scale more cleanly than agencies that keep patching reporting errors one client at a time.
How to Spot and Diagnose Data Issues in Your Reports
Most account managers don't need to become analysts. They need a repeatable way to find the break.
Start with one KPI and trace it backward
Pick one client KPI that matters. Leads is a good example. Start with the final dashboard number, then trace it back step by step.
Check the dashboard total. Then check the connected source. Then check the original platform. If the KPI is supposed to tie into a CRM, check the CRM definition too. Don't audit everything at once. Follow one number until you find where it changed.
This approach works because it forces the team to isolate the issue instead of debating the whole report. In blended reporting, that's the fastest path to the truth.
Use a short diagnostic checklist
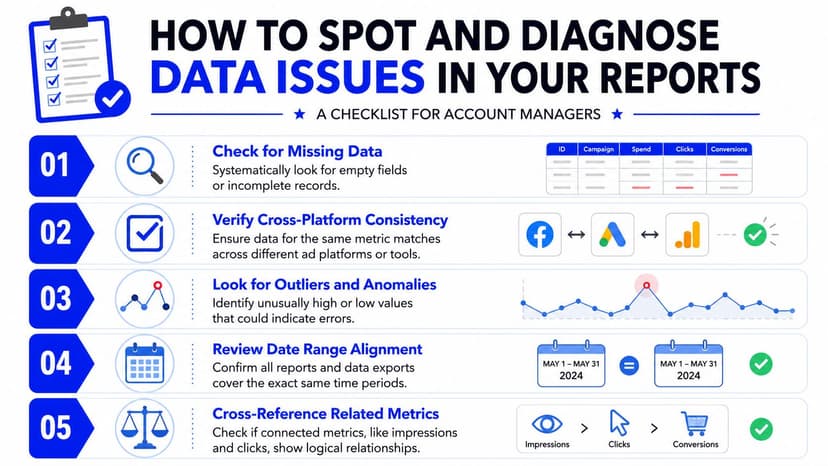
When a number looks off, run through these questions:
- Do the date ranges match? A one-day mismatch can throw off the whole month.
- Are timezones aligned? Platform defaults often differ from client reporting expectations.
- Are filters applied consistently? Branded vs non-branded, active campaigns only, specific regions, and lead status filters all matter.
- Do naming conventions match across sources? A campaign can disappear from a roll-up if the source labels drift.
- Did a connector, field mapping, or import change recently? Quiet changes create noisy reports.
A formal data validation process for agency reporting helps teams standardize this instead of relying on memory.
Track issue rate, not just incidents
A useful operational metric here is the DQ Issue Rate, calculated as Failed Checks ÷ Executed Checks, as explained in Umbrex's overview of data quality issue rate. For agencies, that can be simple. If you run ten checks across a report and two fail, your issue rate is easy to understand and easy to compare next month.
That same source notes that in marketing reports pulling from 50+ sources, inconsistent date formats or currency symbols can create a 5–15% variance in daily attribution. That's not a tiny formatting problem. It can change the story you tell the client.
If a KPI changes after format cleanup, timezone alignment, or currency normalization, the report didn't have an insight problem. It had a data handling problem.
Keep the first pass simple
You don't need a giant audit to catch most issues. A smart first pass usually includes:
- Reviewing top-line KPIs against source platforms
- Scanning for blanks or stale tiles in the dashboard
- Checking attribution-sensitive metrics like conversions and revenue
- Looking for sudden outliers that don't match campaign activity
- Confirming the report period and filters before anything goes to the client
That's enough to catch a large share of recurring agency-side data quality issues before they turn into awkward client conversations.
From Manual Fixes to Automated Systems
The biggest reporting shift for most agencies isn't better formulas. It's moving from repair work to system design.
What manual reporting gets wrong
The manual workflow is familiar. Export CSVs. Clean columns. Standardize labels. Paste data into Sheets. Update a Looker Studio data source. Fix a chart that broke. Copy final numbers into a slide deck or branded PDF. Repeat for the next client.
That process can work. It just doesn't age well.
Spreadsheets are flexible, which is why agencies lean on them. Looker Studio is also useful, especially when you have someone technical enough to maintain it. But neither tool is agency-native by default. Once you're handling recurring client reporting across a growing book of business, the maintenance overhead becomes part of the problem.
What works better in practice
A better setup has a few traits:
- Direct source connections so teams stop relying on exports
- Consistent templates for recurring client reporting
- Branded dashboards and white-label delivery so the presentation layer is clean
- Automated delivery so reports go out on schedule
- A shared system instead of scattered files and personal workarounds
Agency-focused reporting platforms stand apart from generic BI stacks. AgencyAnalytics, Whatagraph, Swydo, and Looker Studio all come up in these conversations for good reason. They each solve part of the reporting problem. The question isn't which tool sounds most powerful. It's which one fits a multi-client agency workflow without creating more setup and maintenance work than your team can support.
Why root-cause visibility matters
When you blend data from multiple platforms, it's not enough to know a number is wrong. You need to know where it went wrong.
According to Monte Carlo's guide to data quality monitoring, data lineage tracking is the most reliable way to isolate root causes in blended datasets, reducing detection and resolution time by up to 40% compared to manual audits. The same source says automated validation at entry points can cut manual fixes by 30–50%.
For agencies, that means fewer mystery errors. If a source mapping changes, a field is renamed, or a transformation breaks, the team can find the break faster instead of checking every tab and chart by hand.
A short product walk-through makes this difference easier to picture:
Manual vs platform workflow
Below is the comparison most ops leads end up making.
| Aspect | Manual (Spreadsheets / Looker Studio) | Oviond Platform |
|---|---|---|
| Data collection | Pulls often rely on exports, copy-paste, and connector upkeep | Connects agency reporting sources in one platform |
| Report setup | Each client report tends to become its own custom build | Template-driven setup across multi-client reporting |
| Error handling | Teams find issues late, often during report prep | Structured validation and clearer traceability |
| Branding | White-labeling usually needs extra workarounds | Built for branded dashboards, white-label delivery, and custom domain use |
| Delivery | Sending is often manual or split across tools | Automated delivery for recurring client reporting |
| Scaling | More clients usually means more reporting admin | Pricing by client count with unlimited reports, dashboards, and users in one plan |
| Team workflow | Knowledge sits with whoever built the file | Shared, agency-native workflow with AI/MCP-assisted setup options |
Teams making the jump from spreadsheets usually compare the tradeoff directly in guides like manual reporting vs automated digital marketing reporting. The pattern is consistent. Agencies don't just want prettier dashboards. They want fewer moving parts, cleaner client reporting, and a reporting stack that doesn't turn into chaos as client count grows.
Your Agency's Data Quality Checklist
The agencies that handle data quality issues well don't wait for errors to show up in front of clients. They build small routines that catch problems early.
New client onboarding
Start clean, or you'll be cleaning forever.
- Set naming rules before campaigns launch. Agree on campaign names, source labels, and UTM conventions at onboarding.
- Confirm tracking ownership. Decide who checks GA4 events, CRM fields, ad platform conversions, and any imported offline data.
- Choose source-of-truth rules. If conversions differ across tools, document which source the client report will use and why.
- Limit dashboard clutter. Only include metrics the client uses to make decisions.
Monthly reporting routine
A strong monthly rhythm prevents most recurring mistakes.
- Run a short spot check. Compare a small set of core KPIs against source platforms before reports go out.
- Look for silent failures. Missing charts, stale widgets, and empty rows usually point to connection or mapping issues.
- Review commentary against the numbers. Narrative mistakes often expose metric mistakes.
- Flag recurring exceptions. If the same channel or client causes confusion every month, fix the process, not just the report.
Quarterly operations audit
Agencies thereby reduce long-term reporting drag.
- Review unused metrics and sections. Dead dashboard space creates noise.
- Check connector health and access. Source permissions change. Accounts get renamed. Old connections linger.
- Refresh standards documentation. If the team has drifted from the original rules, update them.
- Tighten governance where it matters. If you need a broader framework, this guide to top data governance practices for 2026 is a useful reference for structuring ownership and standards.
Good agency reporting runs on routines that are boring enough to repeat and clear enough to hand to the next account manager.
The checklist doesn't need to be complicated. It needs to be used.
Make Your Agency Reporting Feel Simple
Data quality issues in agency reporting rarely come from one broken dashboard. They come from a messy reporting process repeated across multiple clients, channels, and team members.
That's why the fix usually isn't “be more careful.” The fix is to reduce manual handling, standardize what enters the reporting workflow, and make it easier to trace problems when they happen. Agencies that do this well aren't chasing perfect data at all costs. They're building reliable client reporting that stays clear, branded, and manageable as the agency grows.
Spreadsheets still have their place. Looker Studio can be useful too. AgencyAnalytics, Whatagraph, and Swydo all solve parts of the problem depending on how your team works. But if your day-to-day challenge is white-label, multi-client reporting with recurring delivery and scattered source data, generic setups usually start to show strain.
Agency reporting should feel operationally calm. Not improvised. Not fragile. Not dependent on whoever knows which spreadsheet tab to fix.
Agency reporting that finally feels simple.
If your team is tired of spreadsheet sprawl, patchy dashboards, and manual month-end reporting, Oviond is built for that exact agency workflow. It gives agencies white-label client reporting, branded dashboards, custom domain options, automated delivery, 70+ integrations, and AI/MCP-assisted setup in one agency-native platform. With all features in one plan, pricing by client count, and unlimited reports, dashboards, and users, it's a simpler way to scale clean client reporting without the usual reporting chaos.
Related articles
Simplify marketing reporting today
Stop juggling multiple tools. Start presenting clear, automated reports your clients will love