Email and automation — 14 sources
Mailchimp, Klaviyo, ActiveCampaign, Brevo, MailerLite, Moosend, Omnisend, SendGrid, Kit, Drip, GetResponse, Campaign Monitor, VBOUT and Pabbly Connect.
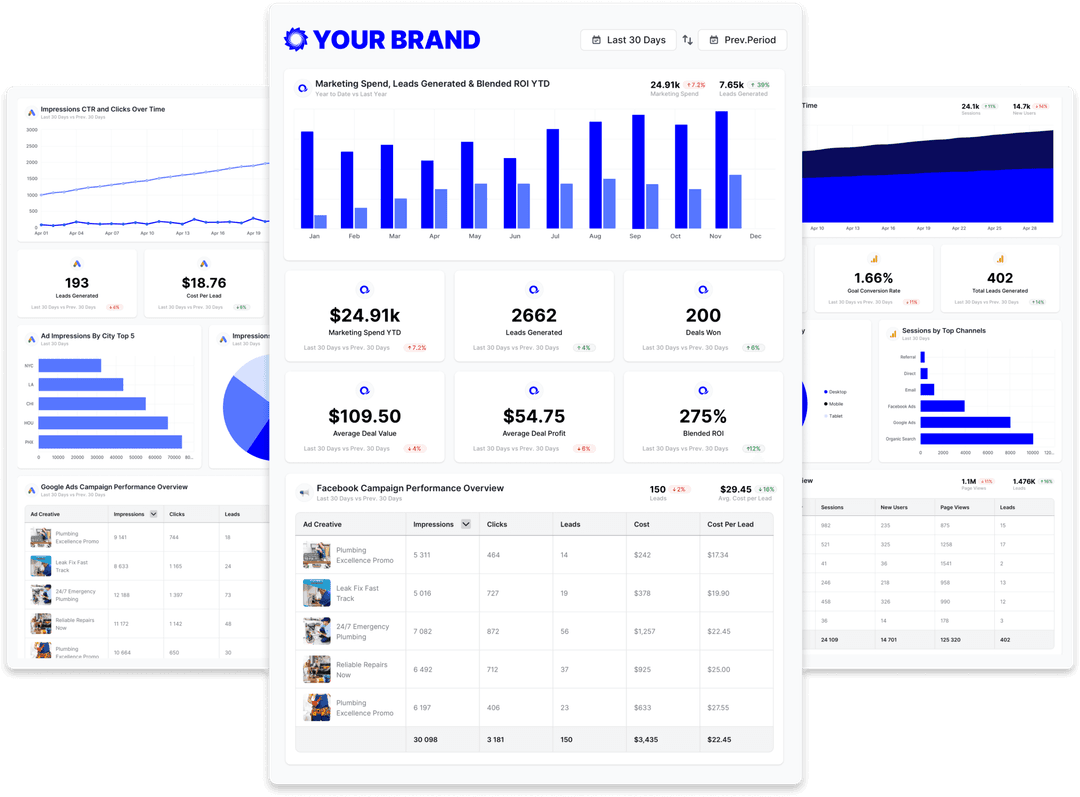
All-in-one client reporting means every connected source — ads, SEO, social, email, analytics, e-commerce, CRM and calls — lands in a single branded report on one date range, instead of one export per platform.
At a glance
A retainer that started on one channel ends up spanning five. The reporting problem is not any one platform — it is holding all of them in one place, on one date range, without paying per connection.
70+
Marketing data sources
Every public source is available on every plan, with no source credits and no per-integration upgrade.
15
Source categories
From ads and SEO to payments, call tracking, uptime monitoring and spreadsheets.
Unlimited
Connections per client
Connected source accounts are unlimited within a client. Plans are priced by client count, not by connection.
The facts an agency needs before shortlisting a reporting tool for this channel — each one dated and owned.
| Fact | Oviond |
|---|---|
| Connectors for this channel | 9 native sources: Google Analytics 4, Google Ads, Meta Ads (Facebook Ads), Instagram, Google Search Console, LinkedIn Ads, Microsoft Ads, Mailchimp, YouTube |
| Data sources | 70+ marketing data sources, no source credits or per-connection fees |
| Starting price | $40/month billed annually ($50 month-to-month) for 10 clients |
| Pricing model | One plan, every feature included; $5 per client month-to-month or $4 per client billed annually, from 10 to 100 clients self-serve |
| White-label | Included on every plan — unlimited white-label themes |
| Scheduled delivery | Recurring report email delivery and automations included on every plan |
| MCP / AI assistants | Hosted MCP server included on every plan; works across your whole client list from Claude, ChatGPT, or any MCP-ready tool |
| Free trial | 15 days, every feature included, no credit card |
Oviond facts verified September 1, 2026 by Oviond Product. Pricing in USD. See full pricing
Every channel
The 70+ marketing data sources in the catalog fall into 15 categories. Each one connects to a client the same way, reports on the same date range, and renders in the same theme.
Mailchimp, Klaviyo, ActiveCampaign, Brevo, MailerLite, Moosend, Omnisend, SendGrid, Kit, Drip, GetResponse, Campaign Monitor, VBOUT and Pabbly Connect.
Google, Meta, Microsoft, LinkedIn, TikTok, Pinterest, Snapchat, X, Instagram, AdRoll, Google Local Services and ChatGPT Ads.
Google Search Console, Semrush, Ahrefs, Moz, SE Ranking, Serpstat, SerpWatch, Nozzle, Keyword.com, Advanced Web Ranking, BrightLocal and Bing Webmaster Tools.
Facebook, Instagram, LinkedIn, YouTube, TikTok, X, Pinterest, Google Business Profile and Mention.
GA4, Matomo, Plausible, Piwik PRO, Microsoft Clarity, PageSpeed Insights, Pingdom, UptimeRobot and WordPress.
HubSpot, Salesforce, Pipedrive, Go High Level, CallRail, WhatConverts and Twilio.
Shopify, WooCommerce, Stripe, PayPal and Xero — storefront revenue and the money that actually cleared.
Google Sheets and Airtable for data you hold yourself, Vimeo and Wistia for video, Basecamp for project delivery, and Switchy for link tracking.
How it works
Combining channels is easy to claim and harder to do honestly. Three things make it real in Oviond, and it is worth being precise about each.
A client in Oviond owns its data sources, its reports and its dashboards. Connect Google Ads, Shopify, Klaviyo and CallRail to the same client and every one of them is available to every widget in that client's reports, on whatever date range the report is set to. Connected source accounts are unlimited within a client, so adding the fifth platform costs nothing extra.
Each data widget reads one source — a chart of Google Ads clicks is a Google Ads chart. Cross-channel math happens one level up, in a calculated metric: every token in the formula is its own data-source query, so a single formula can divide ad spend from one platform by conversions or revenue from another. Blended cost per acquisition, true ROAS against store revenue, and cost per booked call are all defined once and recalculated on every run.
Save a finished multi-channel report as a template and it keeps every page, widget, metric and dimension choice, date range, theme and presentation setting. Applying it to a new client copies the structure and rewires the widgets to that client's connections, so the tenth client takes minutes rather than an afternoon.
Three things that get worse with every channel added to a retainer.
Five logins and a spreadsheet to join them
Every channel in one report, on one date range
Paying per integration or per data source
Unlimited connections per client, priced by client count
A different report shape for every client
One template, reused and rewired per client
These nine cover the majority of retainers. The other 65 connect exactly the same way.
The digital marketing dashboard already spans analytics, ads, search, social and email. Connect the client's accounts and it fills in.
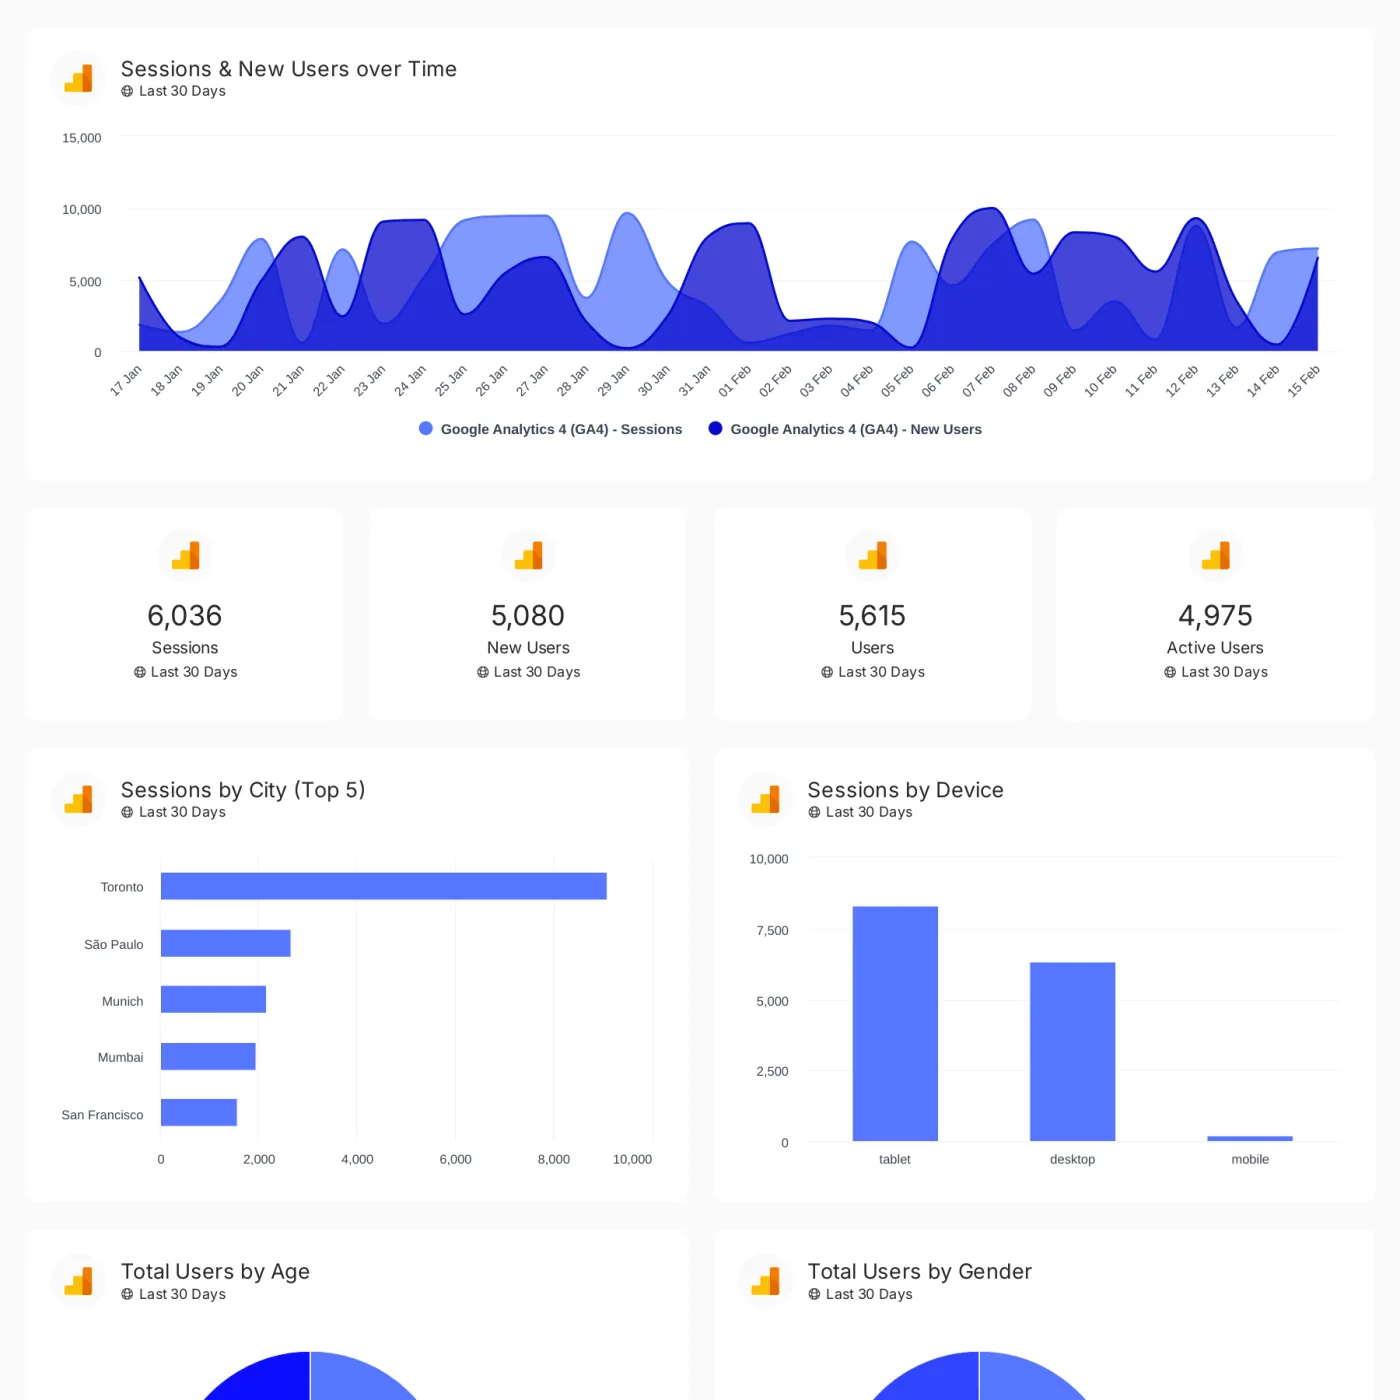
Track conversions, revenue, traffic, and customer engagement across your client's full marketing stack in one branded dashboard.
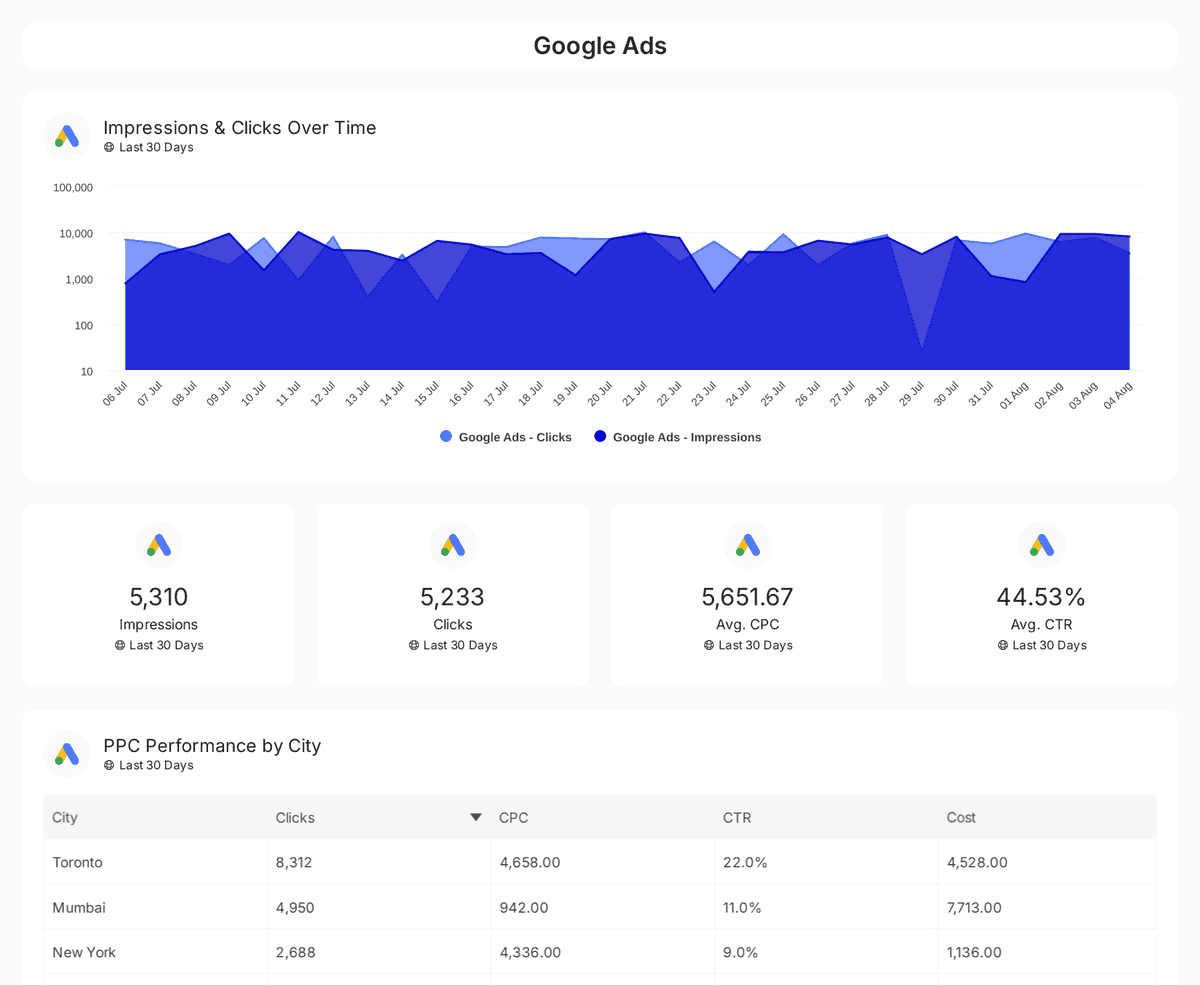
Track and compare reach, clicks, impressions, and CTR across Google, Facebook, Instagram, LinkedIn, and Twitter Ads over time.
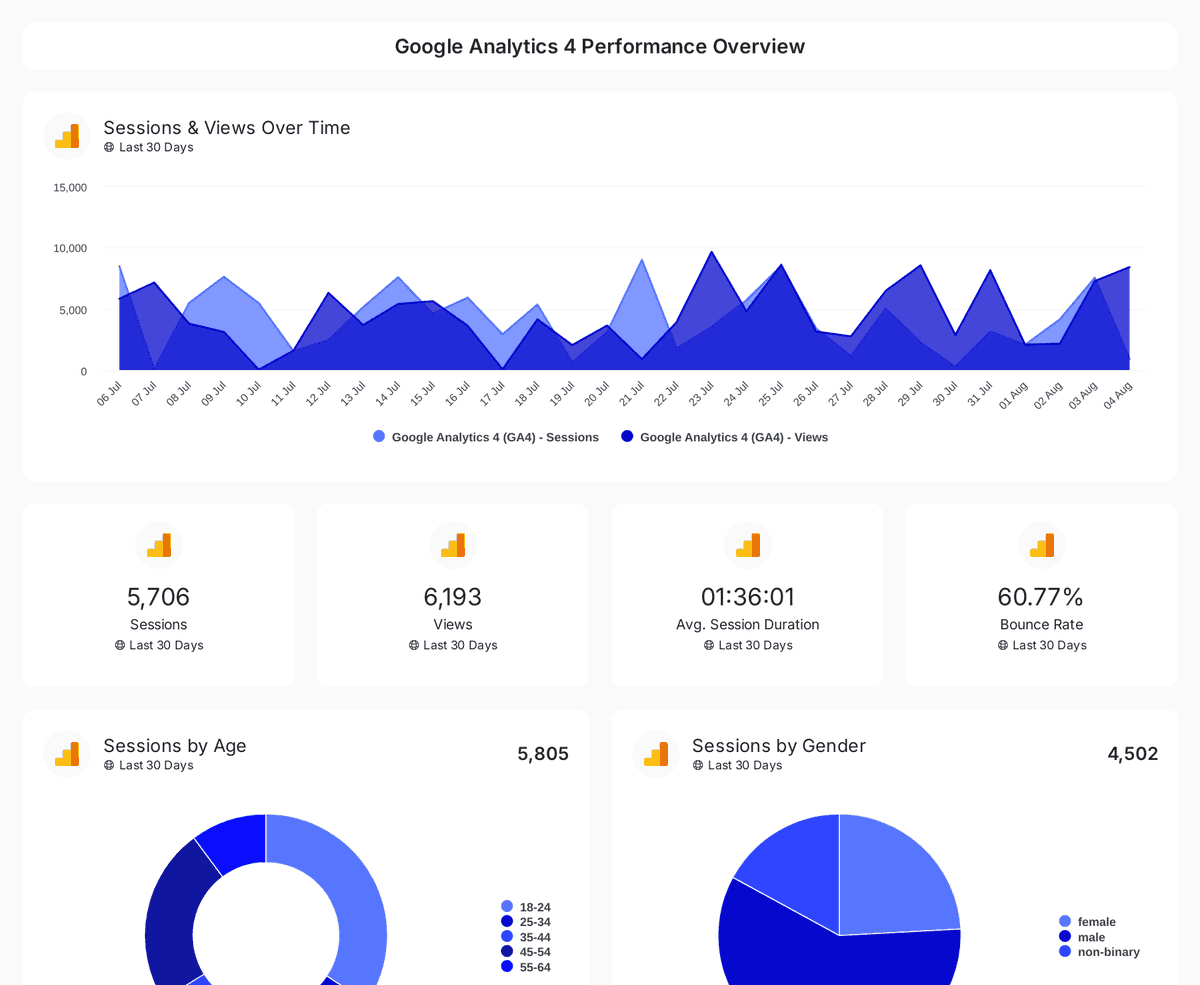
Monitor website traffic, user demographics, and page performance with insights from Google Analytics 4, Search Console, and Page Speed Insights.
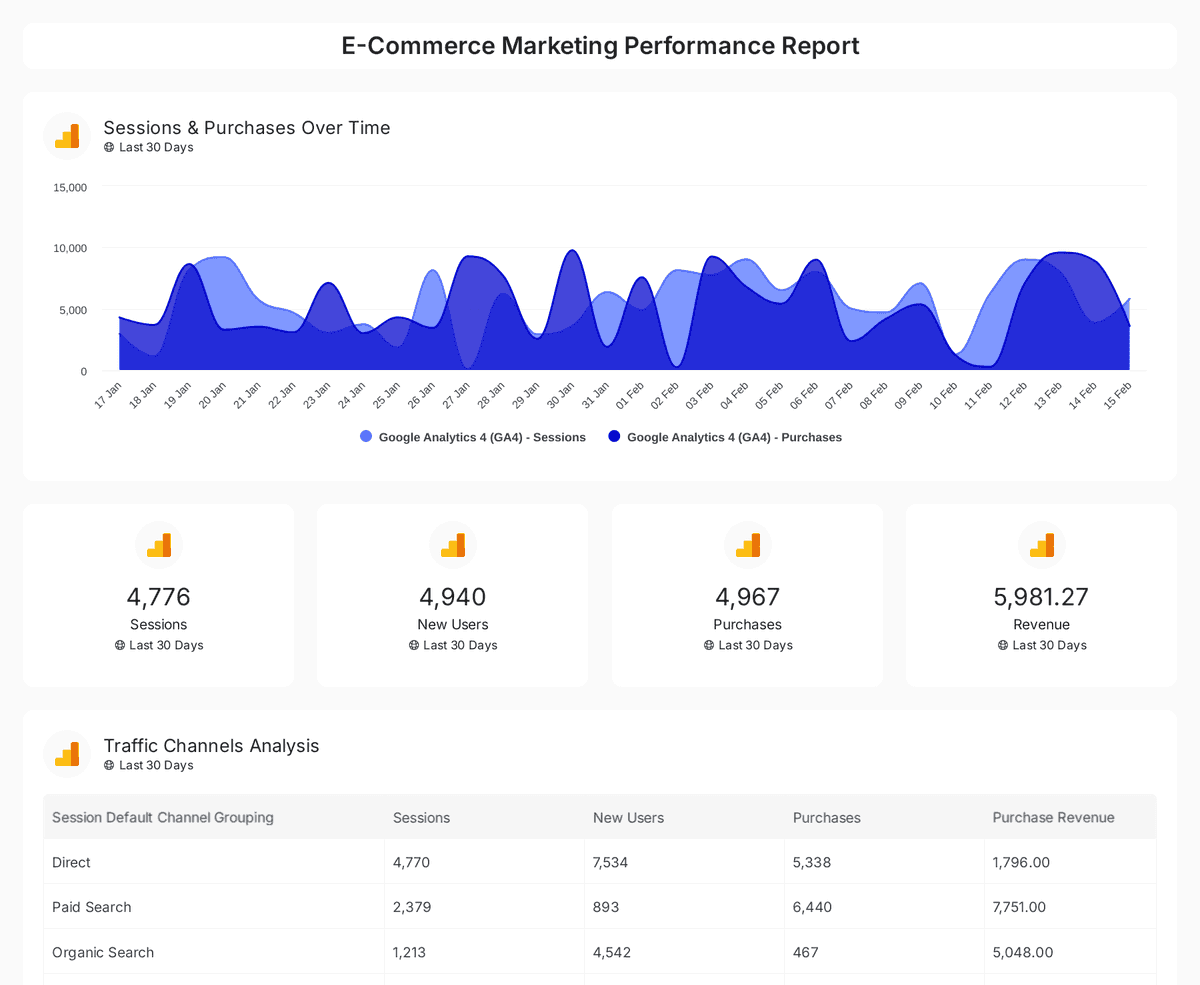
Analyze e-commerce sales, conversions, and traffic insights with interactive, real-time performance metrics.
Build it once per client, then the platform handles the repetition.
A multi-page report gives each channel its own named page and the client a table of contents, so a five-channel account stays readable.
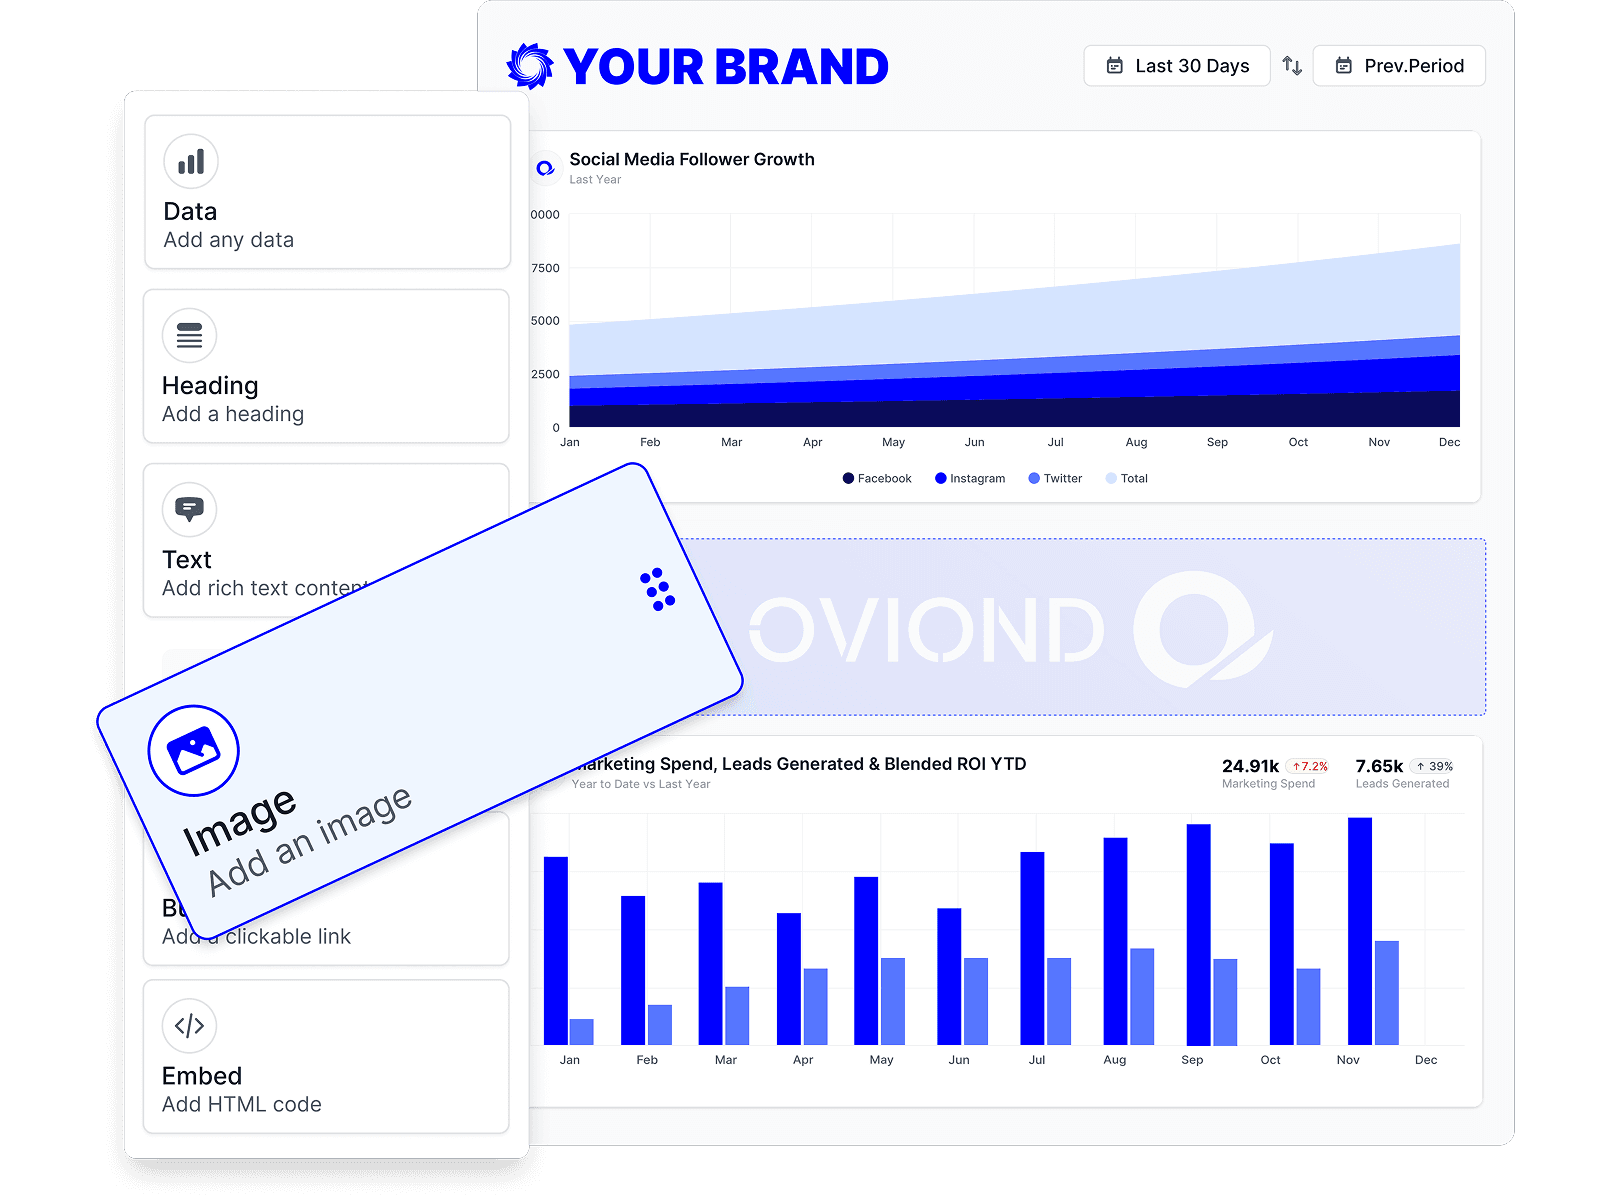
One theme styles every page, and a custom domain puts the whole report on your URL — whichever channels it happens to contain.

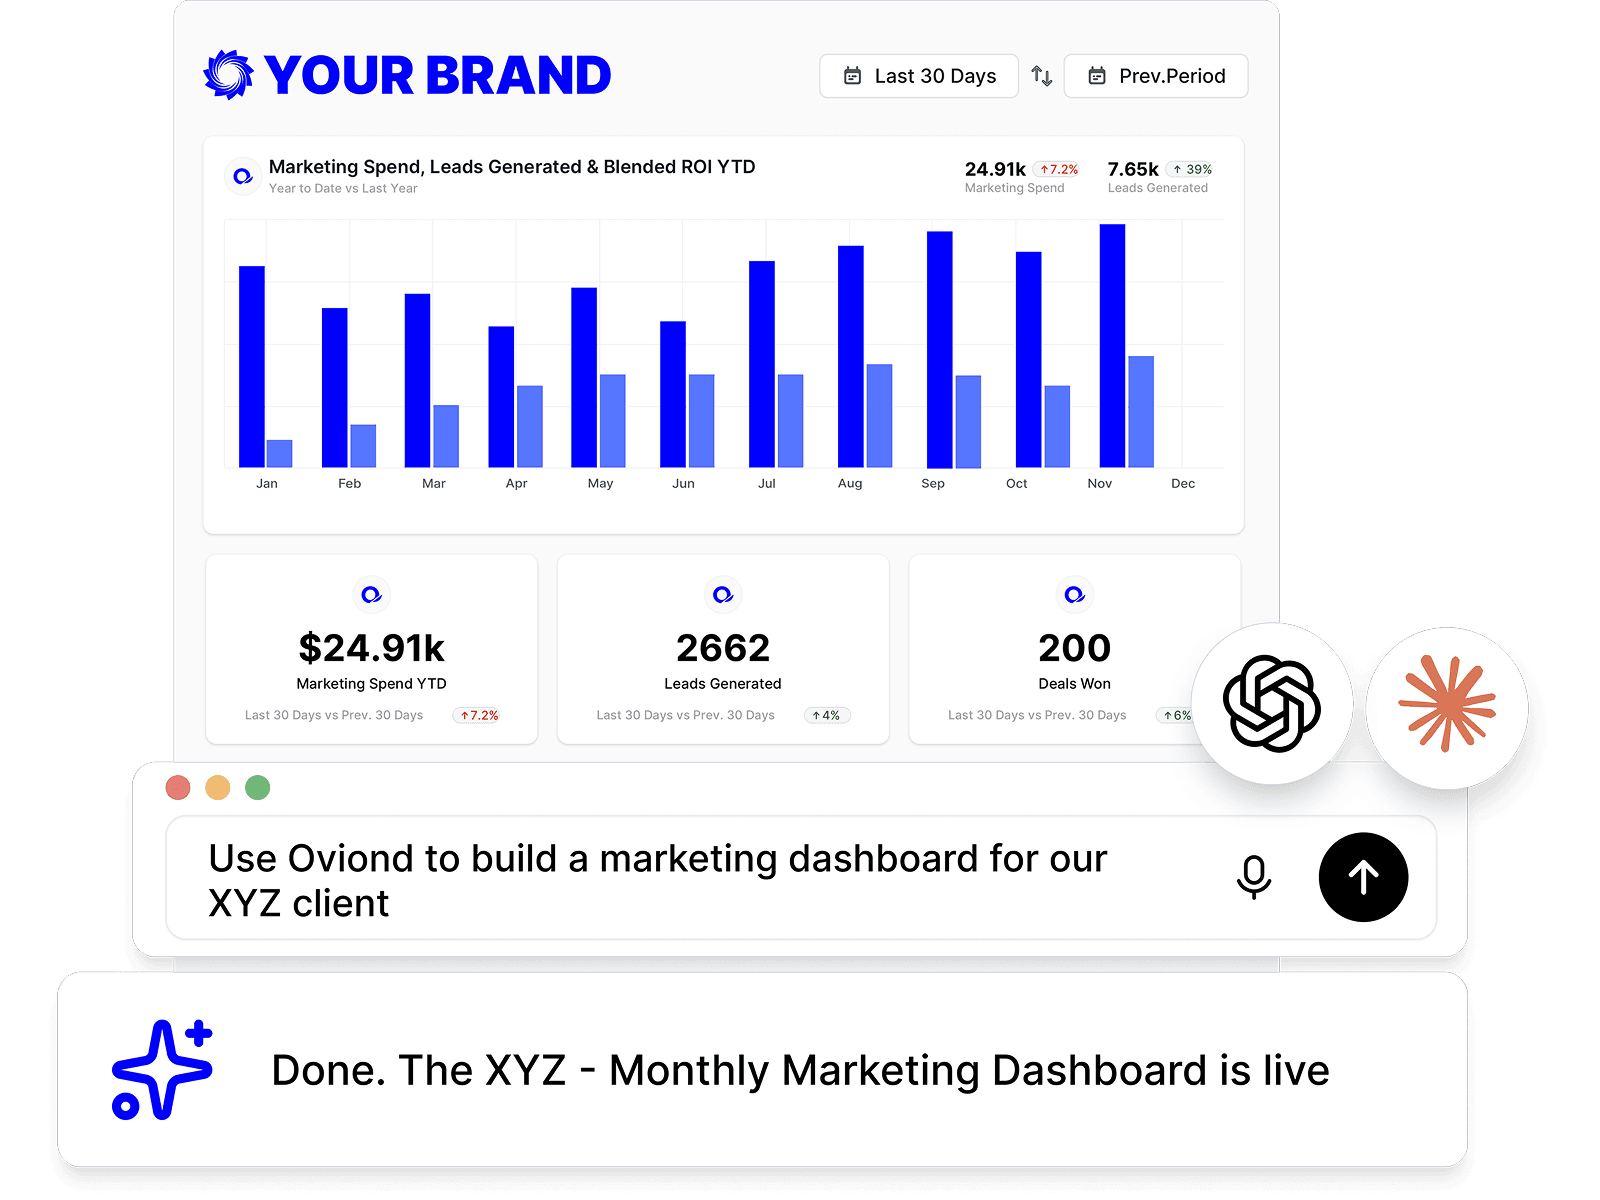
Connect an AI assistant over MCP and ask it to create the client, clone a template and wire the widgets — then finish the layout by hand.
Reviews from Capterra and G2, each linked to its source.
Ease of Use, Ease of Implementation, Number of Features, Ease of Integration sometimes it disconnect from integrations and we have to reconnect reporting period...
Ease of Use, Ease of Implementation, Number of Features, Ease of Integration sometimes it disconnect from integrations and we have to reconnect reporting periodically to our customers all data analytics in one easy dashboard

I really appreciate how Oviond brings together all my marketing data into a clean, customizable dashboard that clients actually understand and love. The drag-an...
I really appreciate how Oviond brings together all my marketing data into a clean, customizable dashboard that clients actually understand and love. The drag-and-drop editor makes building reports and dashboards straightforward, and the pre-built integrations with Facebook Ads, Google Analytics, LinkedIn, and many others save me tons of time. I The platform’s rich feature set can feel overwhelming at first. Oviond unifies data from multiple ad platforms, analytics tools, and CRMs into one intuitive, branded dashboard—making it easy to track KPIs, spot trends, and demonstrate value to clients.
I have enjoyed using Oviond for all sorts of marketing and analytics dashboards for both me and my clients. There is a great variety of connections that are eas...
I have enjoyed using Oviond for all sorts of marketing and analytics dashboards for both me and my clients. There is a great variety of connections that are easy to use and the dashboards and reports have stylish standard looks but also the option to customize them however you wish. Easy to use dashboards and channel connections. The support is also available and helpful. I've been a user for a long time and in early stages there were some minor bugs but those have been fixed a long time ago. The biggest concern has been missing channel connections but they have actively added more connections.


The best part I like about Oviond is connecting the Google Sheets with Oviond where I could see the real-time dashboard. The dashboard is so interactive that yo...
The best part I like about Oviond is connecting the Google Sheets with Oviond where I could see the real-time dashboard. The dashboard is so interactive that you can make customization according to your requirement. The Interface is slightly dull. It can be more user-friendly. For the first-timers, it might take time to understand. While searching for a dashboard that can help us to show real-time analytics. I've found Ovoind which truly helped me to connect within a few minutes and made my life easier. This helps to give insights and make descions for the marketing team.
Mainly it is entirely cloud-based; I like that I can perform analytical reports, and it allows me to get a relatively broad digital marketing performance; the d...
Mainly it is entirely cloud-based; I like that I can perform analytical reports, and it allows me to get a relatively broad digital marketing performance; the dashboard is beautiful with features that fit very well with my development. I can easily edit, drag, and organize widgets and text boxes; I am fascinated with making funnels for my marketing campaigns I consider it a complete tool. The biggest weakness I see is that it does not have a mobile application is quite helpful today; there may be bugs in the creation of documents in PDF format. I hope they can fix it soon, I wish there were no limits on board widgets, but overall it is a good application. I use it to create digital marketing reports useful when evaluating and promoting our plans. Organizing customer data allows me more organization in my workplace and creates reports and funnels for greater reach in our company.
Exceptional. Easy to set up. Amazing customer support. There is nothing in the software that I dont like.
I was looking for a way to view in one document all analytics from multiple sources. Oviond answers my needs. I can check my datas on a regular basis, just by r...
I was looking for a way to view in one document all analytics from multiple sources. Oviond answers my needs. I can check my datas on a regular basis, just by refresh the report. This product is simple, fast and efficient. This product provides me with a simple way to mix multiple data sources from my social media accounts and website analytics. I can build reports in minutes with the templates offered by Oviond team. Sometimes, when I modify some titles, the product keeps the old ones.

Positiva. Es un producto que doy a todos mis clientes con planes mensuales. En esta aplicación buscaba dar una visión más profesional de los proyectos de client...
Positiva. Es un producto que doy a todos mis clientes con planes mensuales. En esta aplicación buscaba dar una visión más profesional de los proyectos de clientes, así como de los propios a socios. El usuario ve profesionalidad. Me gustaría la posibilidad de insertar algún texto explicativo en los paneles o menus con iframes en pestañas para poder centralizar el proyecto en su totalidad. Aunque Oviond es bueno, me veo obligado a compartir sus datos en un tercer portal, para poder incrustar algunos comentarios personalizados.
What agencies ask about running every channel through one reporting platform.
All-in-one client reporting means every marketing channel a client runs is reported from one platform, in one document, on one date range — rather than a separate export or dashboard per tool. In Oviond a client owns its connections, and every report for that client can draw on all of them.
Connected source accounts are unlimited within a client. Published plans are priced by client count rather than by connection, and all 70+ public data sources are available without source credits.
Not as a single data widget — each one reads one source. Cross-platform figures are built as calculated metrics: every token in the formula is its own data-source query, so one formula can combine spend from one platform with conversions or revenue from another. Use separate widgets per platform for side-by-side comparison.
Yes, as a calculated metric. Define the formula once, choose whether it renders as currency, a percentage or a plain number, and it appears in the metric picker like any other field and recalculates on every report run.
Give each channel its own page. A multi-page report holds as many named, reorderable pages as you need and shows the client a table of contents on the shared report — so depth does not cost clarity.
That is the point of the template layer. Save a finished multi-channel report as a template and it carries the pages, widgets, date range, theme and presentation settings; applying it to a new client rewires the widgets to that client's connections.
Upload the numbers as custom data. A CSV or JSON dataset of up to 10,000 rows can be mapped to a widget's metrics and dimensions and sits in the report next to the connected sources. Google Sheets and Airtable also connect directly.
Yes. Build a dashboard from the same connected data — a single always-current view of up to 50 widgets — and share it as a live link alongside the scheduled report. See marketing dashboards.
Most agencies arrive for one channel and stay for the rest. Begin with paid ads, SEO, social or email, then add web analytics, e-commerce and leads and calls as the retainer grows. Weighing tools up? See how Oviond compares.
Connect whatever the client runs, start from a multi-channel template, and send one report instead of five exports.