











Google Ads
Impressions, clicks, cost, CTR, CPC, conversions and historical quality score — plus dedicated campaign, ad group, keyword and search-terms views for the queries actually triggering spend.
PPC reporting in Oviond pulls Google Ads, Meta Ads, Microsoft Ads, LinkedIn Ads, TikTok, Pinterest, Snapchat and X into one branded client report — spend, clicks, conversions and return, on the schedule you set.
At a glance
Most paid accounts are spread across three or four ad platforms, each with its own login, its own idea of a conversion, and its own export. Oviond connects them to one client and reports them in one place.
12
Ad platforms
Google, Meta, Microsoft, LinkedIn, TikTok, Pinterest, Snapchat, X, Instagram, AdRoll, Google Local Services and ChatGPT Ads.
1,800+
Google Ads fields
The full metric and dimension catalog Google exposes, not a curated shortlist of ten KPIs.
10
PPC templates
Ready-made layouts for single platforms and for cross-platform paid reporting.
The facts an agency needs before shortlisting a reporting tool for this channel — each one dated and owned.
| Fact | Oviond |
|---|---|
| Connectors for this channel | 12 native sources: AdRoll, ChatGPT Ads, Google Ads, Google Local Services Ads, Instagram Ads, LinkedIn Ads, Meta Ads (Facebook Ads), Microsoft Ads, Pinterest Ads, Snapchat Ads, TikTok Ads, X Ads (Twitter Ads) |
| Data sources | 70+ marketing data sources, no source credits or per-connection fees |
| Starting price | $40/month billed annually ($50 month-to-month) for 10 clients |
| Pricing model | One plan, every feature included; $5 per client month-to-month or $4 per client billed annually, from 10 to 100 clients self-serve |
| White-label | Included on every plan — unlimited white-label themes |
| Scheduled delivery | Recurring report email delivery and automations included on every plan |
| MCP / AI assistants | Hosted MCP server included on every plan; works across your whole client list from Claude, ChatGPT, or any MCP-ready tool |
| Free trial | 15 days, every feature included, no credit card |
Oviond facts verified September 1, 2026 by Oviond Product. Pricing in USD. See full pricing
Connect each one to the client once. From then on it feeds the same report, on the same date range, with the same branding.
What you can report
Every widget in Oviond reads a platform's own field catalog, so the metrics you can report are the ones the platform actually publishes. These are the fields agencies build paid reports on.
Impressions, clicks, cost, CTR, CPC, conversions and historical quality score — plus dedicated campaign, ad group, keyword and search-terms views for the queries actually triggering spend.
Spend, reach, frequency, link clicks, outbound CTR and purchase ROAS, broken down by publisher platform, device, age or gender when a client asks who the budget reached.
Spend, CTR, average CPC, quality score, conversions and cost per conversion, with impression share lost to rank and lost to budget — the two figures that tell you which lever to pull.
Impressions, clicks, CTR, CPC and total spend, with member seniority, job function, industry and company size as dimensions — the B2B breakdowns no other platform offers.
TikTok Ads, Pinterest Ads, Snapchat Ads, Instagram Ads and X Ads each connect on their own, so a client running paid social across four networks still gets one report.
AdRoll covers retargeting spend and Google Local Services Ads covers lead-based local campaigns, so the long tail of a paid account is not left out of the report.
Three things that eat the day before anyone has looked at performance.
One export per platform, then a spreadsheet to join them
Every platform reports into the same client report on the same date range
Cost metrics rendering green when they rise
Set an indicator per metric so falling CPA and CPC read as wins
Rebuilding the same paid report on the first of every month
Schedule it once and it renders fresh and sends itself
These run on real connected data. Pick one, connect the client's ad accounts, and the recurring report builds itself.
Track and compare reach, clicks, impressions, and CTR across Google, Facebook, Instagram, LinkedIn, and Twitter Ads over time.
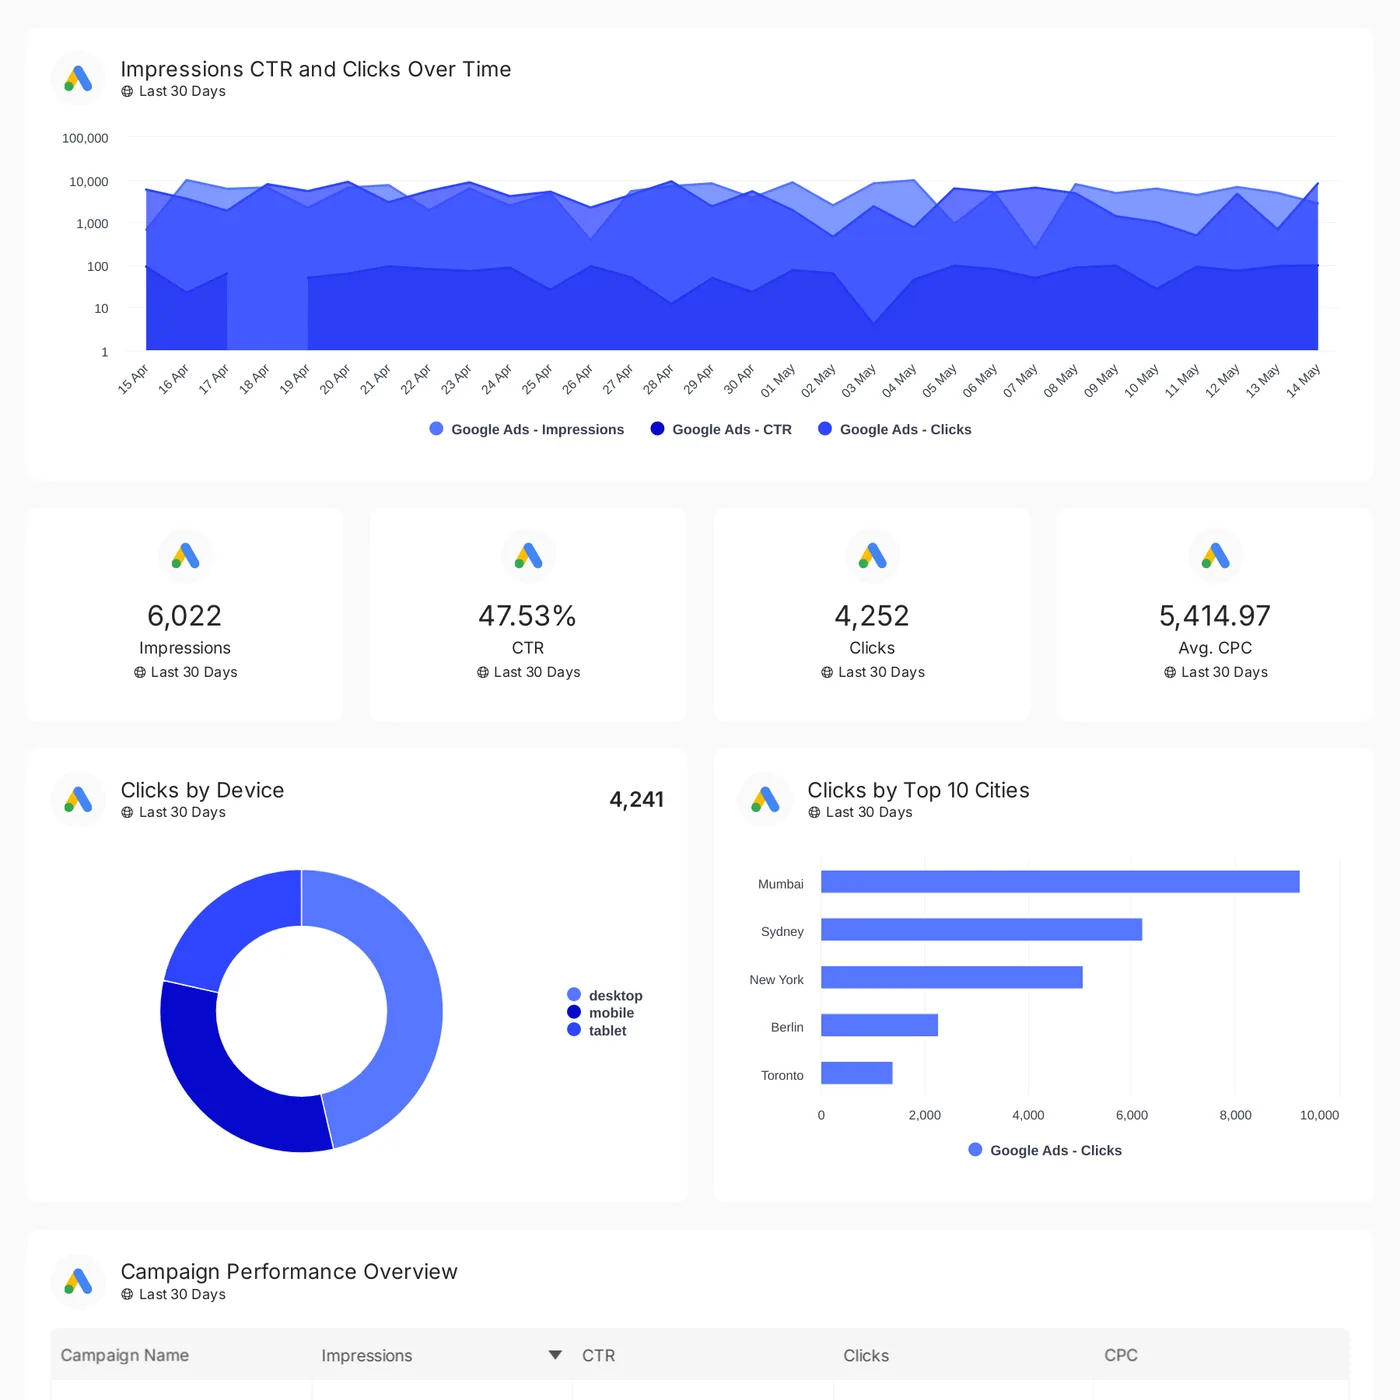
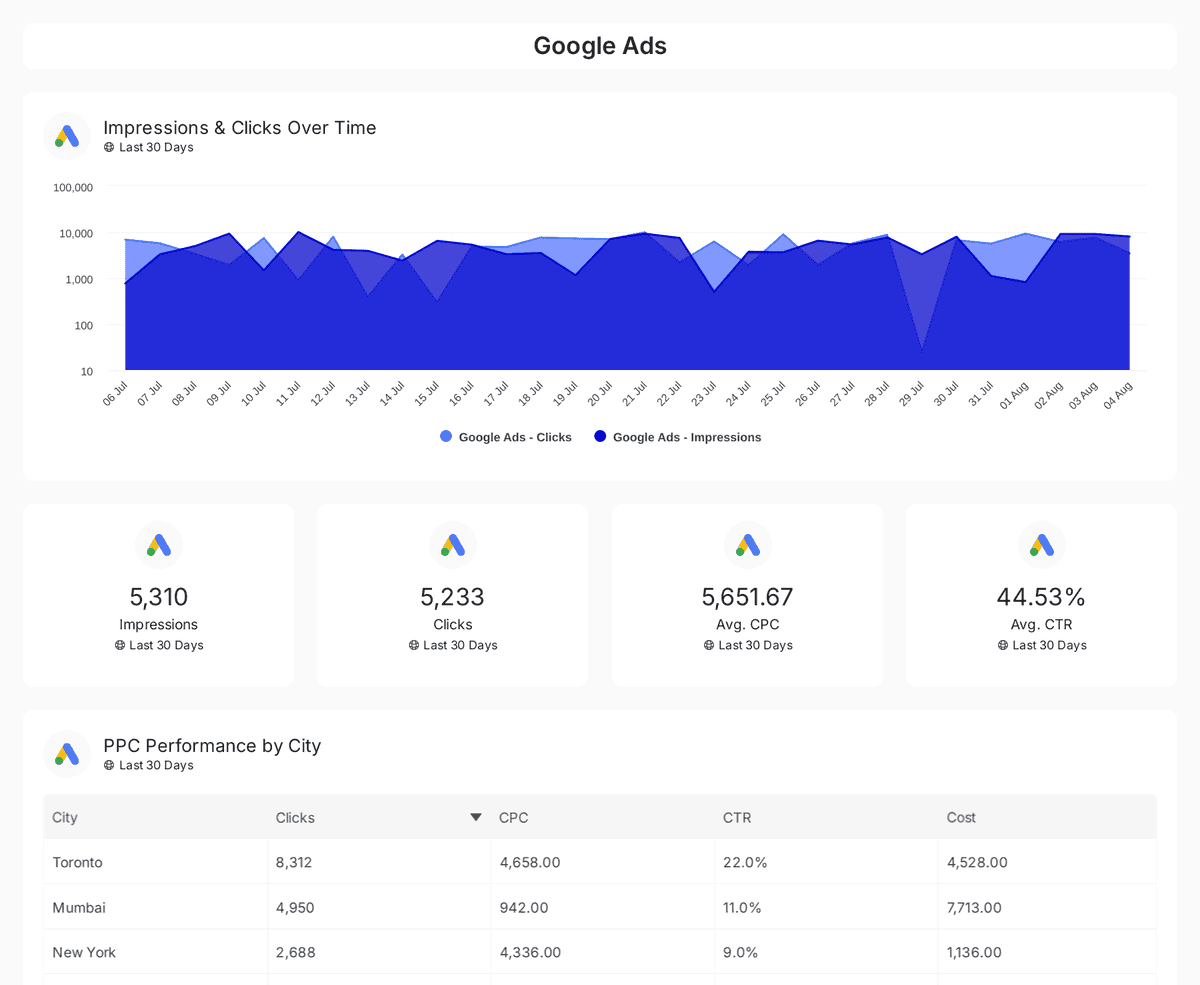
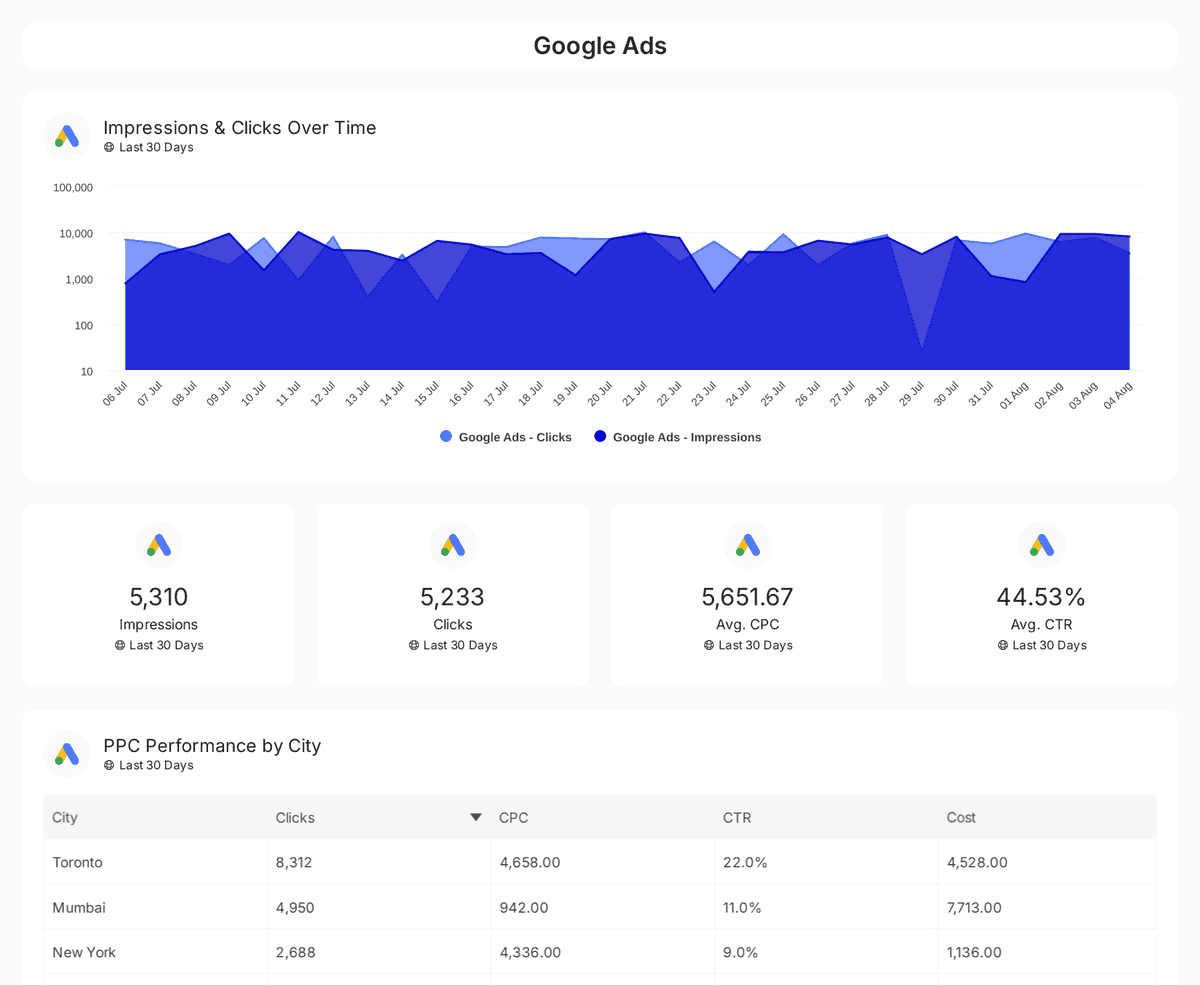
Track Google Ads performance with insights on impressions, clicks, CTR, CPC, device usage, top cities, and campaign-level metrics
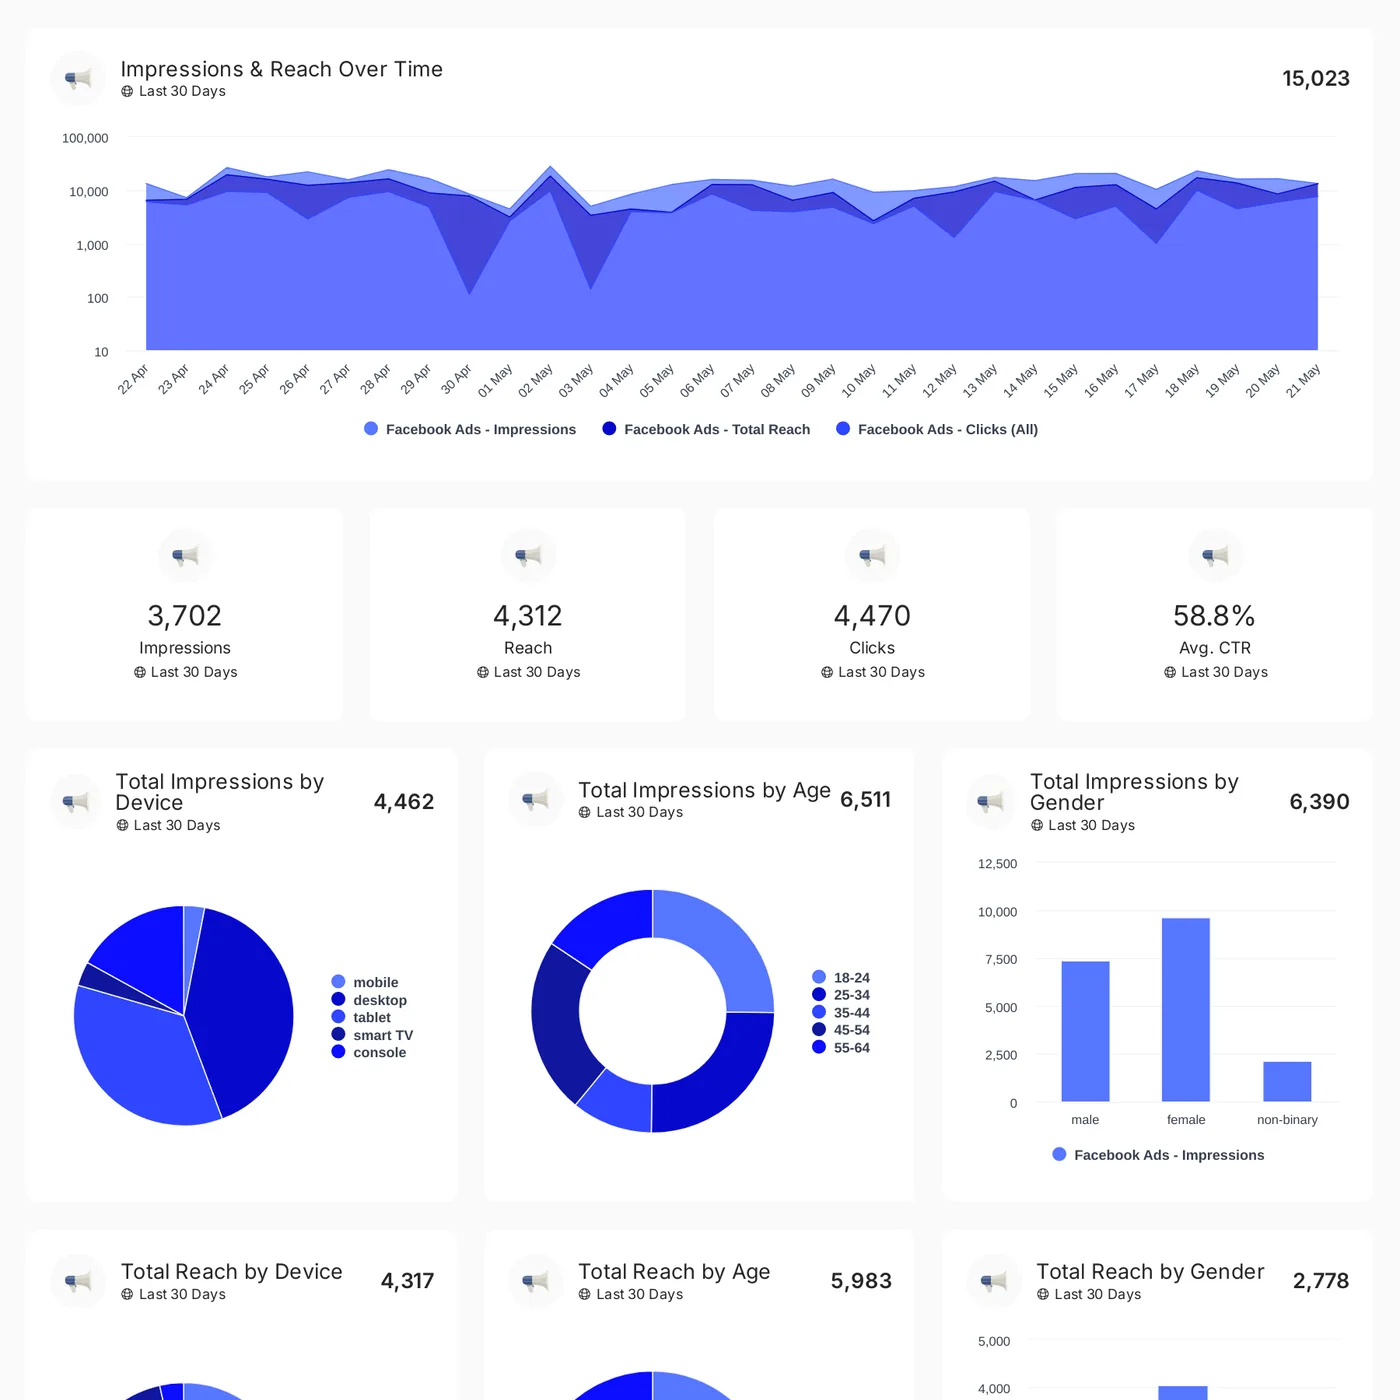
Track Facebook Ads performance with a dashboard covering spend, engagement, demographics, and campaign metrics in one professional view.
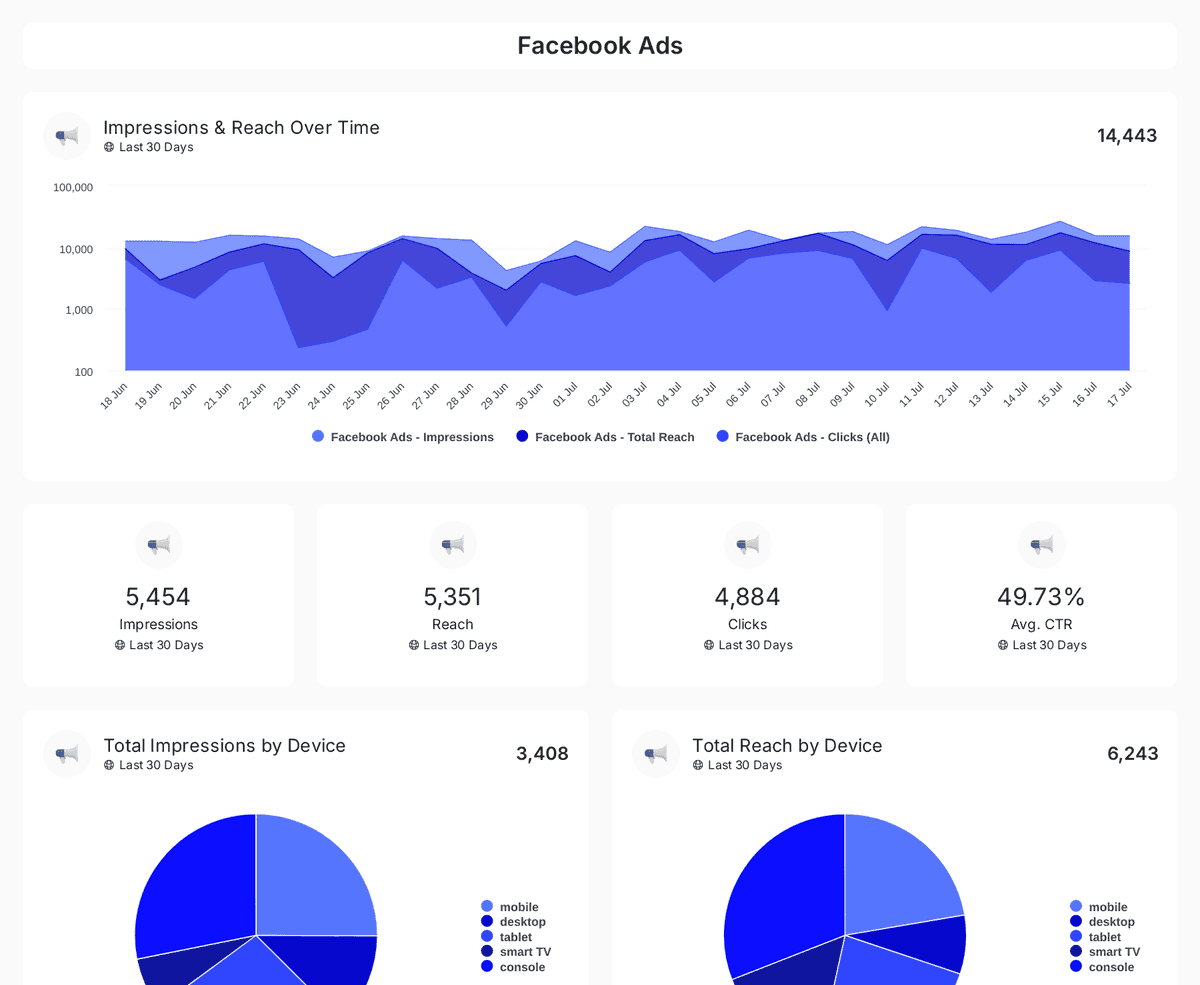
Track impressions, clicks, CTR, and ad spend across Facebook, Instagram, LinkedIn, TikTok, and Twitter Ads with insights on engagement & conversions.
Build it once per client, then the monthly rebuild stops being anyone's job.
Drag in the spend tiles, campaign tables, and platform comparisons the client reads, and add the commentary that explains what moved.
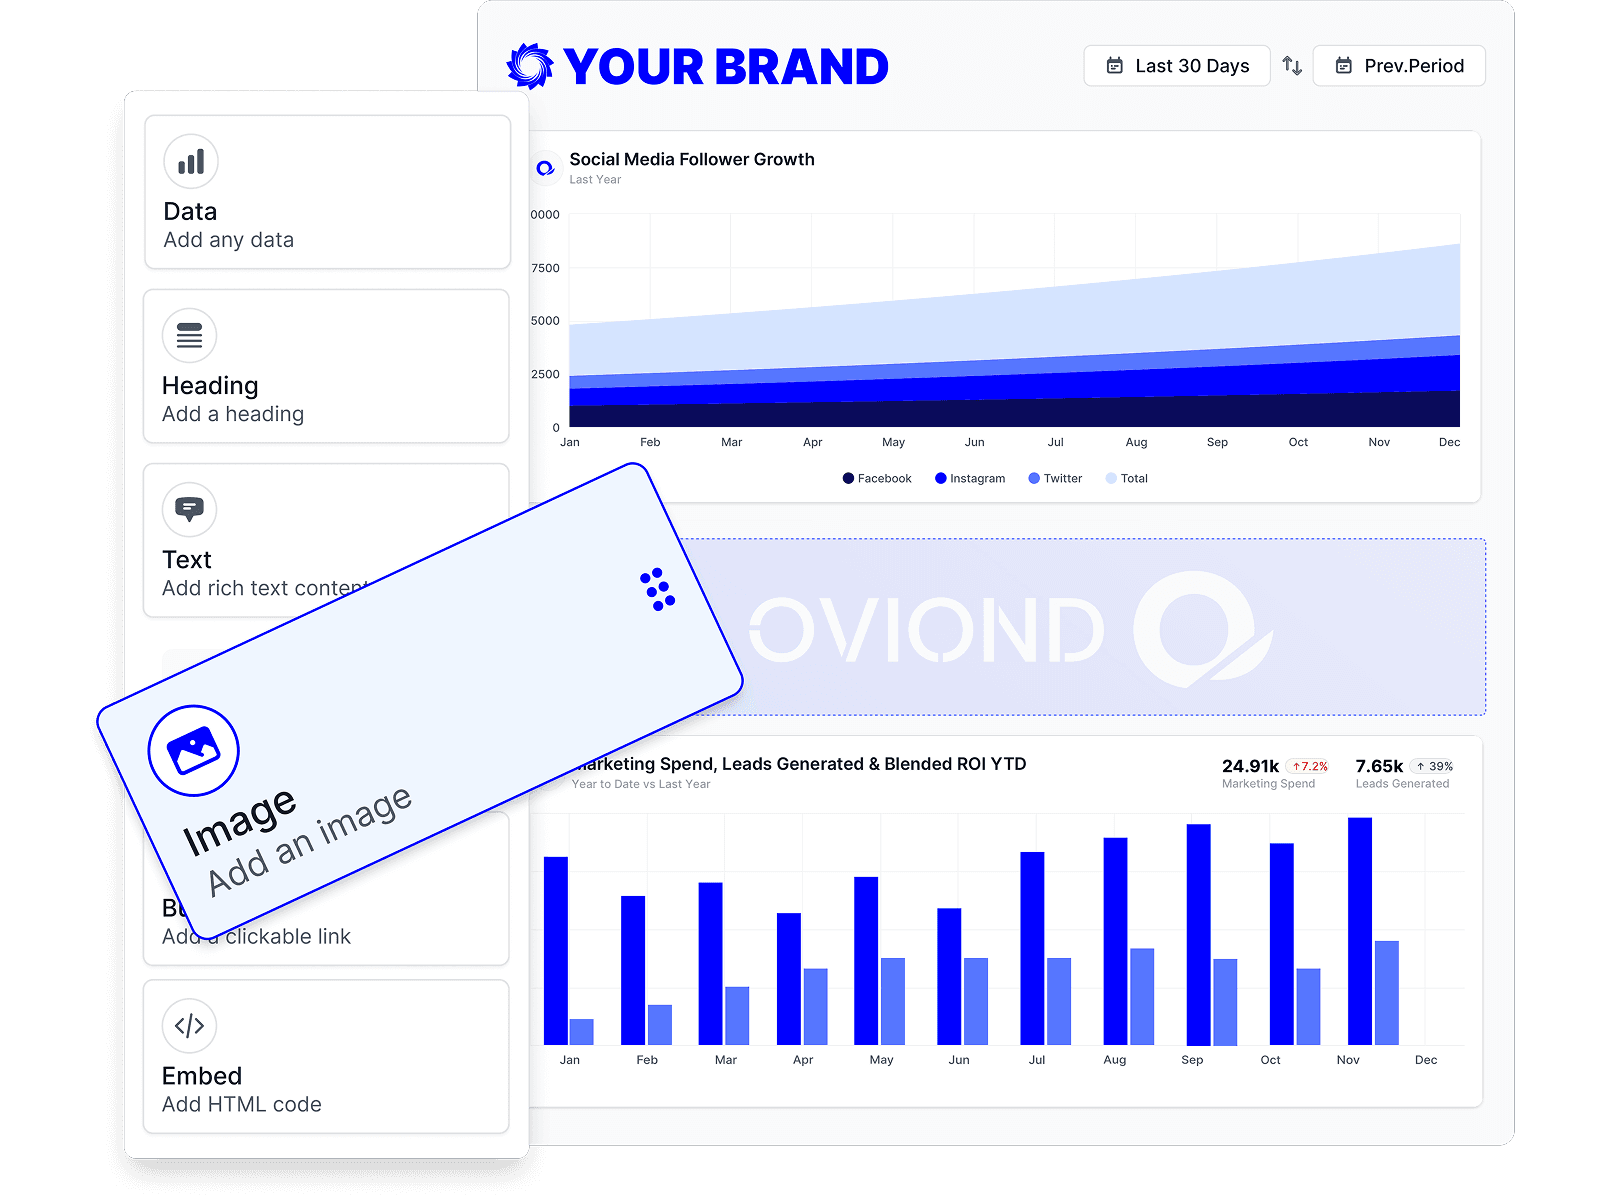
Apply your logo, colors and a custom domain, so the paid report the client opens is unmistakably your work.

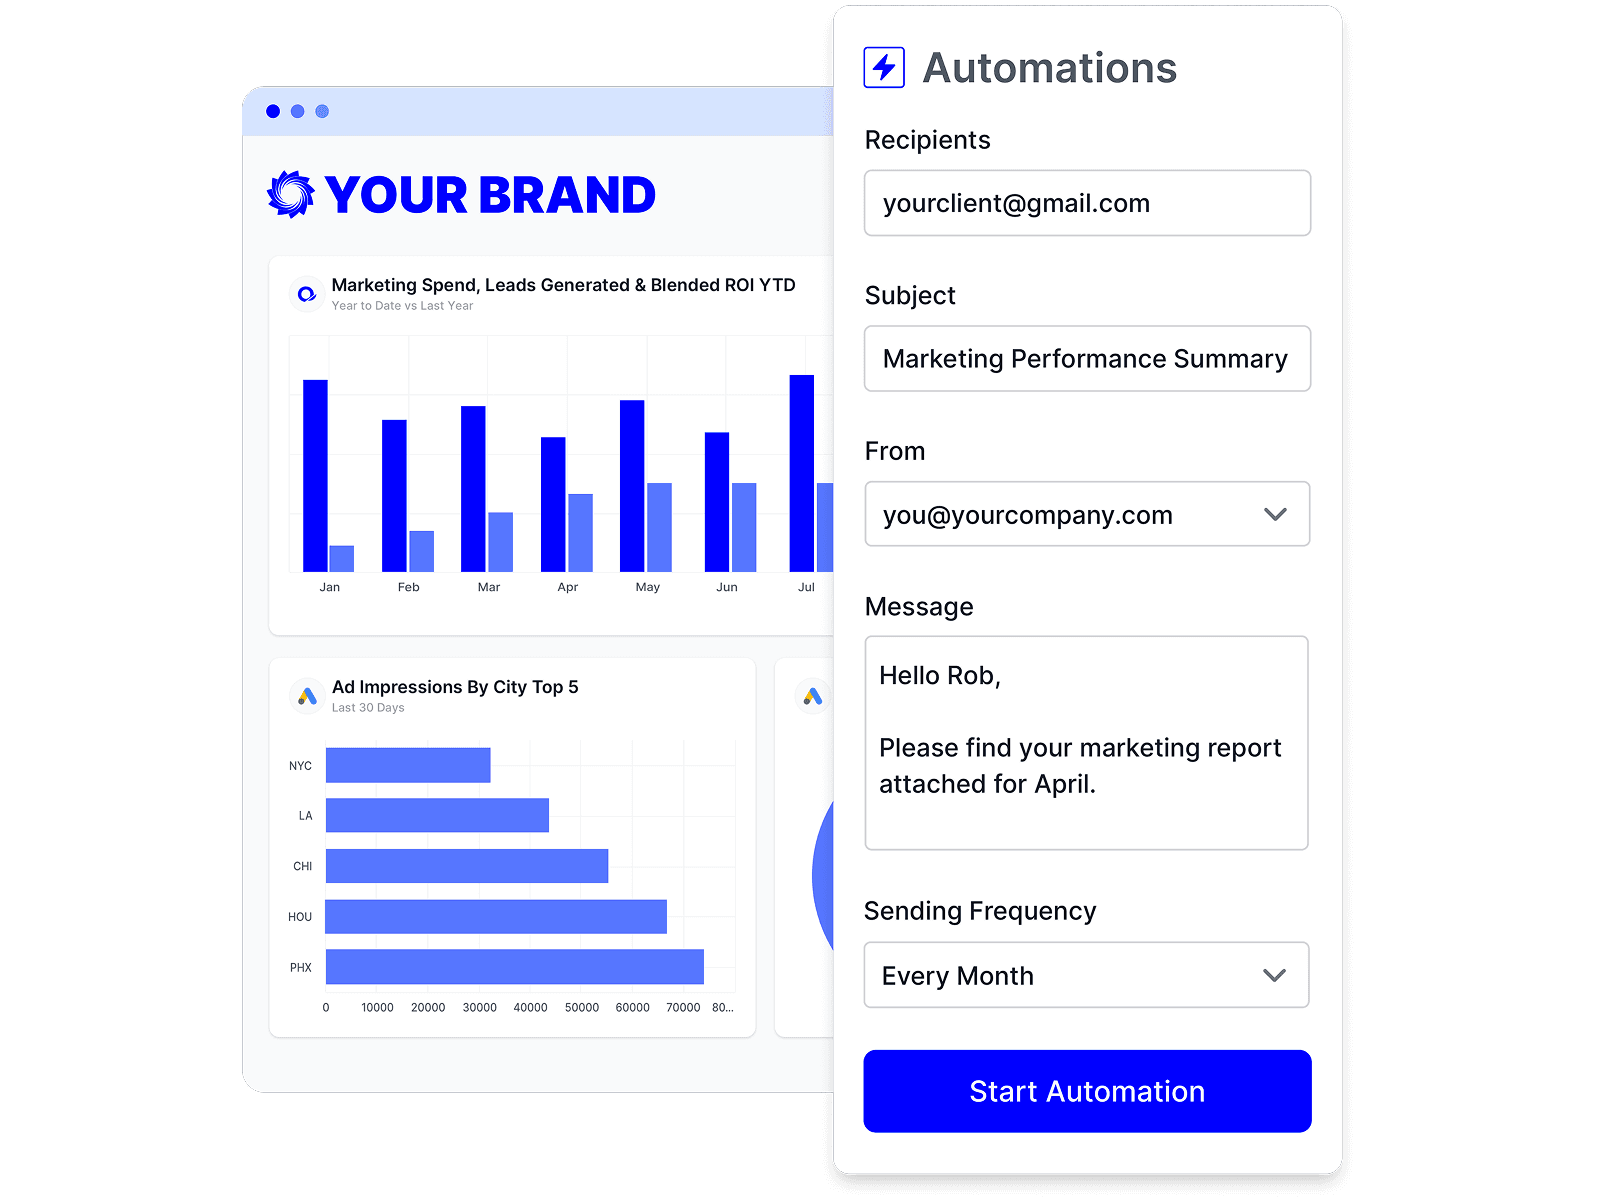
Set daily, weekly or monthly delivery and the report renders fresh for the new period on every run, from your own sender address.
Spend is the input; the client cares about the outcome. Put paid next to web analytics to show what the traffic did, next to e-commerce and revenue to show what it sold, or next to leads and calls to show what it actually generated. A calculated metric can divide spend from one platform by conversions from another, so blended cost per acquisition sits in the same report. See all-in-one client reporting for the full picture.
Direct answers to what agencies ask about reporting paid media to clients.
Twelve: Google Ads, Meta Ads, Microsoft Ads, LinkedIn Ads, TikTok Ads, Pinterest Ads, Snapchat Ads, X Ads, Instagram Ads, AdRoll, Google Local Services Ads and ChatGPT Ads. Each connects to a client separately and reports into the same client report.
Yes. Both platforms report into the same client report on the same date range, so the comparison sits side by side. Each data widget reads one platform, so use separate widgets per platform — then a calculated metric to produce a blended figure such as total spend or blended cost per conversion.
Build it as a calculated metric. Each token in the formula is its own data-source query, so a single formula can combine spend from one platform with conversions or revenue from another. Save it once and it appears in the metric picker like any other field.
Yes. Google Ads exposes dedicated search-keywords and search-terms views, and Microsoft Ads exposes a keywords view, so you can report the queries and keywords driving spend rather than only campaign totals.
Set the metric's comparison indicator to lower is better. Cost, CPC and cost per conversion then show green when they fall and red when they rise. The arrow and sign always follow the real movement — only the colour changes.
Yes. Schedule a report for daily, weekly or monthly delivery, and the reporting period is stored as a preset that re-resolves on every run — so a monthly automation set to last month always covers the most recent complete month.
Yes, and it is included on every plan. Apply your logos and theme, then add a custom domain so the report opens at your agency's URL rather than a vendor's. See white-label reporting.
Connect each platform from your Oviond dashboard and pick the client it belongs to. Google, Meta, LinkedIn and TikTok sign in on the vendor's own site, so those need a browser once. After that, linking accounts to clients and building widgets works over the API and MCP server too.
Connect a client's ad accounts, start from a paid reporting template, and send a report that answers what the spend returned.
