








Google Analytics 4
Active, new and total users, sessions and engaged sessions, engagement rate, views, bounce rate, average session duration, conversions and event count — across 143 dimensions.
Web analytics reporting in Oviond turns GA4, PageSpeed Insights, uptime monitoring and privacy-first analytics into one branded client report — how the site performs, how fast it loads, and whether it stayed up.
At a glance
The reporting job is editing, not extraction: pick the handful of numbers that answer the client's question, put speed and uptime next to them, and send the same structure every month.
9
Site and analytics sources
GA4, Matomo, Plausible, Piwik PRO, Microsoft Clarity, PageSpeed Insights, Pingdom, UptimeRobot and WordPress.
143
GA4 dimensions
Alongside 58 metrics — enough to answer a client's follow-up without a new tool.
4
Site templates
A combined website performance layout plus GA4, PageSpeed and WordPress starting points.
The facts an agency needs before shortlisting a reporting tool for this channel — each one dated and owned.
| Fact | Oviond |
|---|---|
| Connectors for this channel | 9 native sources: Google Analytics 4, Google PageSpeed Insights, Matomo, Microsoft Clarity, Pingdom, Piwik Pro, Plausible, UptimeRobot, WordPress |
| Data sources | 70+ marketing data sources, no source credits or per-connection fees |
| Starting price | $40/month billed annually ($50 month-to-month) for 10 clients |
| Pricing model | One plan, every feature included; $5 per client month-to-month or $4 per client billed annually, from 10 to 100 clients self-serve |
| White-label | Included on every plan — unlimited white-label themes |
| Scheduled delivery | Recurring report email delivery and automations included on every plan |
| MCP / AI assistants | Hosted MCP server included on every plan; works across your whole client list from Claude, ChatGPT, or any MCP-ready tool |
| Free trial | 15 days, every feature included, no credit card |
Oviond facts verified September 1, 2026 by Oviond Product. Pricing in USD. See full pricing
Traffic analytics, Core Web Vitals and availability monitoring all connect per client and report on the same date range.
What you can report
Each widget reads the source's own field catalog. For a site report that means behavior, speed and availability can all be real connected data rather than three screenshots.
Active, new and total users, sessions and engaged sessions, engagement rate, views, bounce rate, average session duration, conversions and event count — across 143 dimensions.
Largest Contentful Paint, Cumulative Layout Shift, First Contentful Paint, Total Blocking Time and Speed Index, plus the four Lighthouse scores for performance, accessibility, best practices and SEO.
Pingdom and UptimeRobot report average response time, uptime and downtime — the evidence for a slow month that had nothing to do with the marketing.
Matomo, Plausible and Piwik PRO connect the same way as GA4, so clients running cookieless or self-hosted analytics get the same report structure.
Behavioral signals from Clarity sit alongside the traffic numbers, for the clients who want to know how people used a page and not only how many arrived.
Visitors, views, comments, posts published, followers and shares straight from the CMS — useful on content retainers where publishing volume is part of the deliverable.
Three habits that turn a strong month into an unreadable page.
Exporting every GA4 report into the deck
Pick the metrics tied to the client's goal and drop the rest
Traffic reported with no site context
Put speed and uptime beside it so dips have an explanation
Giving the client a GA4 login and hoping
Send a live link to a report built for them to read
Connect the client's analytics property and the recurring site report builds itself.
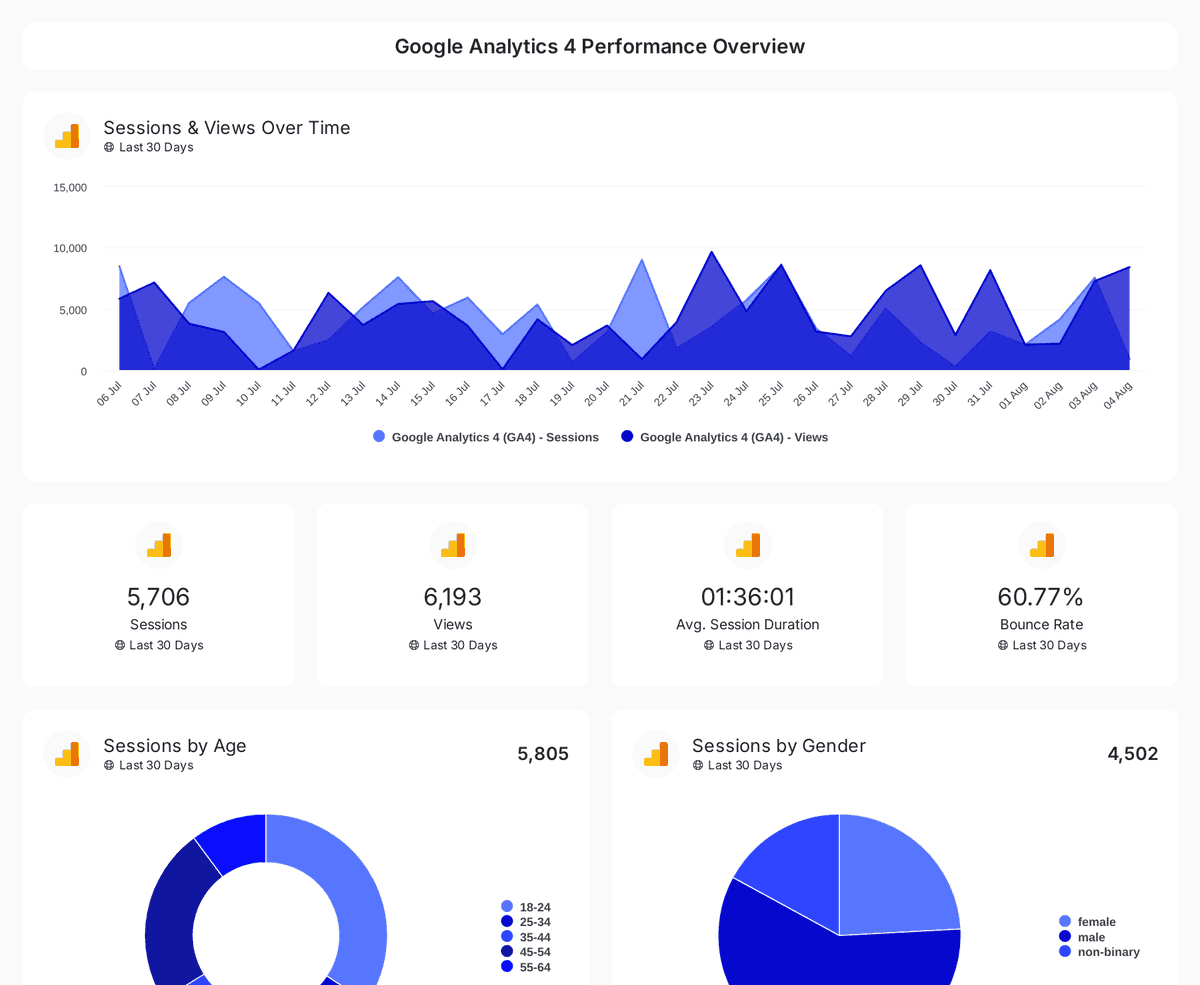
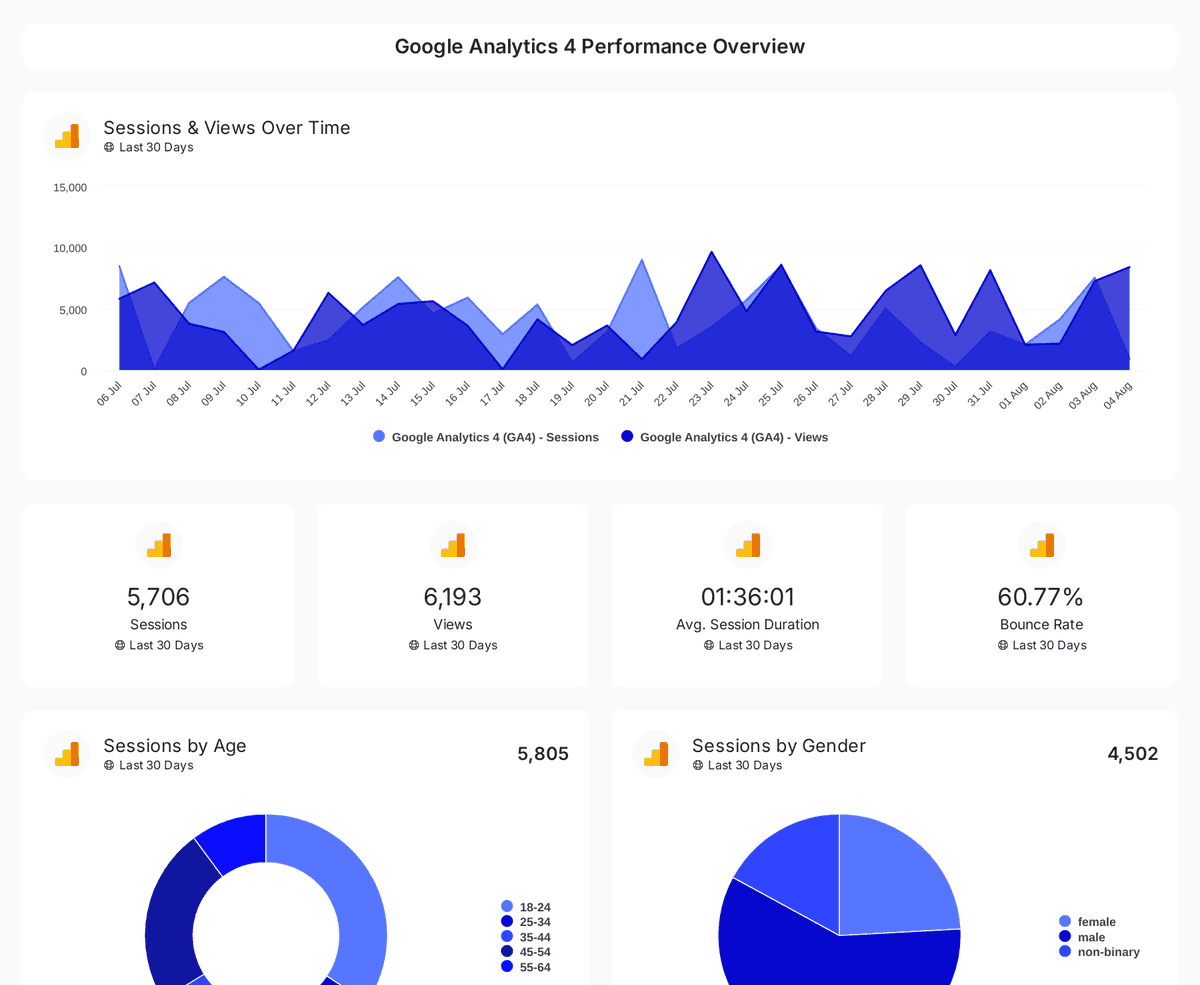
Monitor website traffic, user demographics, and page performance with insights from Google Analytics 4, Search Console, and Page Speed Insights.
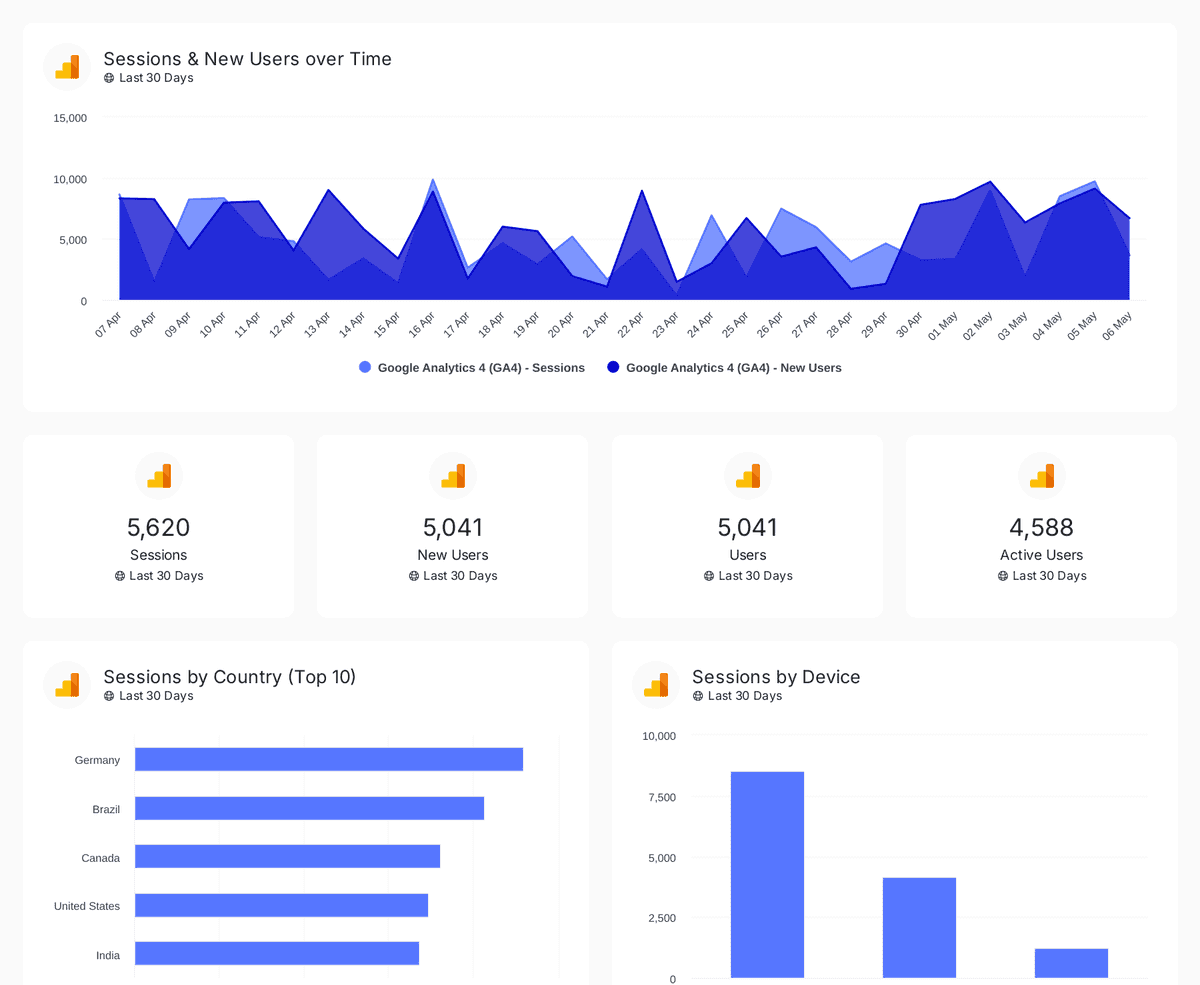
Track sessions, users, and traffic sources with insights by country, device, age, gender, and channel performance analysis
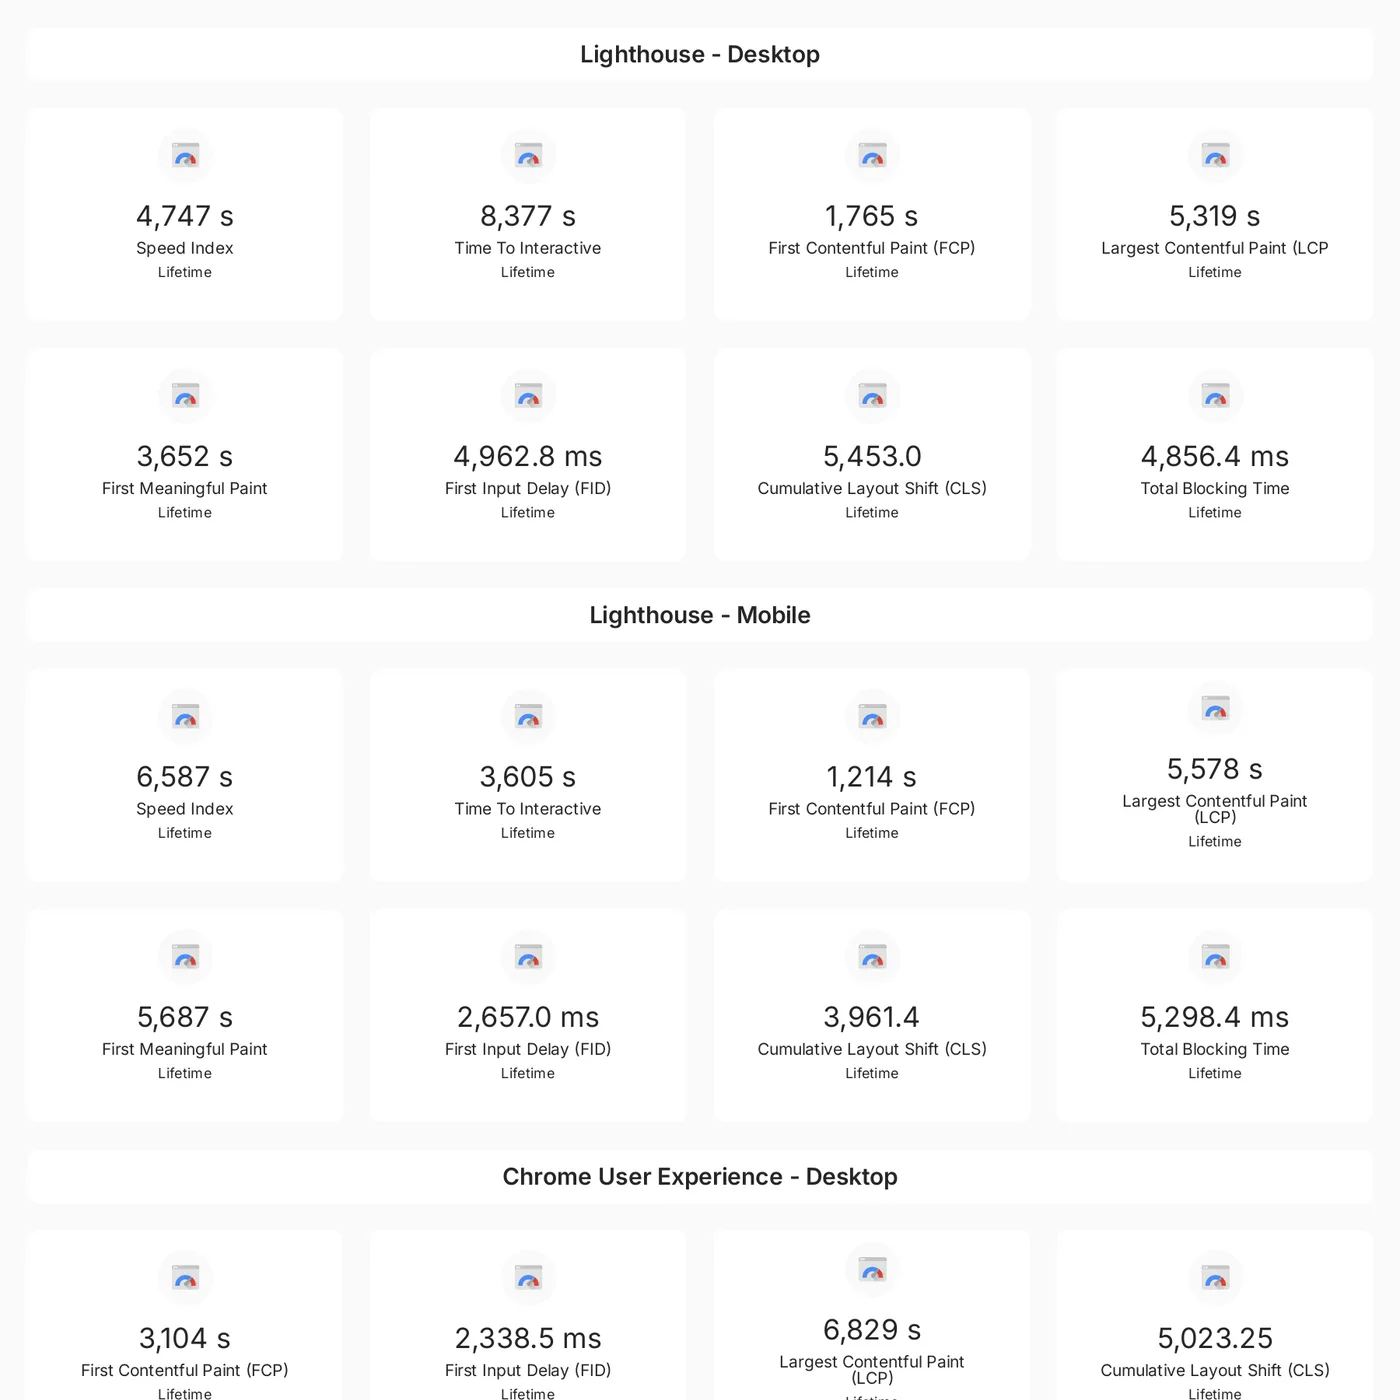
Track performance metrics like FCP, LCP, FID, and CLS across desktop and mobile to monitor user experience over time
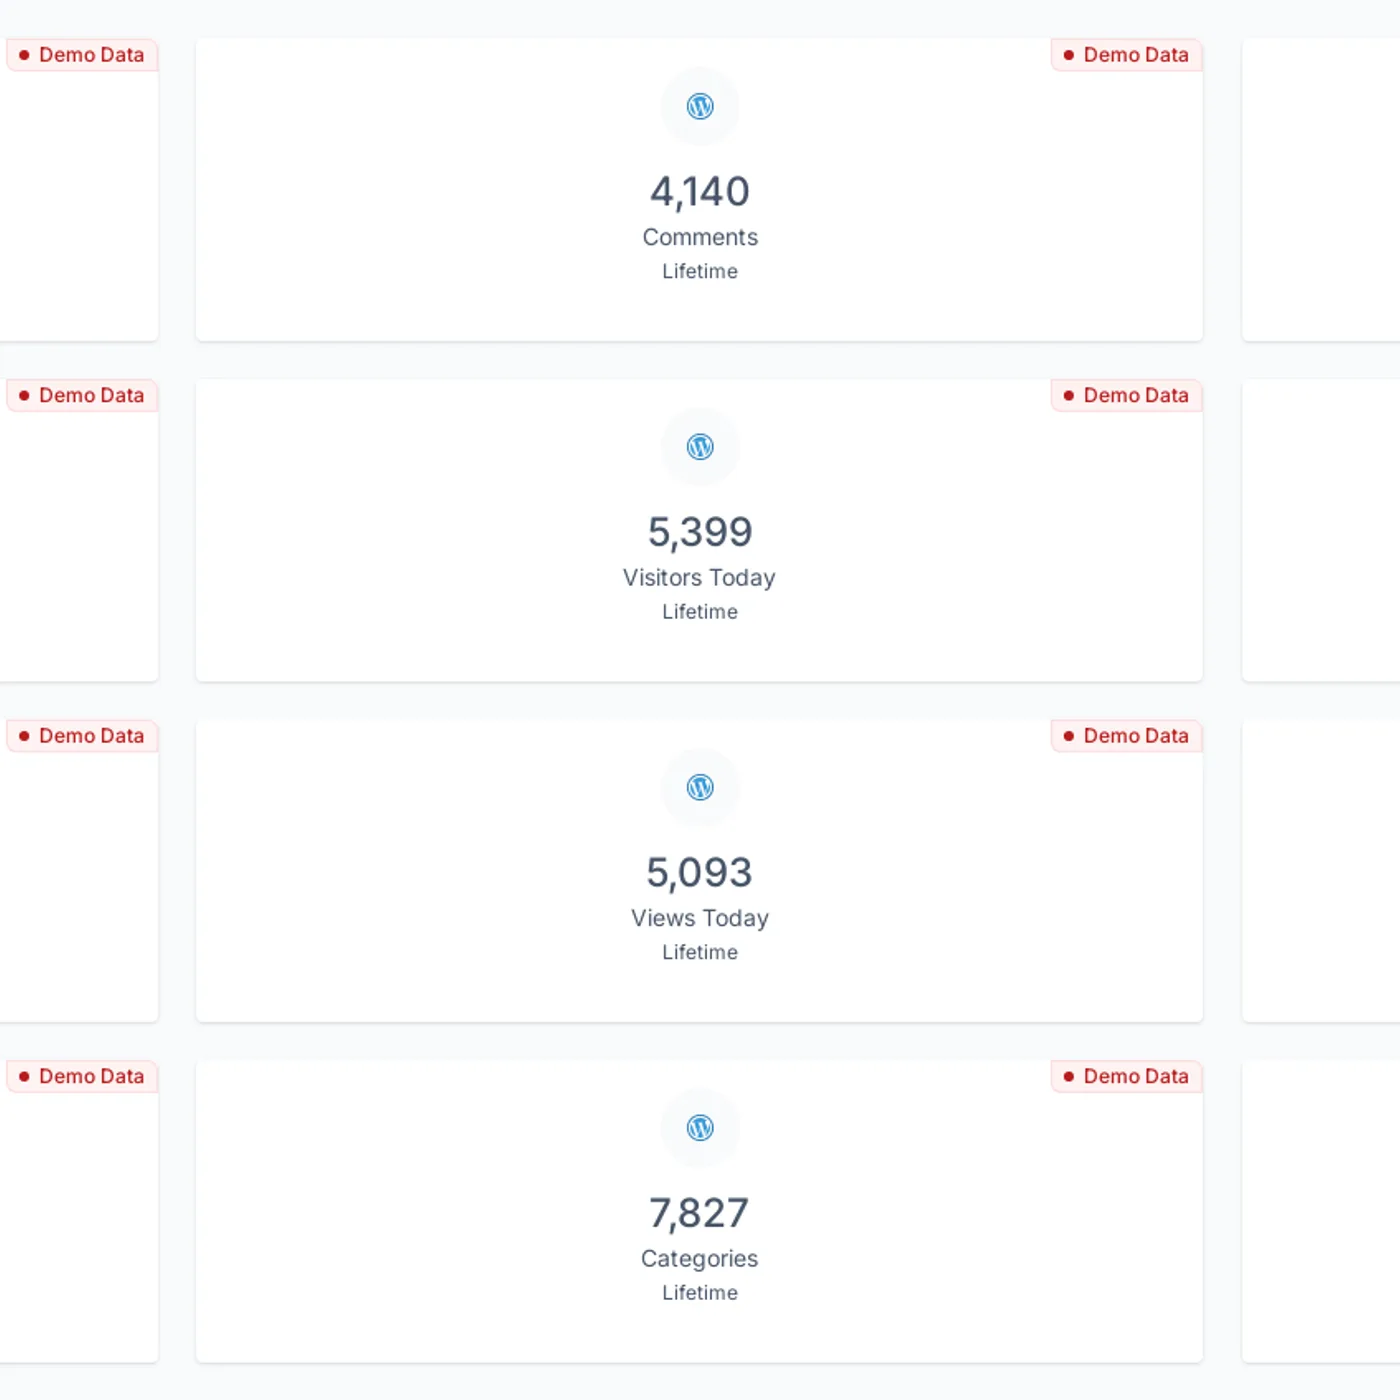
Track key WordPress metrics, including posts, comments, shares, visitors, views, and engagement trends over time.
Edit hard at the start, and the rest of the year takes care of itself.
Drag in the traffic tiles, channel tables and speed scores that matter, and use headings and commentary to say what each section means.
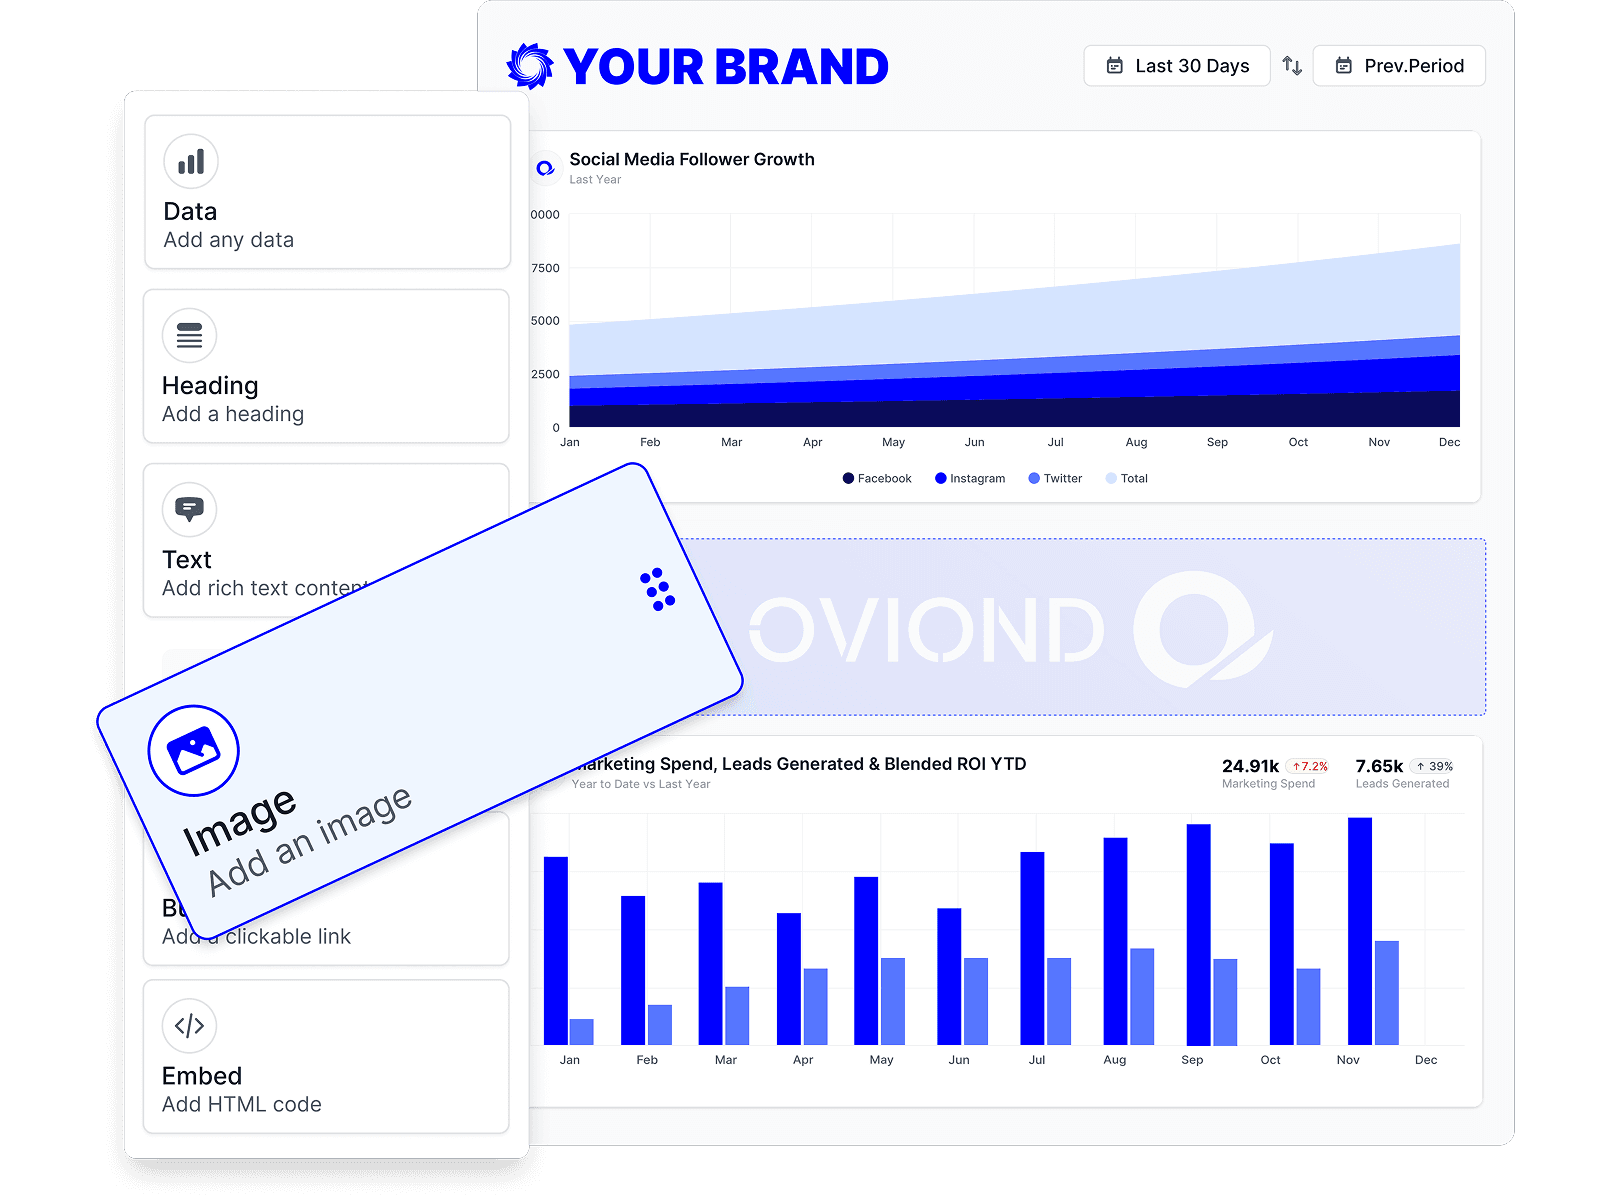
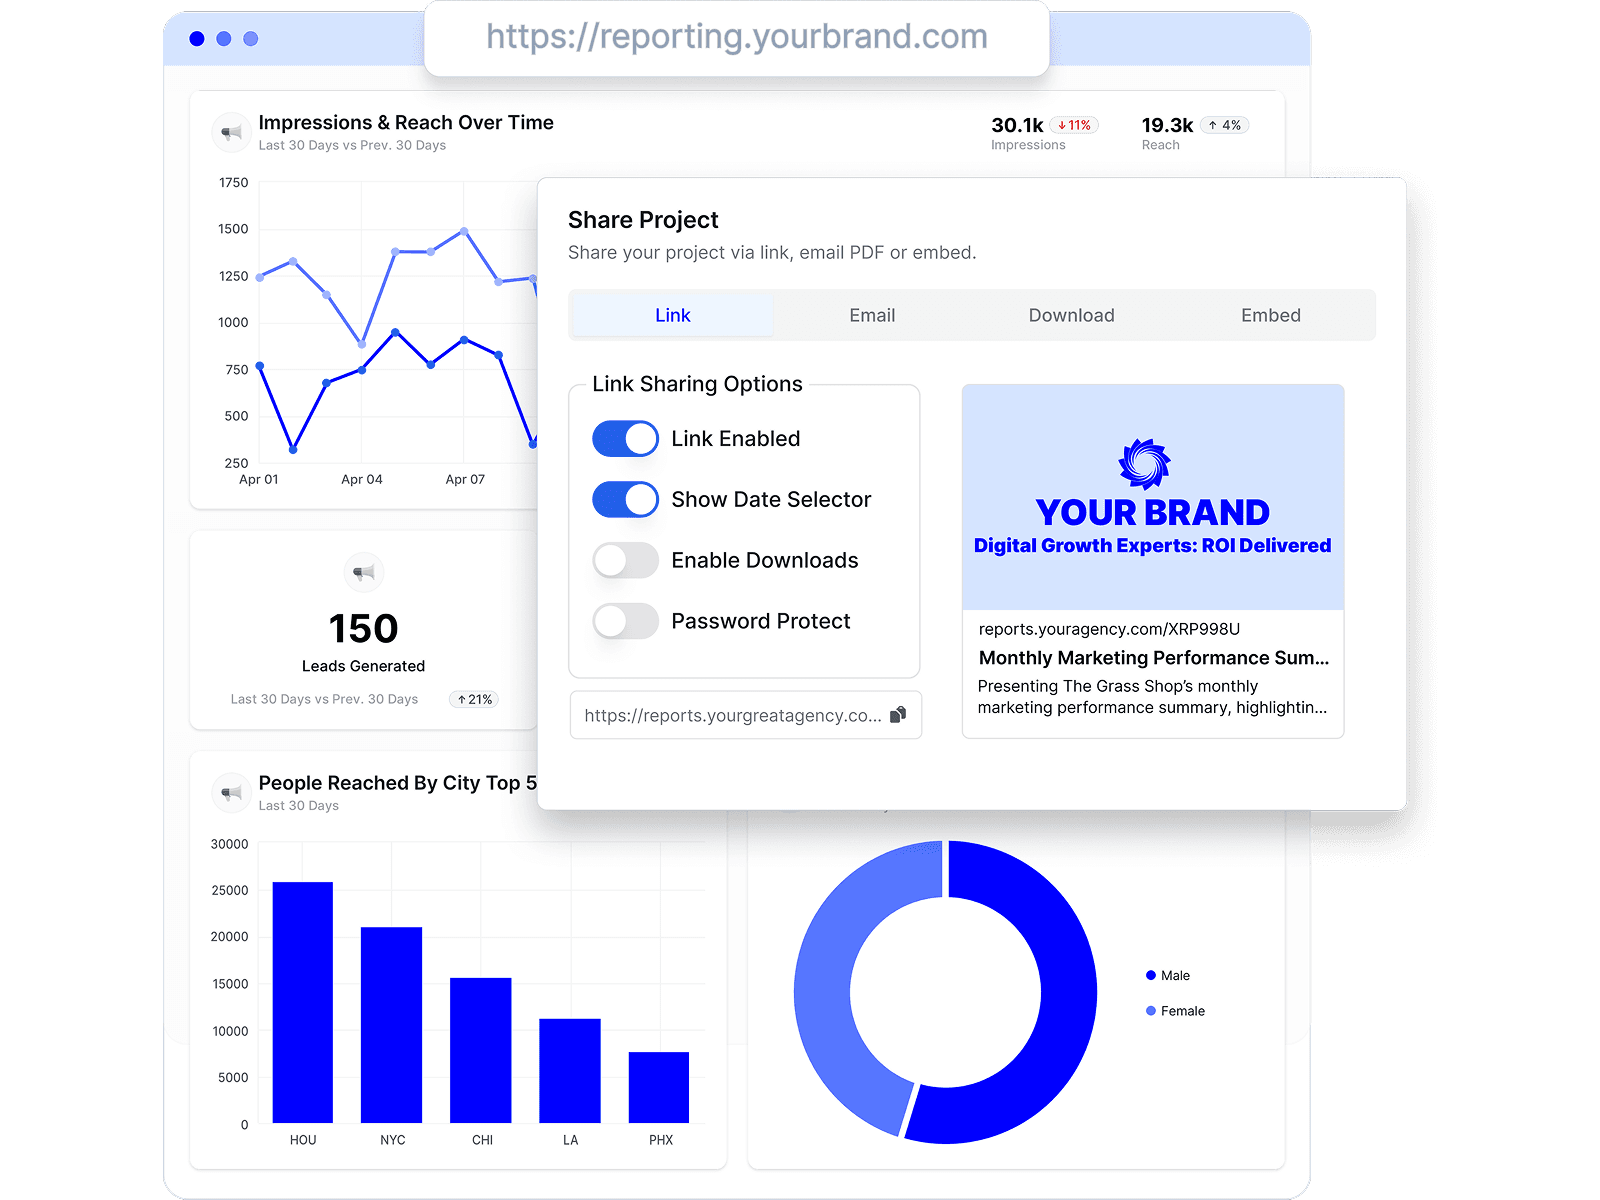
A dashboard covers the weeks between reports: one always-current view the client can open instead of asking for an interim update.
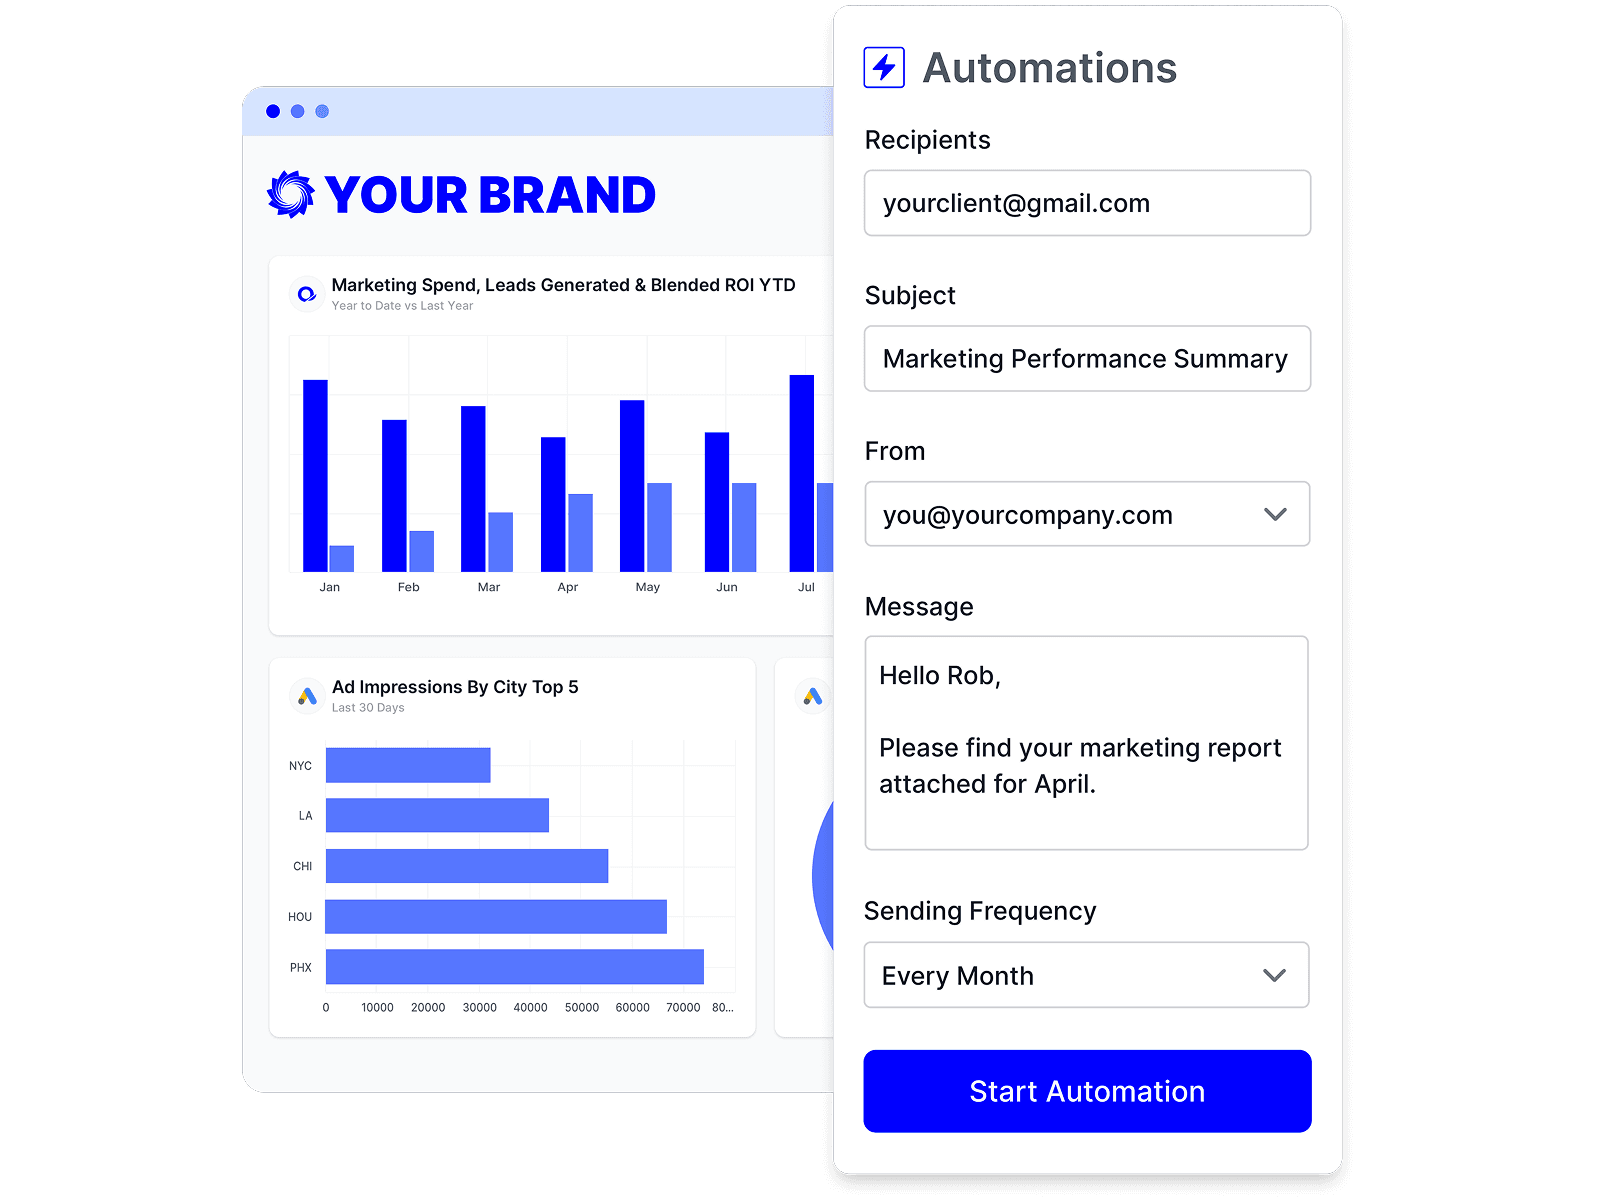
Set daily, weekly or monthly delivery and the report renders fresh for the new period on every run.
Traffic is evidence, not the outcome. Put analytics after paid ads, social and SEO to show what the channels sent, and before e-commerce revenue or leads and calls to show what the sessions became. For the report that holds all of it, see all-in-one client reporting.
What agencies ask about reporting site performance to clients.
Google Analytics 4, Matomo, Plausible, Piwik PRO and Microsoft Clarity for behavior; Google PageSpeed Insights for speed; Pingdom and UptimeRobot for availability; and WordPress for publishing activity.
Active, new and total users, sessions and engaged sessions, engagement rate, views, bounce rate, sessions per user, average session duration, conversions, event count and event value — with 143 dimensions to break them down by.
Yes. PageSpeed Insights reports Largest Contentful Paint, Cumulative Layout Shift, First Contentful Paint, Total Blocking Time and Speed Index, along with the four Lighthouse category scores, from both its Lighthouse and Chrome user-experience views.
Yes. Pingdom and UptimeRobot report average response time, uptime and downtime, which is the evidence for a month where traffic dipped for reasons outside the campaign.
Yes. Matomo, Plausible and Piwik PRO connect the same way GA4 does, so clients running privacy-first or self-hosted analytics get the same report structure without an exception in your workflow.
Both, at different moments. A dashboard is one always-current view for status between reports; a multi-page report explains a period with your commentary. Oviond builds both from the same connected data.
Whatever the connected account holds. Oviond does not add its own history window — retrievable data depends on the source platform's API and the retention settings on that property.
No. Oviond is the reporting layer, not an analytics platform. It connects GA4 and the alternatives and turns their data into branded, automated client reports and dashboards.
Connect the client's analytics, speed and uptime sources, and send one site report instead of three exports.