





Shopify
Total, gross and net sales with discounts, returns, shipping and taxes broken out, plus cost of goods sold, amount spent per customer, and first-time versus returning sales.
E-commerce reporting in Oviond connects Shopify, WooCommerce, Stripe, PayPal and Xero, so a client report can finish on sales, orders and margin rather than on sessions and clicks.
At a glance
Store owners read the revenue line before anything else. Connecting the store and the payment processor puts that line in the same report as the marketing that produced it, instead of in a separate tab the client opens on their own.
5
Store and payment sources
Shopify, WooCommerce, Stripe, PayPal and Xero, connected per client.
220+
Shopify sales fields
Gross and net sales, discounts, returns, cost of goods sold and more, across 230 dimensions.
3
Revenue templates
A combined e-commerce layout plus Stripe and PayPal starting points.
The facts an agency needs before shortlisting a reporting tool for this channel — each one dated and owned.
| Fact | Oviond |
|---|---|
| Connectors for this channel | 5 native sources: PayPal, Shopify, Stripe, WooCommerce, Xero |
| Data sources | 70+ marketing data sources, no source credits or per-connection fees |
| Starting price | $40/month billed annually ($50 month-to-month) for 10 clients |
| Pricing model | One plan, every feature included; $5 per client month-to-month or $4 per client billed annually, from 10 to 100 clients self-serve |
| White-label | Included on every plan — unlimited white-label themes |
| Scheduled delivery | Recurring report email delivery and automations included on every plan |
| MCP / AI assistants | Hosted MCP server included on every plan; works across your whole client list from Claude, ChatGPT, or any MCP-ready tool |
| Free trial | 15 days, every feature included, no credit card |
Oviond facts verified September 1, 2026 by Oviond Product. Pricing in USD. See full pricing
Connect the storefront and whatever takes the money. Both report into the same client report on the same date range.
What you can report
Each widget reads the platform's own field catalog, which for a store means the accounting-grade fields — not just an order count.
Total, gross and net sales with discounts, returns, shipping and taxes broken out, plus cost of goods sold, amount spent per customer, and first-time versus returning sales.
Sales split by first-order sales channel, referring channel, market, currency, fulfillment status and more — so the report can show which channel actually brought the money in.
Sales, orders, items, tax, shipping and discounts, with net sale, total refunded and average gross daily sales, plus separate orders and customers views.
Gross and net volume, monthly recurring revenue, average revenue per user, successful payments, new customers and refunds — the subscription figures a store report usually misses.
Sales, transactions, average sale value and customers, for the clients whose checkout runs through PayPal alongside or instead of a card processor.
Opening balance, cash received, cash spent and closing balance, when the client wants the marketing report to reconcile against what the books actually show.
Three mismatches that come up on every e-commerce account.
Platform-reported conversions that overstate the total
Report the store's own sales figures beside the ad platforms' claims
Headline revenue that ignores refunds and discounts
Report gross and net sales with returns and discounts broken out
ROAS calculated in a spreadsheet after the fact
Define it once as a calculated metric and it recalculates every run
Connect the store and the processor, and the recurring revenue report builds itself.
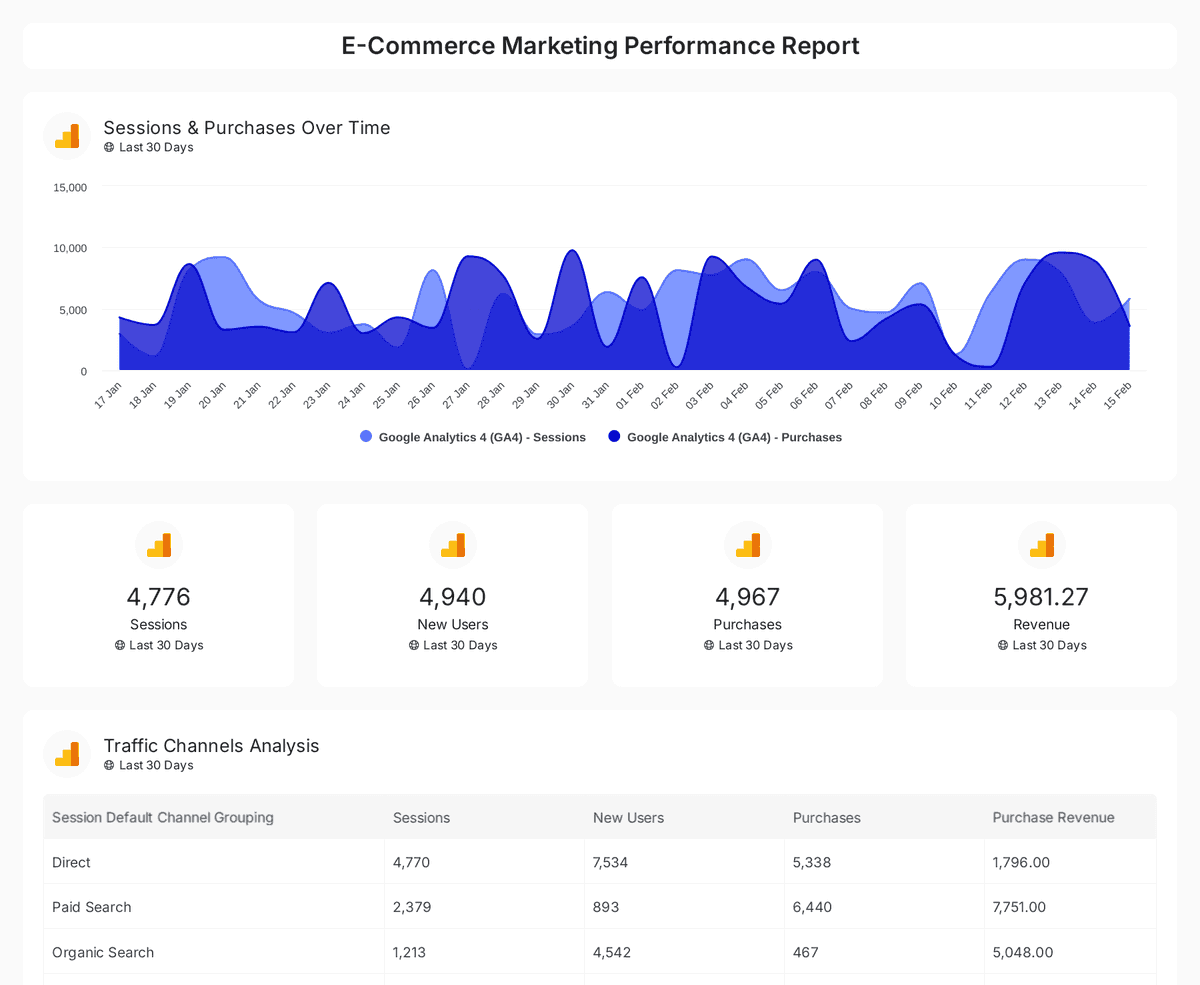
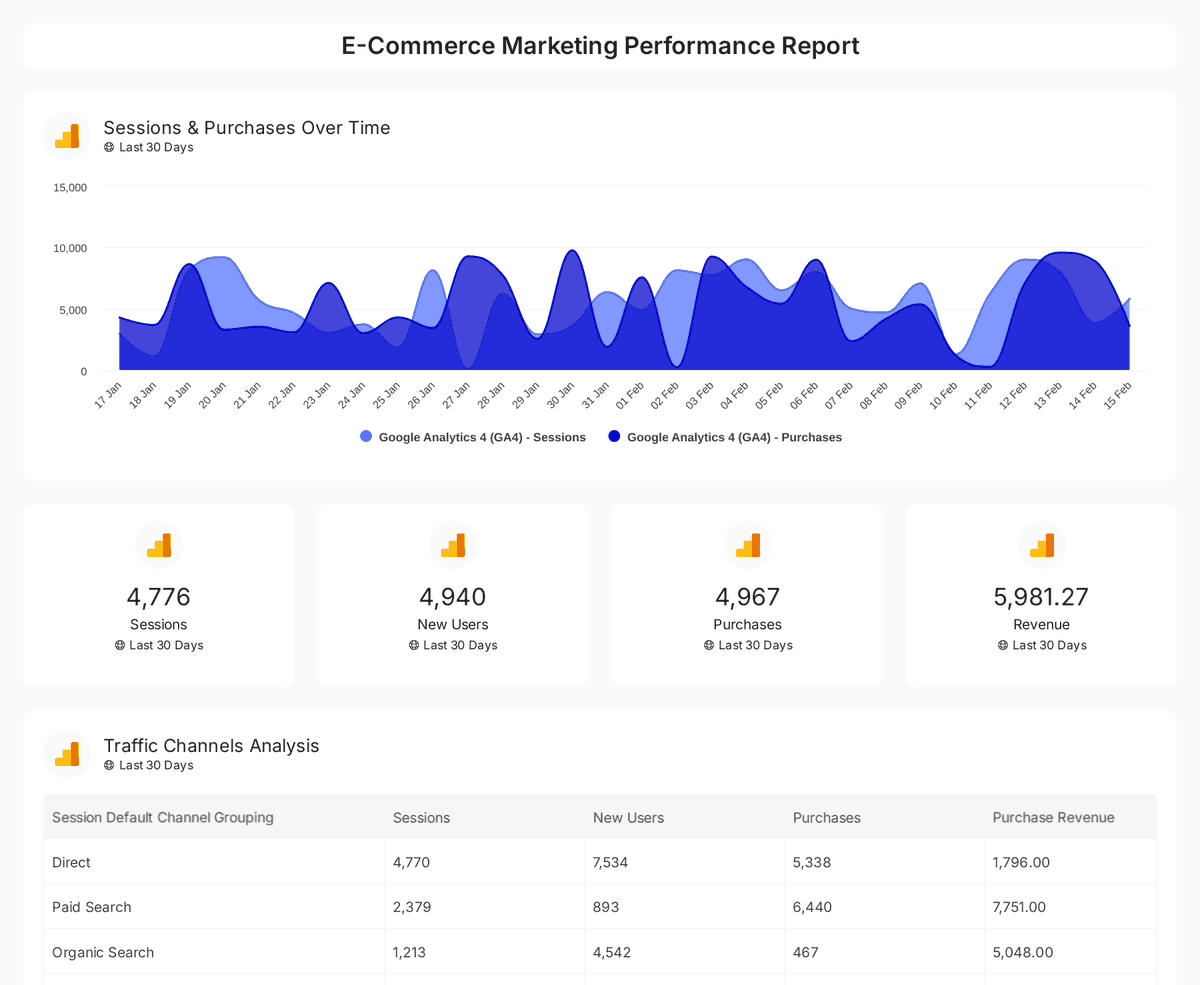
Analyze e-commerce sales, conversions, and traffic insights with interactive, real-time performance metrics.
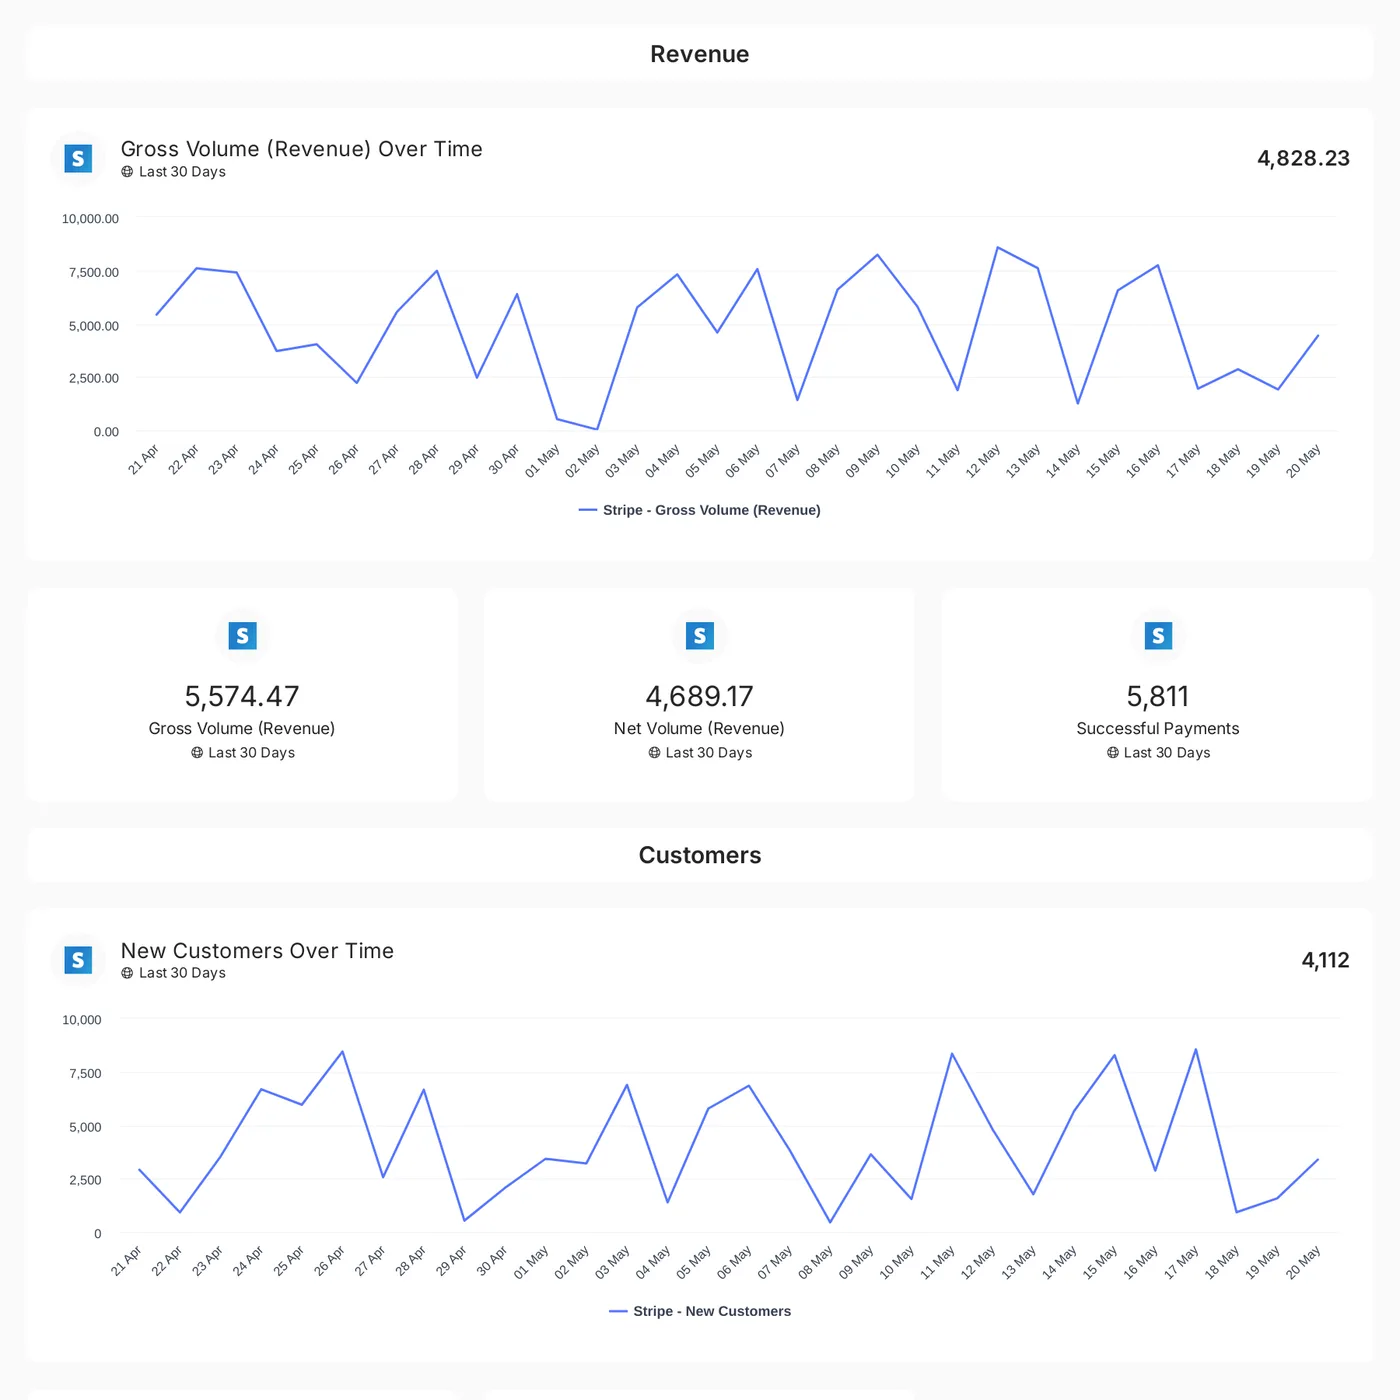
Monitor Stripe revenue, payments, and customer trends with key metrics like gross volume, net volume, and new customers over time.
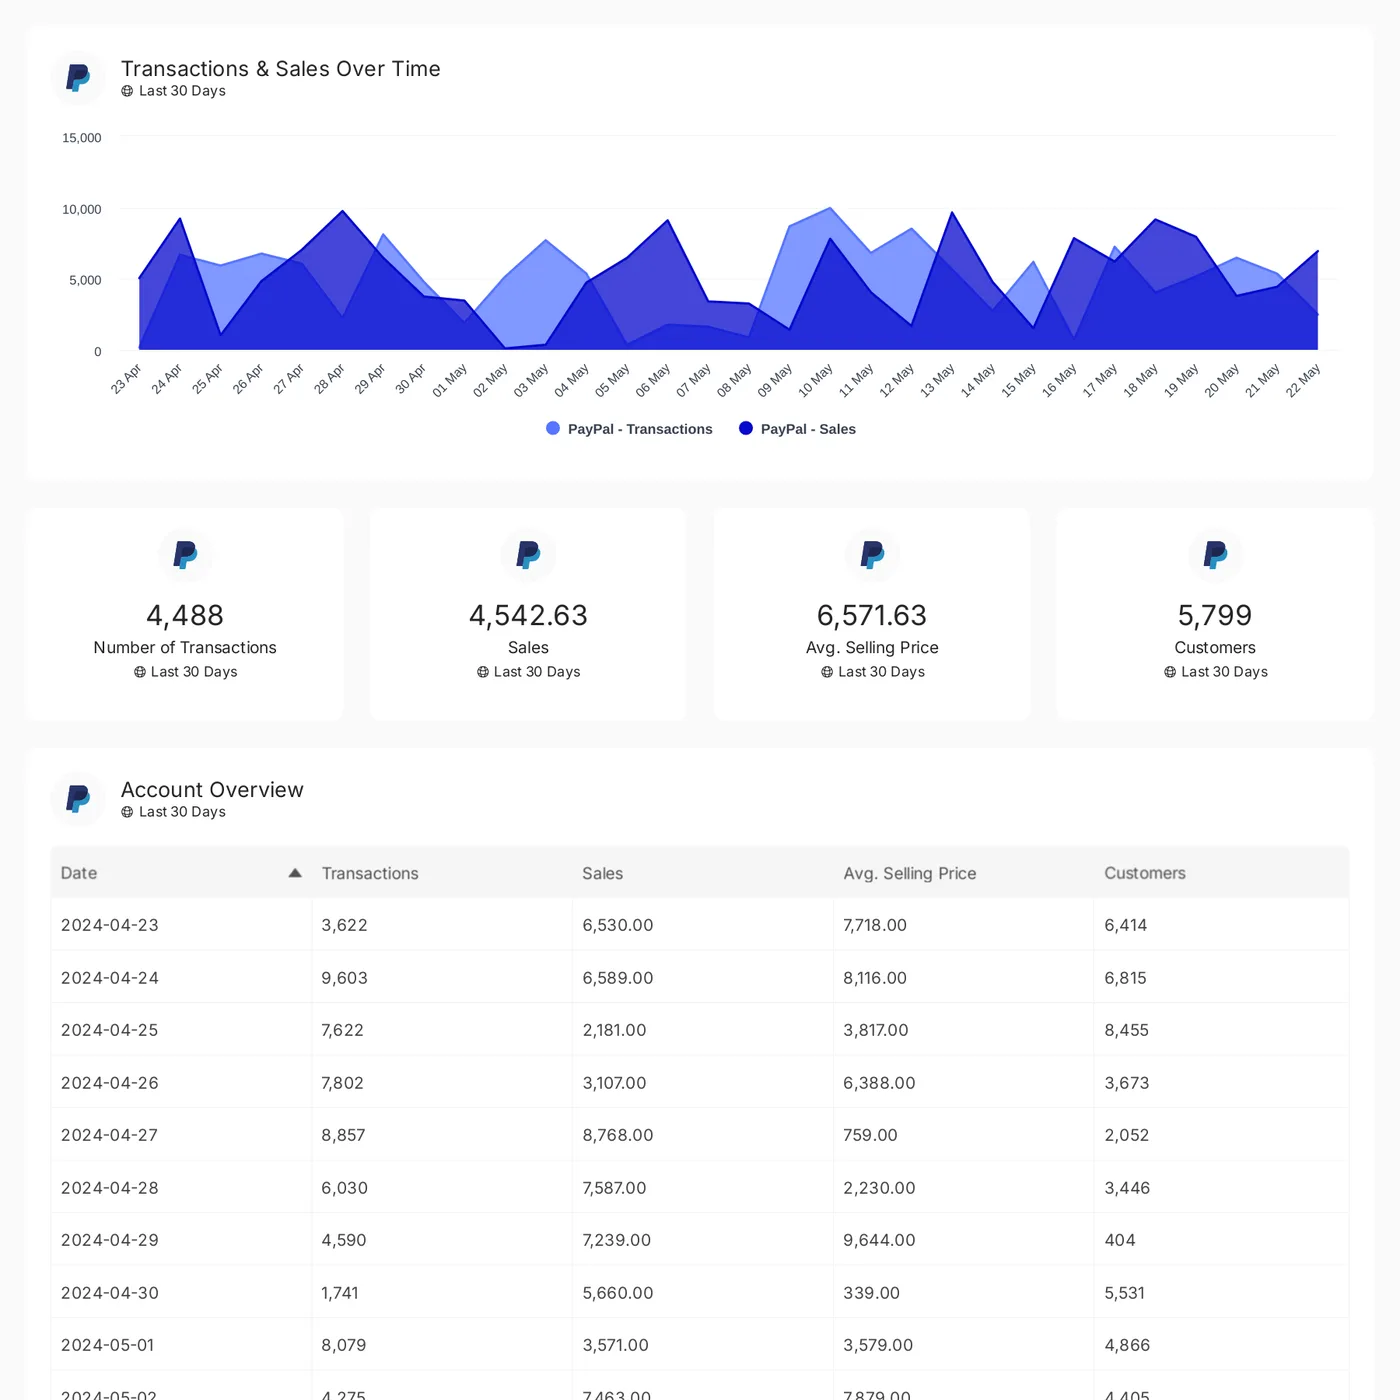
Track PayPal transactions, sales, and customer activity over time for key insights into account performance.
Define the maths once and it recalculates every time the report renders.
A calculated metric formula can divide store revenue by ad spend from a different platform, format the result as currency or a percentage, and behave like any other field.
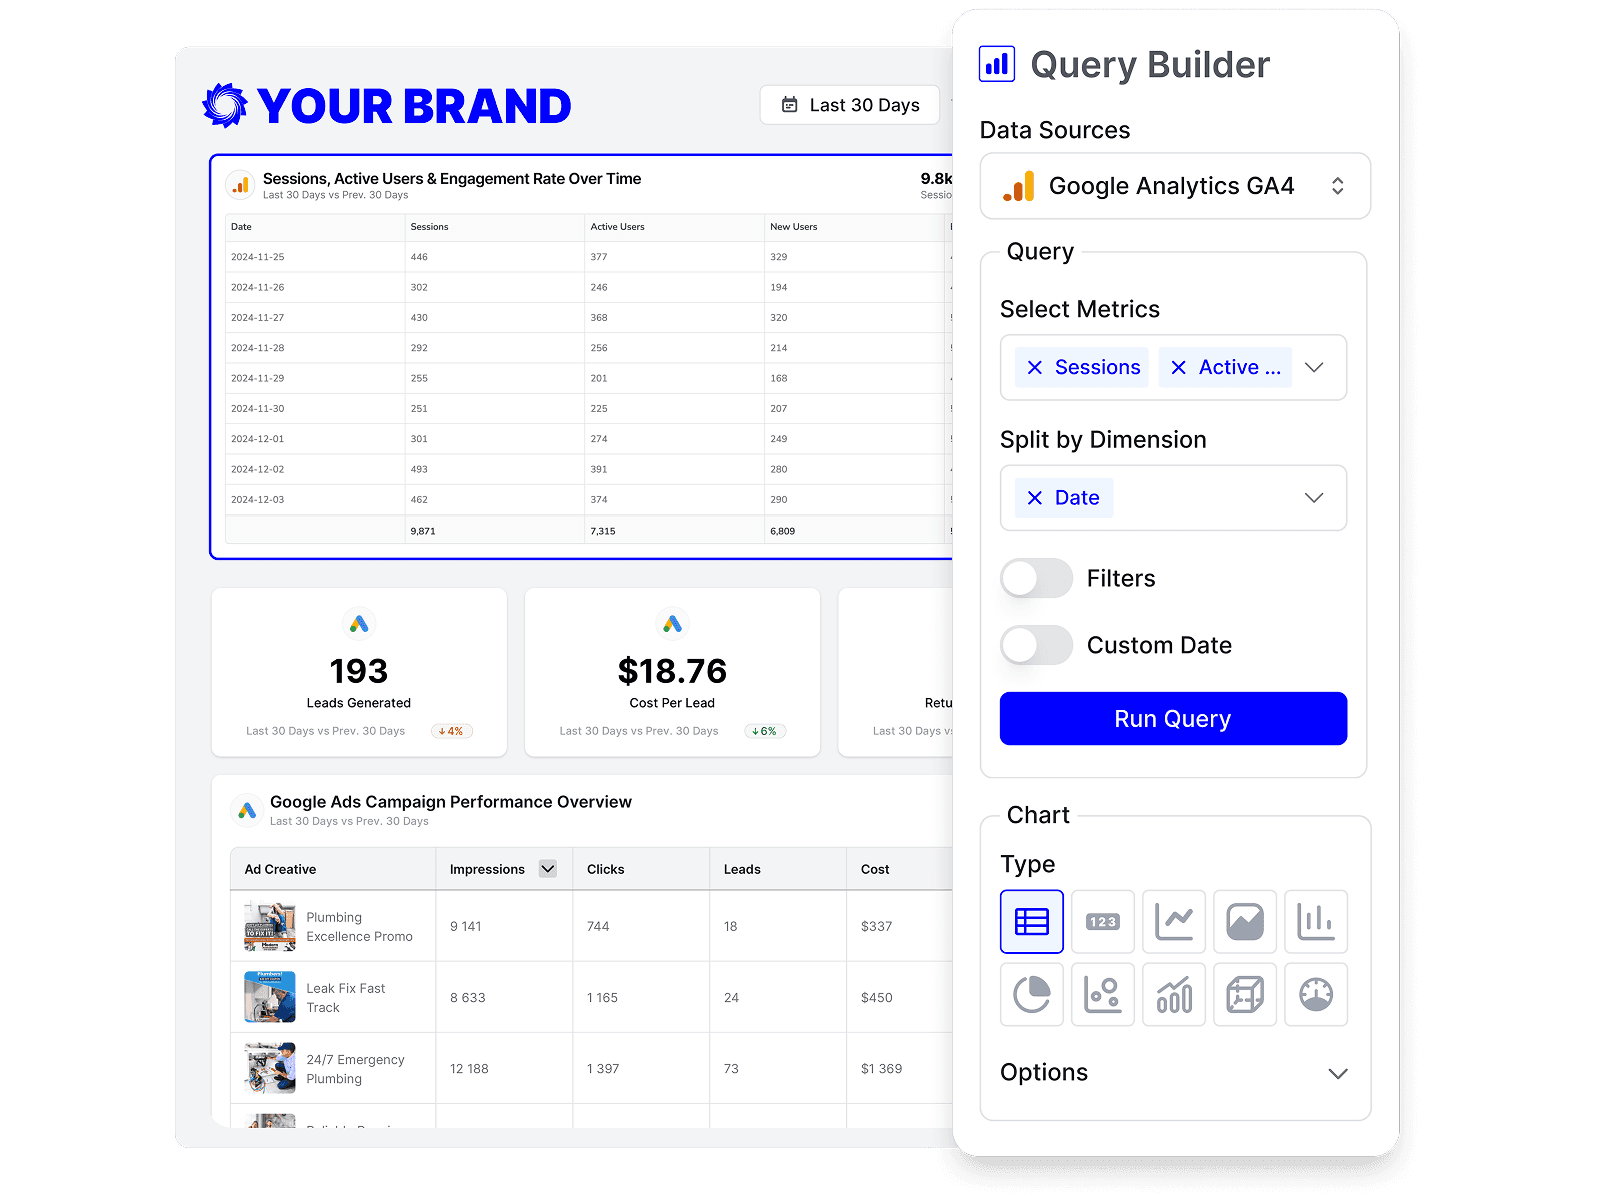
Drag in sales tiles, channel tables and product breakdowns, then add the commentary explaining what drove the month.
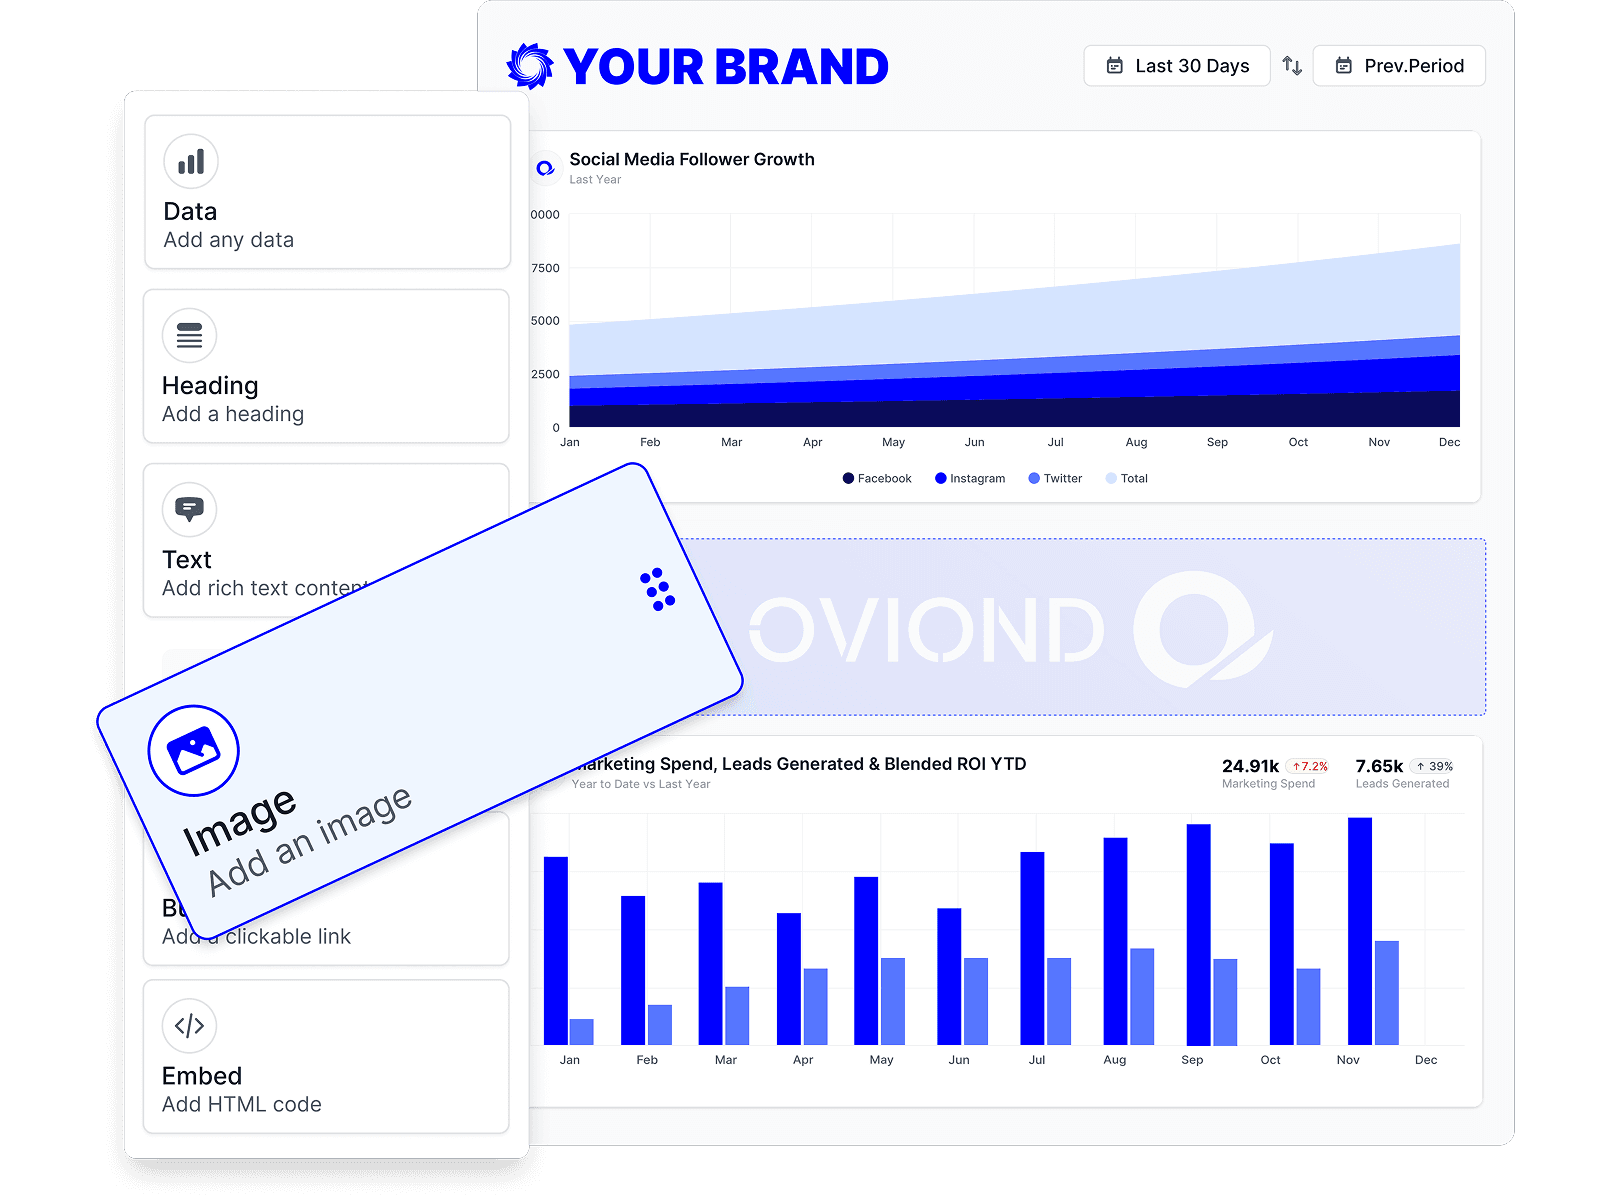
Set daily, weekly or monthly delivery. Store clients often want daily during a sale and monthly the rest of the year.

Sales figures answer what happened; the marketing channels answer why. Put the store next to paid ads for true ROAS, next to email marketing for the sends that converted, and next to web analytics for the funnel in between. All-in-one client reporting shows how the whole account fits in one document.
What agencies ask about reporting store performance to clients.
Shopify and WooCommerce for the storefront, and Stripe, PayPal and Xero for payments and cash position. Each connects to a client separately and reports into the same client report.
Shopify publishes total, gross and net sales with discounts, returns, shipping and taxes broken out, plus cost of goods sold, amount spent per customer, and first-time versus returning sales. WooCommerce publishes sales, orders, items, refunds and average gross daily sales. Stripe adds monthly recurring revenue and average revenue per user.
Yes, and this is the main reason to connect the store. Build a calculated metric that divides store revenue by ad spend — each token in the formula is its own data-source query, so the two can come from different platforms. It then recalculates on every report run.
Because they count differently: ad platforms attribute on their own windows and models, while the store counts orders. Oviond reports both figures as each source publishes them rather than reconciling them for you — showing the two side by side, with a note on the difference, is the honest way to present it.
Yes. Shopify exposes first-order sales channel and referring channel as dimensions, alongside market, currency and fulfillment status, so a widget can show which channel the revenue actually came through.
Yes, through Stripe: monthly recurring revenue, average revenue per user, new customers, successful payments and refunds, with separate views for balance transactions, subscriptions, customers and refunds.
Yes. Upload a CSV or JSON dataset of up to 10,000 rows as custom data and map its columns to a widget's metrics and dimensions, so revenue that lives outside the storefront still appears in the report.
Yes. Schedule daily, weekly or monthly delivery. The reporting period is a preset that re-resolves on each run, so a monthly report always covers the most recent complete month.
Connect the client's store and payment processor, and send a report that ends on what the marketing actually sold.