









Facebook Pages
New followers and unfollows, total reach split into paid, organic and viral, page post engagements, and post- and video-level breakdowns for the content that actually landed.
Social media reporting in Oviond brings Facebook, Instagram, LinkedIn, YouTube, TikTok, X, Pinterest and Google Business Profile into one branded client report — reach, engagement and follower growth, per network and combined.
At a glance
Every network measures itself differently, exports differently, and keeps a different window of history. Connect each one to the client and Oviond reports them together, on one date range, in your branding.
9
Social sources
Facebook, Instagram, LinkedIn, YouTube, TikTok, X, Pinterest, Google Business Profile and Mention.
200
Facebook Page fields
Page, post, video and event views, so a report can go well past follower count.
8
Social templates
Per-network layouts plus a combined social marketing report to start from.
The facts an agency needs before shortlisting a reporting tool for this channel — each one dated and owned.
| Fact | Oviond |
|---|---|
| Connectors for this channel | 9 native sources: Facebook, Google Business Profile, Instagram, LinkedIn, Mention, Pinterest, TikTok, X (Twitter), YouTube |
| Data sources | 70+ marketing data sources, no source credits or per-connection fees |
| Starting price | $40/month billed annually ($50 month-to-month) for 10 clients |
| Pricing model | One plan, every feature included; $5 per client month-to-month or $4 per client billed annually, from 10 to 100 clients self-serve |
| White-label | Included on every plan — unlimited white-label themes |
| Scheduled delivery | Recurring report email delivery and automations included on every plan |
| MCP / AI assistants | Hosted MCP server included on every plan; works across your whole client list from Claude, ChatGPT, or any MCP-ready tool |
| Free trial | 15 days, every feature included, no credit card |
Oviond facts verified September 1, 2026 by Oviond Product. Pricing in USD. See full pricing
Organic profiles, video, local presence and brand mentions. Connect each to the client once and it feeds the same report from then on.
What you can report
Each widget reads that network's own field catalog, so you report what the platform publishes rather than a lowest-common-denominator set of six metrics.
New followers and unfollows, total reach split into paid, organic and viral, page post engagements, and post- and video-level breakdowns for the content that actually landed.
Followers, reach, likes, comments and saves, plus engagement rate calculated by reach or by followers, profile views, website clicks and follower age, gender and city.
Page impressions, clicks and engagement rate, likes, comments and shares, and new followers split into organic and sponsored — the distinction B2B clients ask about.
Views, estimated hours watched, average view duration and average viewer percentage, subscribers gained and lost, with traffic source, playback location, device and demographic views.
TikTok gives video views, engaged audience, new and lost followers and bio link clicks. X gives followers, impressions, retweets, quote tweets, URL link clicks and video views.
Impressions on Maps and Search split by desktop and mobile, call clicks, direction requests, website clicks and bookings — plus separate reviews and search-keywords views for local clients.
Three problems that come from the networks, not from your team.
A separate native dashboard per network
Every network reports into one client report on one date range
Screenshots pasted into a slide deck each month
Live widgets that re-query every time the report is opened
Follower counts that say nothing about the work
Report reach, engagement rate and profile actions alongside them
Pick a layout, connect the client's profiles, and the recurring social report builds itself.
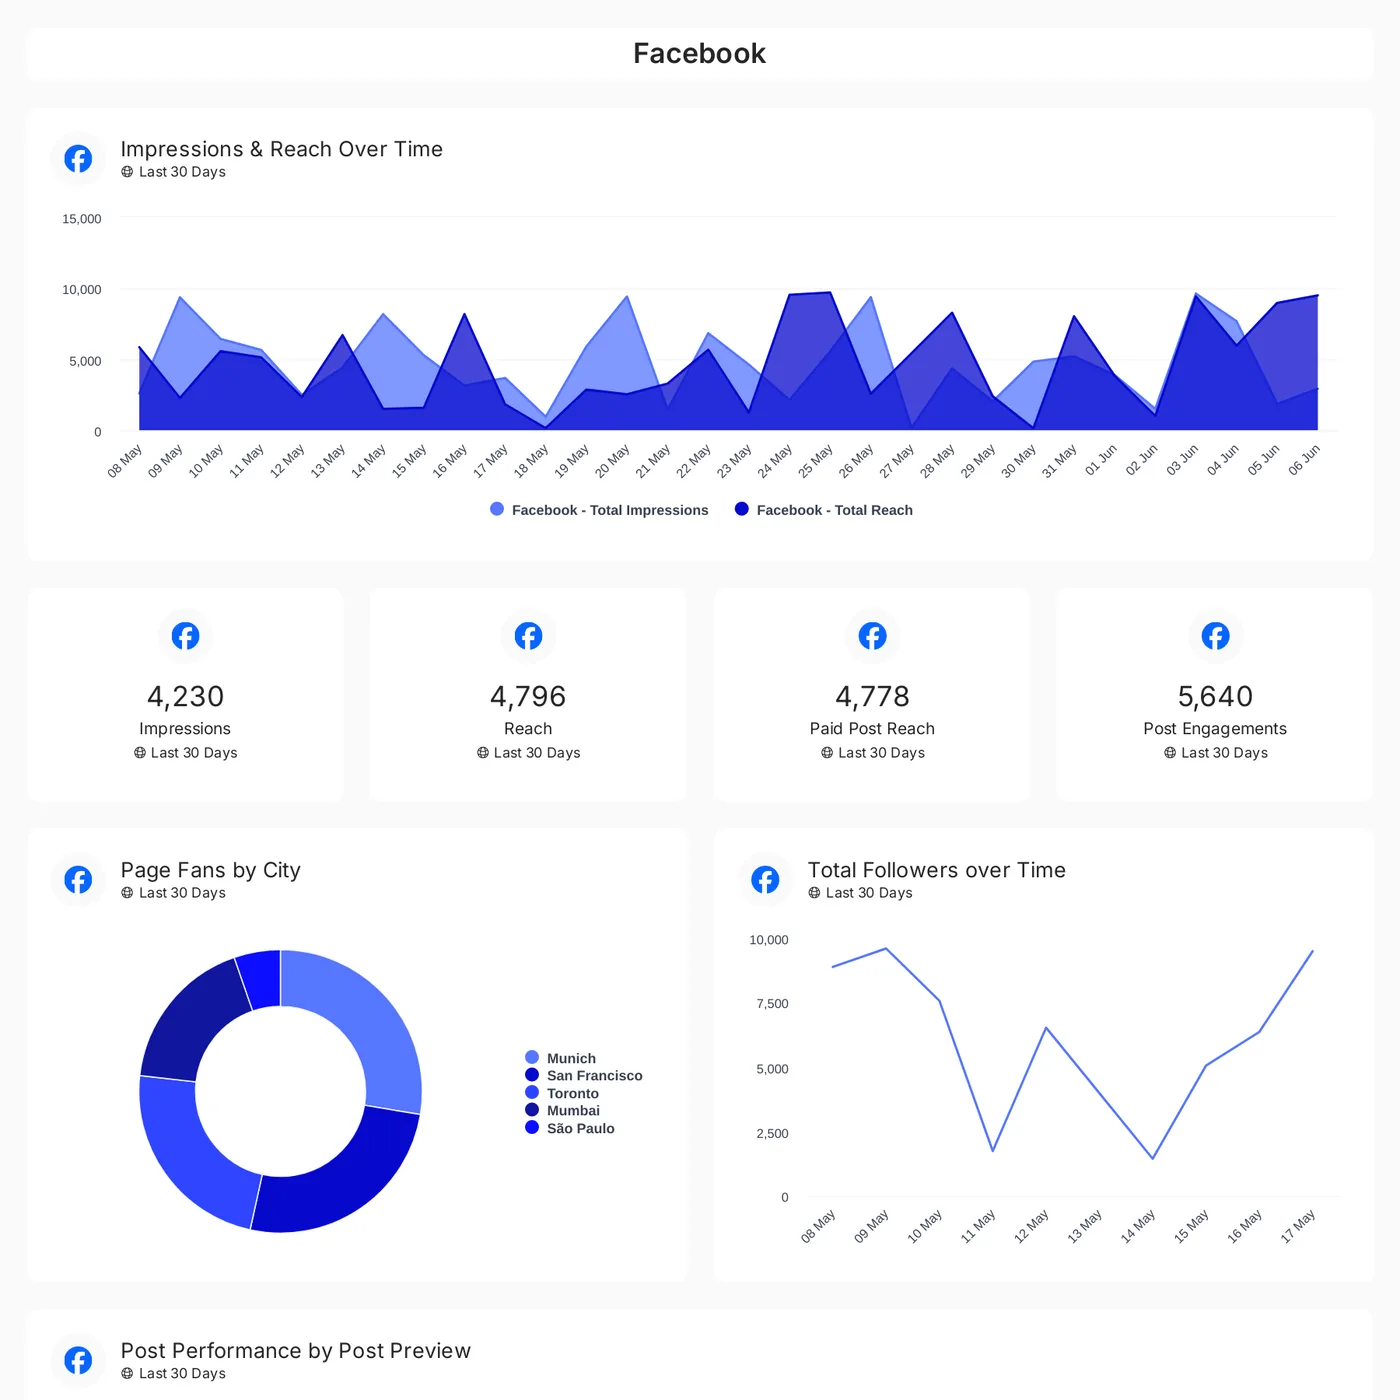
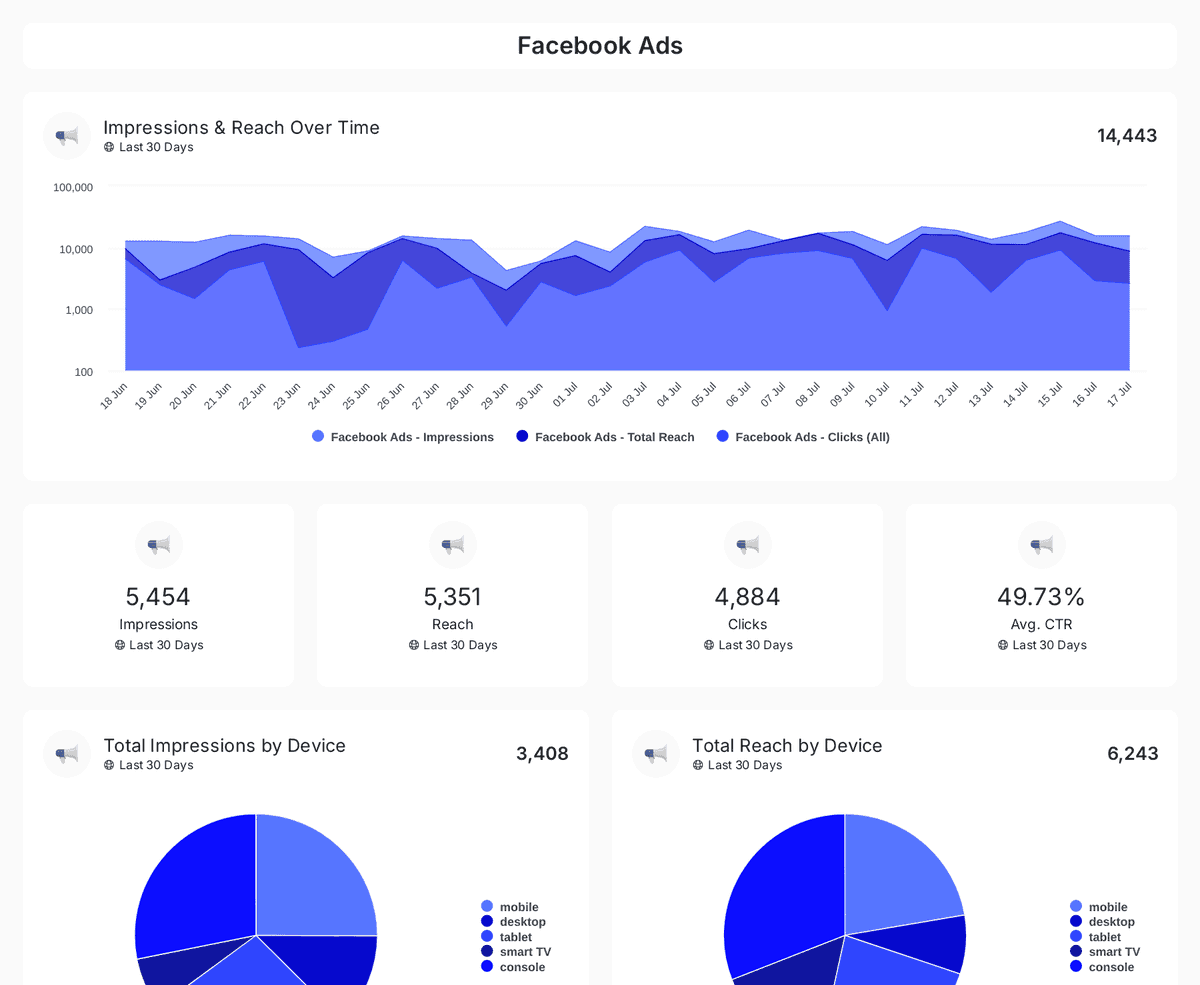
Track impressions, reach, engagement, and follower growth across multiple social media platforms for a comprehensive performance overview.
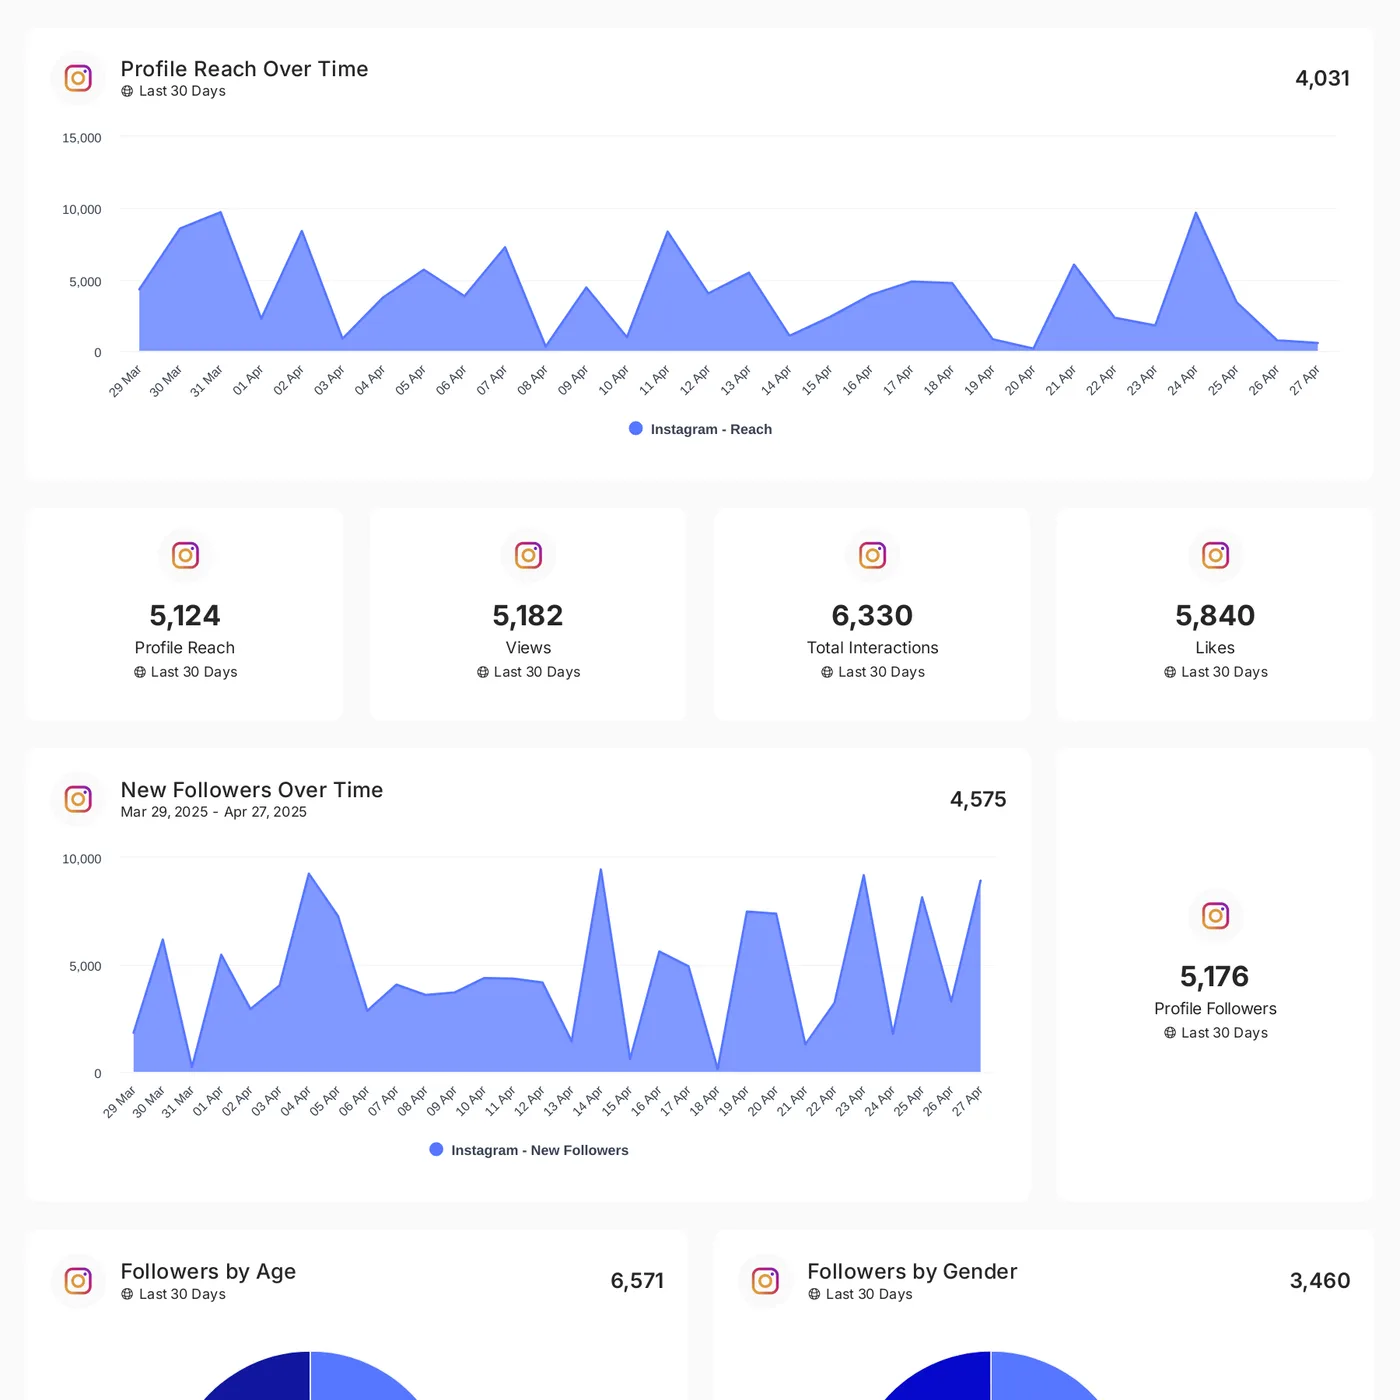
Track Instagram performance with insights on reach, impressions, follower growth, demographics, and location breakdowns over time
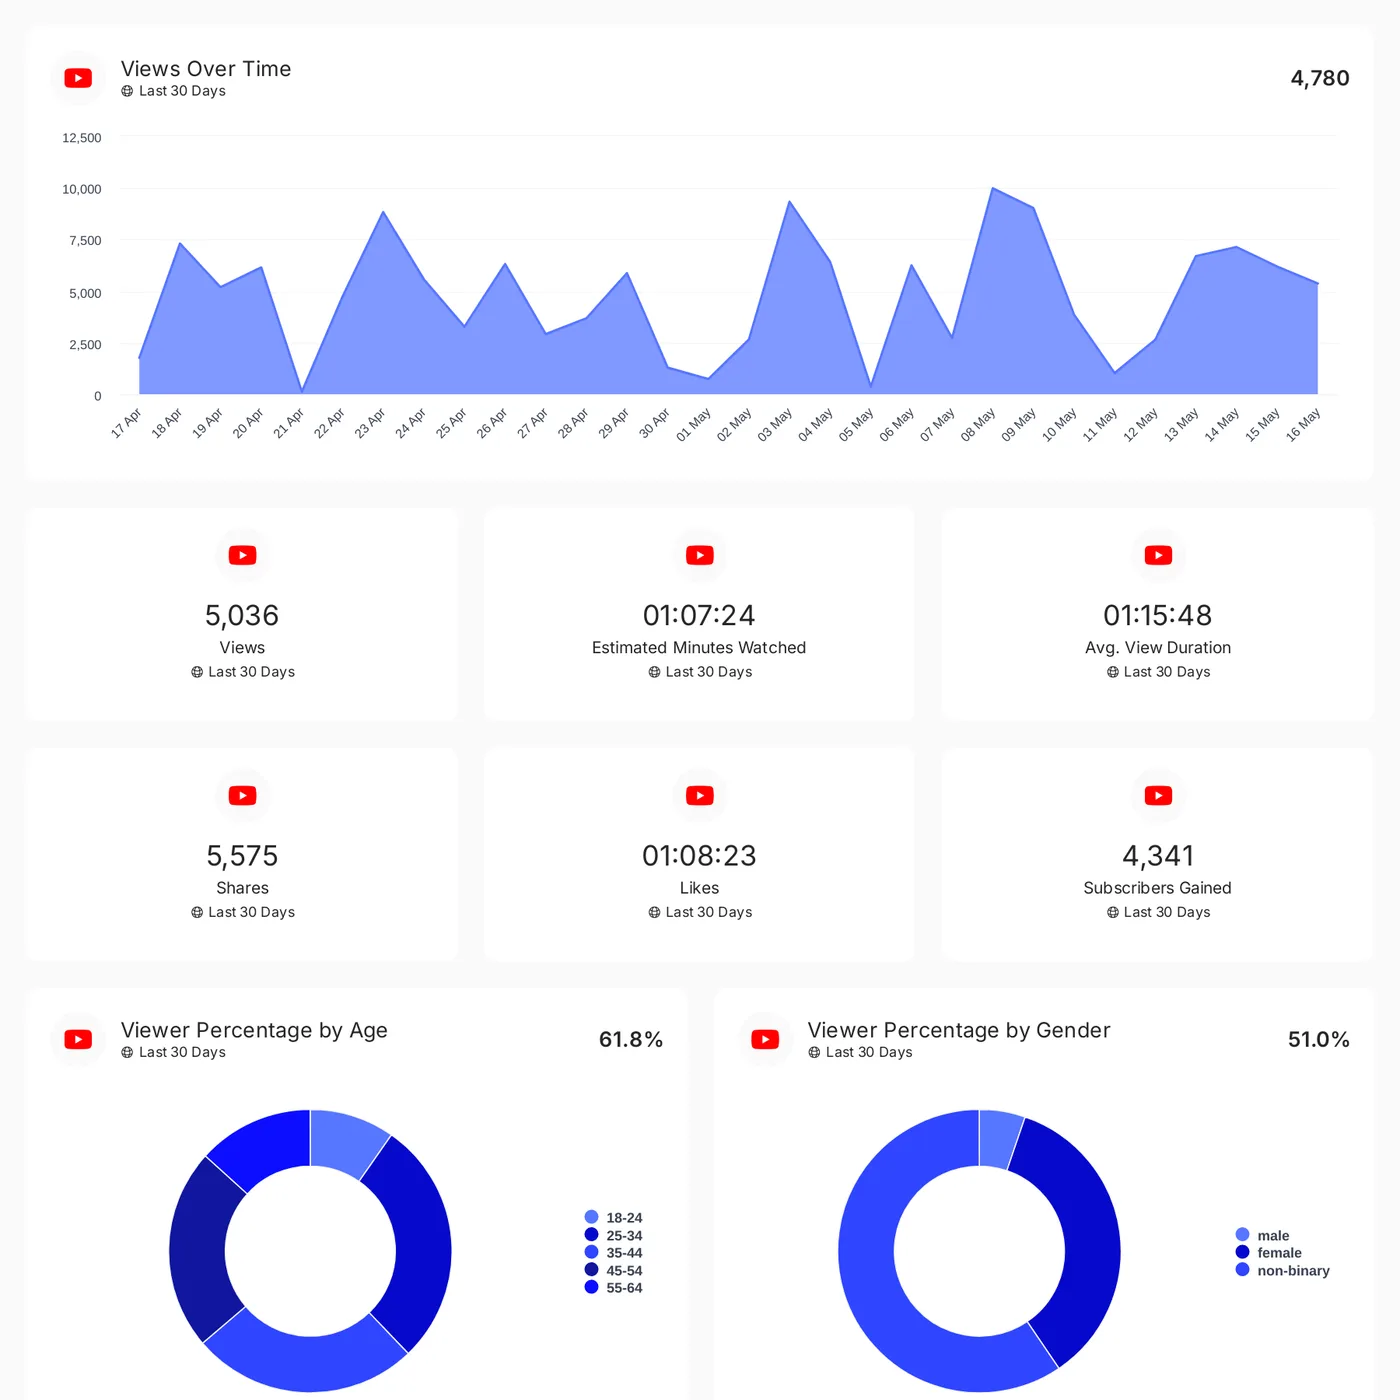
Monitor YouTube performance with views, watch time, audience demographics, engagement metrics, and video-level insights
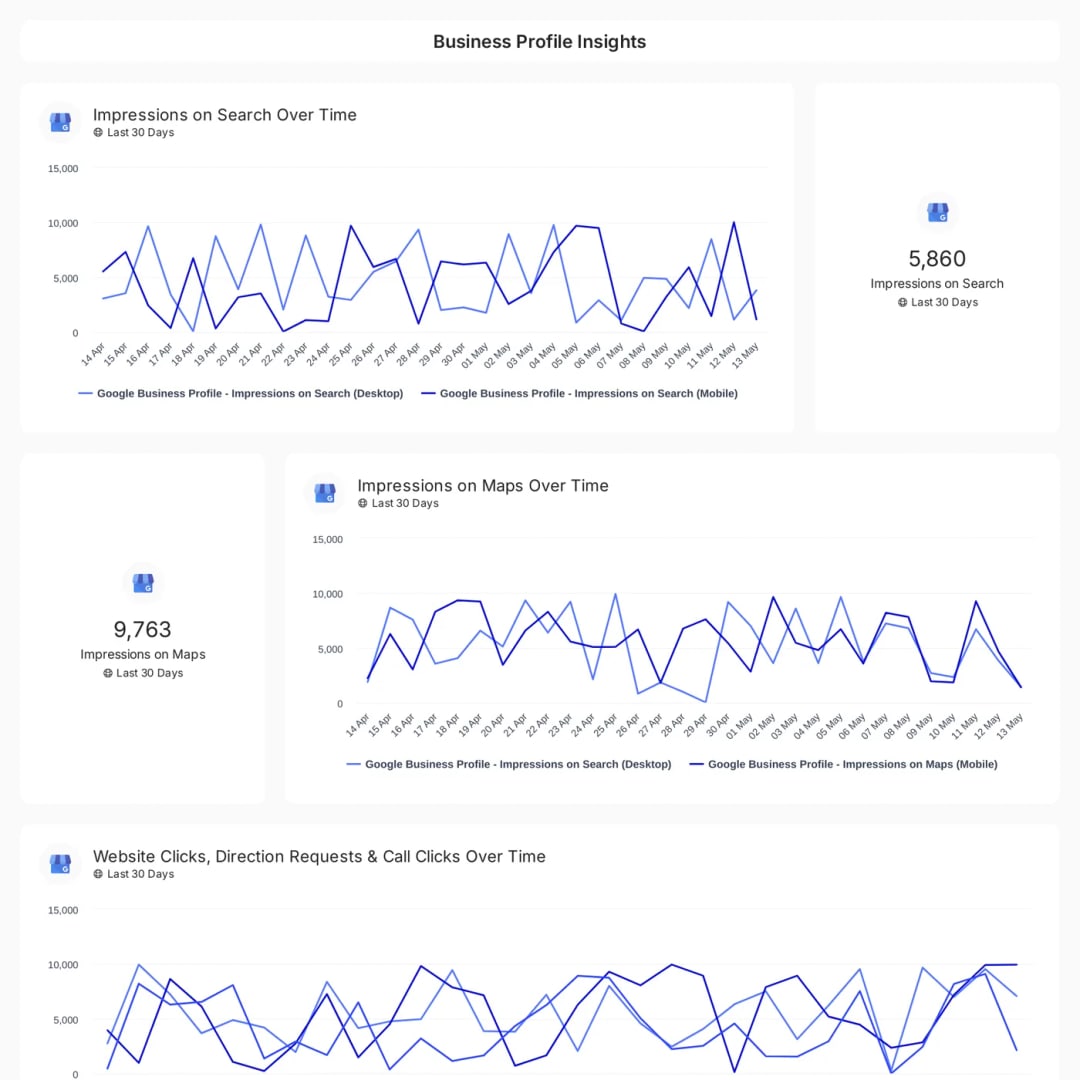
Monitor Google Business Profile insights, including search and map impressions, clicks, reviews, and user feedback trends
Set it up for the first client and every one after that starts from the same shape.
Drag in per-network tiles, top-post tables and follower-growth charts, then add the commentary explaining what the content did.
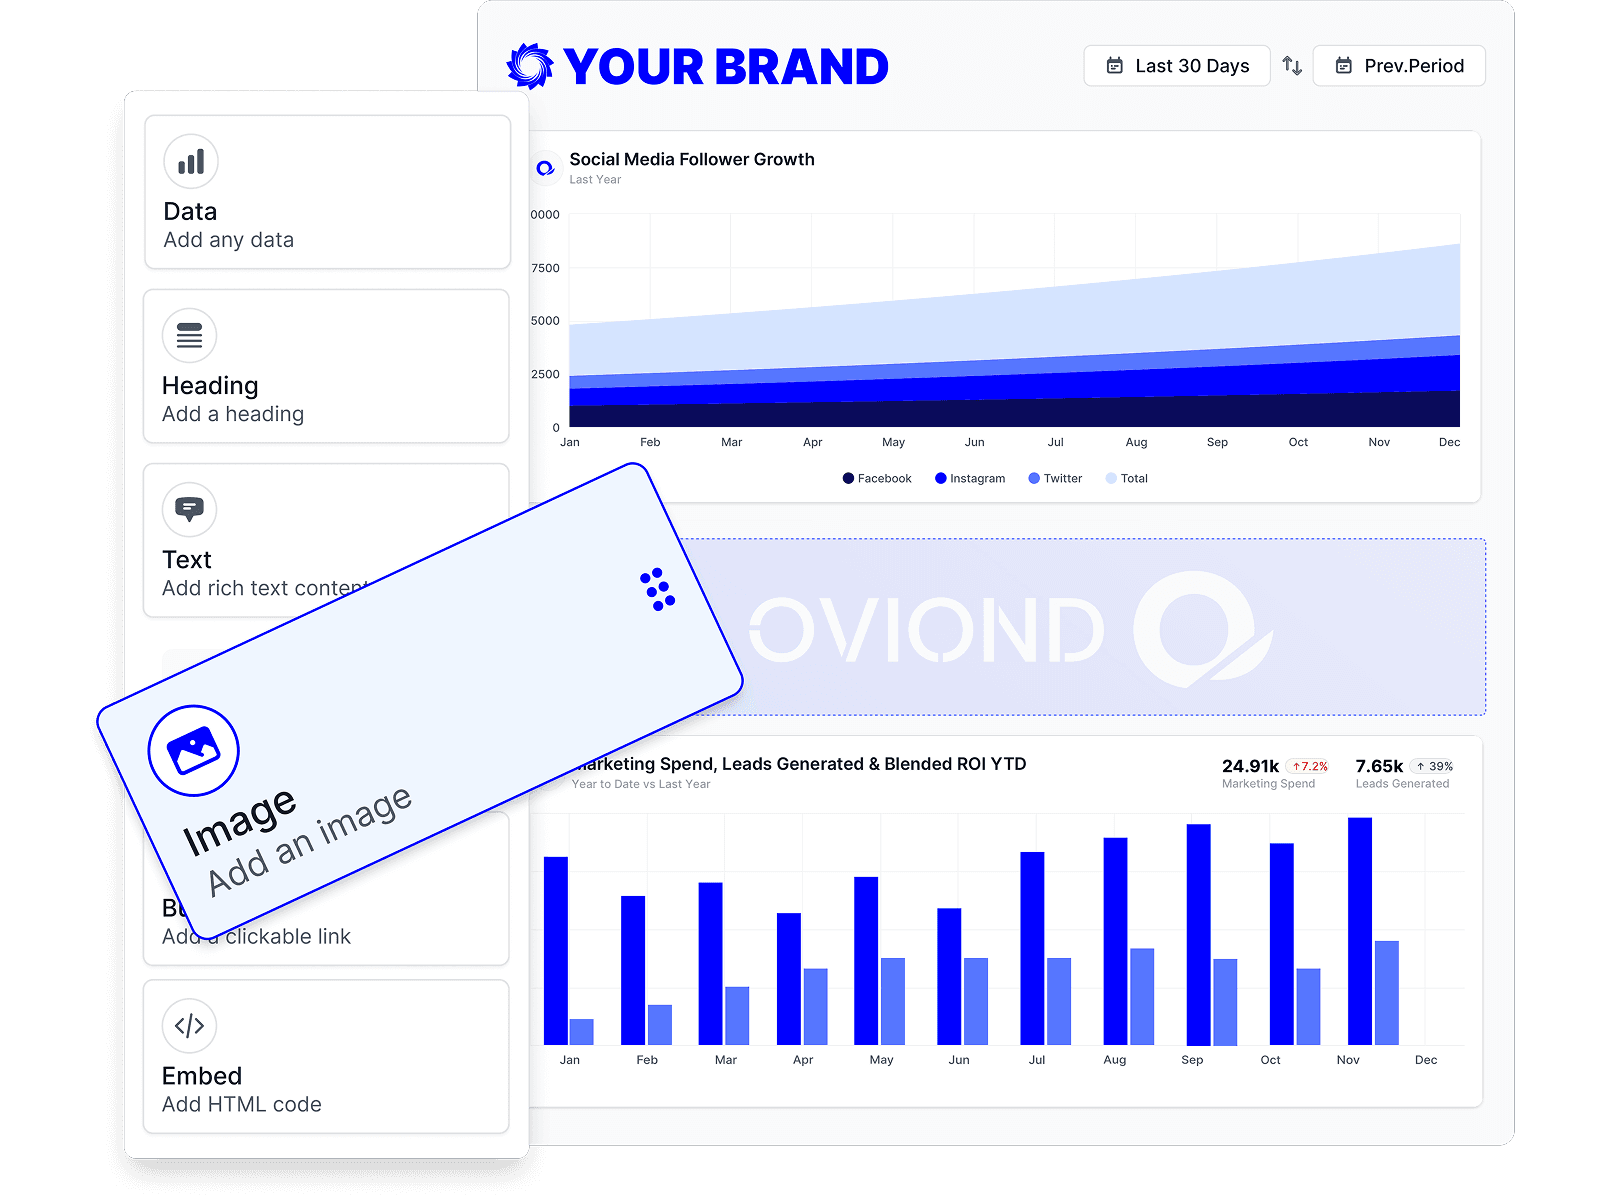
Apply your logo, colors and a custom domain, so the social report reads as your agency's work rather than a platform export.

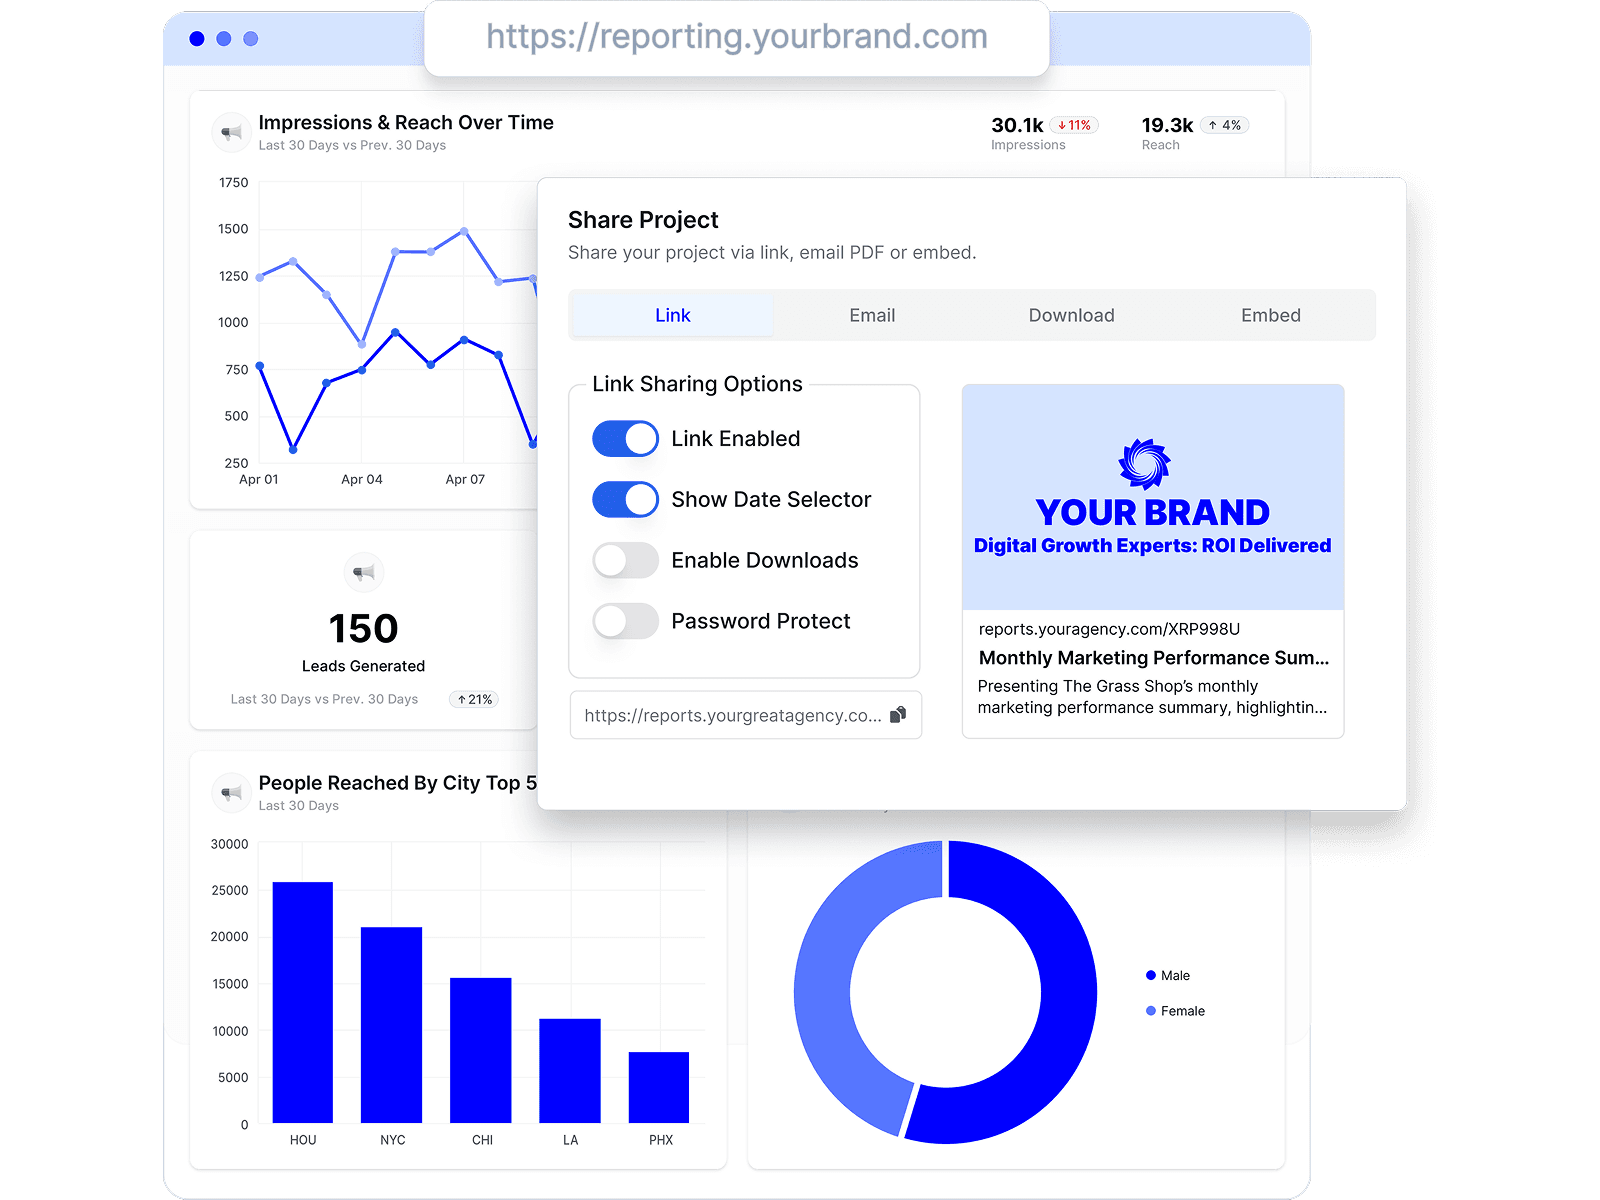
Send a live link the client can open any time, or schedule the report for daily, weekly or monthly delivery from your own sender address.
Engagement is easier to defend when the report shows what it fed. Put organic social next to paid social and PPC to separate earned from bought, next to web analytics to show the sessions it sent, or next to e-commerce when the client sells online. All-in-one client reporting covers how the channels sit together.
What agencies ask about reporting social results to clients.
Nine sources: Facebook, Instagram, LinkedIn, YouTube, TikTok, X, Pinterest, Google Business Profile and Mention. Paid social sits in its own set of connections — see PPC and paid ads reporting.
Yes. Connect each network to the client and they all report into the same report on the same date range. Each data widget reads one network, so build a widget or section per platform and use a calculated metric where you want a combined figure.
Yes. Instagram publishes engagement rate calculated by reach and by followers as separate fields, and LinkedIn and Pinterest publish their own engagement rate. Where a network does not publish one, build it as a calculated metric from the underlying counts.
Yes. Facebook, Instagram, YouTube, TikTok and X all expose post-, video- or content-level views with their own dimensions, so a table of individual posts with their reach and engagement is a standard widget rather than a manual screenshot.
Yes. Google Business Profile reports impressions on Maps and Search split by desktop and mobile, plus call clicks, direction requests, website clicks and bookings, with separate views for reviews and the search keywords people used to find the listing.
That depends on the network, not on Oviond. Each platform's API sets its own retention and lookback limits, and Oviond reports whatever the connected account returns for the period you select.
Yes. Schedule a report for daily, weekly or monthly delivery. The reporting period is stored as a preset that re-resolves on each run, so a monthly report always covers the most recent complete month.
No. Oviond is the reporting layer, not a publishing tool. It connects the networks your team already posts on and turns their performance data into branded, automated client reports.
Connect a client's social profiles, start from a template, and send a social report that explains the work rather than listing follower counts.