Ten content types
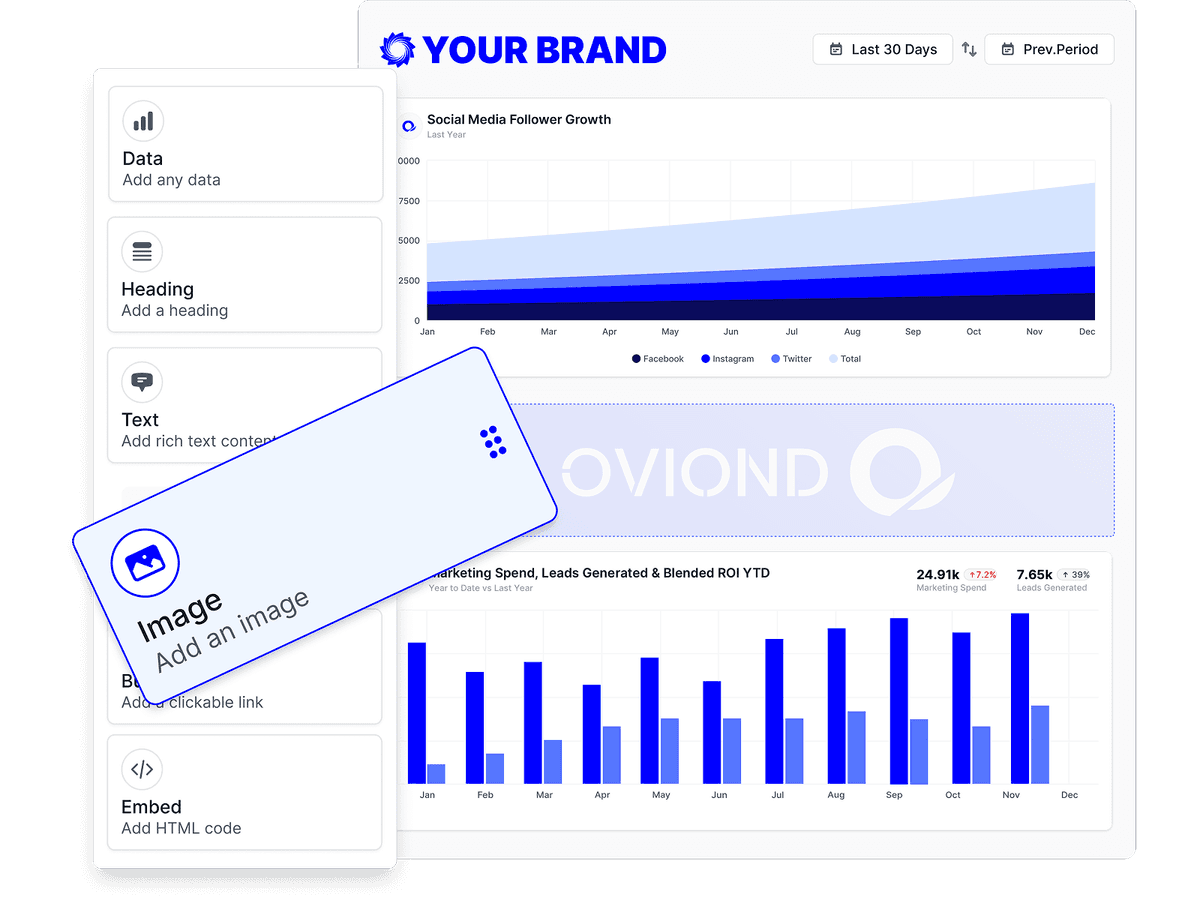
Drag in a Data Query, Calculated Metric, Custom Data, Goal, or Static Value for the numbers, then a Heading, Textbox, Image, Button, or Embed to frame them.
Feature
Oviond's report builder is a drag-and-drop grid: pull data widgets, headings, commentary, images, and embeds onto a page and lay out a client report without writing code.
Why the report builder
The builder is the part of Oviond your team touches every day, so it works like the tools they already use.
Data queries, calculated metrics, goals, uploaded data, static values, headings, text, images, buttons, and embeds all drop onto the same grid.
Anyone who can build a slide deck can build a client report. Nothing in the builder needs SQL or a developer.
Build a single always-on view, or a paginated report with a page per channel and a table of contents for the client.
How it works
A report is made of pages, a page is a grid, and a widget is one block on that grid. Data widgets read from a connected source; the rest are there to frame and explain them.
Oviond saves the whole report atomically — every page and every widget in one operation — and auto-saves as you work, so there is no save button to forget.
Drag in a Data Query, Calculated Metric, Custom Data, Goal, or Static Value for the numbers, then a Heading, Textbox, Image, Button, or Embed to frame them.
Drag a widget to move it, pull a corner handle to resize it, and it snaps to the grid. Multi-select lets you duplicate or delete several widgets in one action.
A multi-page report holds as many pages as you need — one per channel works well. Rename them inline, drag to reorder, and those names appear in the client's table of contents.
A dashboard is a single full-screen view with no pages, holding up to 50 widgets. An on-canvas counter turns amber as you approach the cap so you can rebalance before you hit it.
Textbox widgets take variables for client name, report name, date range, client manager, report URL, and account name — so one line of commentary works for every client and every period.
Upload JPEG, PNG, GIF, SVG, or WebP images up to 25 MB each into the media library, and save any report as a template so its pages, widgets, and settings can start the next client.
What you are buying and what it costs to build client reports in each tool — restated from the dated fact tables on our comparison pages.
| Tool | Starting price | White-label |
|---|---|---|
| Oviond | From $40/month billed annually ($50 month-to-month) — 10-client minimum, $4/$5 per client | Included on every plan — unlimited white-label theme profiles, one house style or a distinct theme per client |
| AgencyAnalytics | $20 per client/month billed annually, or $25 per client/month month-to-month (the "Save 20% annually" toggle on their pricing page) | Included on every plan |
| Swydo | €62/month billed annually (€69 monthly) — first 10 data sources included | White-label branding and custom domain hosting included |
| DashThis | Individual: $44/month billed annually ($54 monthly) — 3 dashboards, 15 data sources, no full white-label | Full white-label (branding removal, custom domain, custom email) from the Professional tier ($139/month annual); Individual gets logo + preset themes only |
| ReportGarden | — | White-labeled dashboards and client-portal custom domain (CNAME) offered; tier inclusion not specified on the pricing page |
| Octoboard | "For Agencies" from €25/month for 5 clients (~€5/client), 30% off annual; the separate "for Business" plans from €12/month | Included on the Agencies product from the €25 base tier — white-label client portal, your branding, custom email domain (a genuine strength) |
| Reporting Ninja | Starter: $20/month billed annually ($25 monthly) — 10 reports, 4 users, 10 accounts | Branded client portal on a custom domain, custom report branding, branded email delivery |
| Reportz | $9.90 per dashboard per month (volume slider; e.g. 8 dashboards ≈ $78.72/month) | Included — logo/colors/fonts, custom dashboard URL, white-label email |
| Whatagraph | Go: €199/month, 20 source credits; Max: from €699/month, 50+ credits; Prime: custom | Custom branding, custom domain (CNAME), and white-label emails — reserved for higher tiers |
Competitor facts restate the sourced, dated tables on the linked comparison pages (most recent check September 2, 2026); Oviond facts verified September 1, 2026. Vendors change pricing — the comparison pages carry the sources. See every comparison
Three habits the builder replaces.
Screenshotting dashboards into slides
Live widgets that re-query every time the report opens.
One person who knows where the formulas live
A grid anyone on the team can lay out.
Starting every new client from a blank file
Save the layout as a template and reuse it.
Laying out the page is one decision. These three are the others.
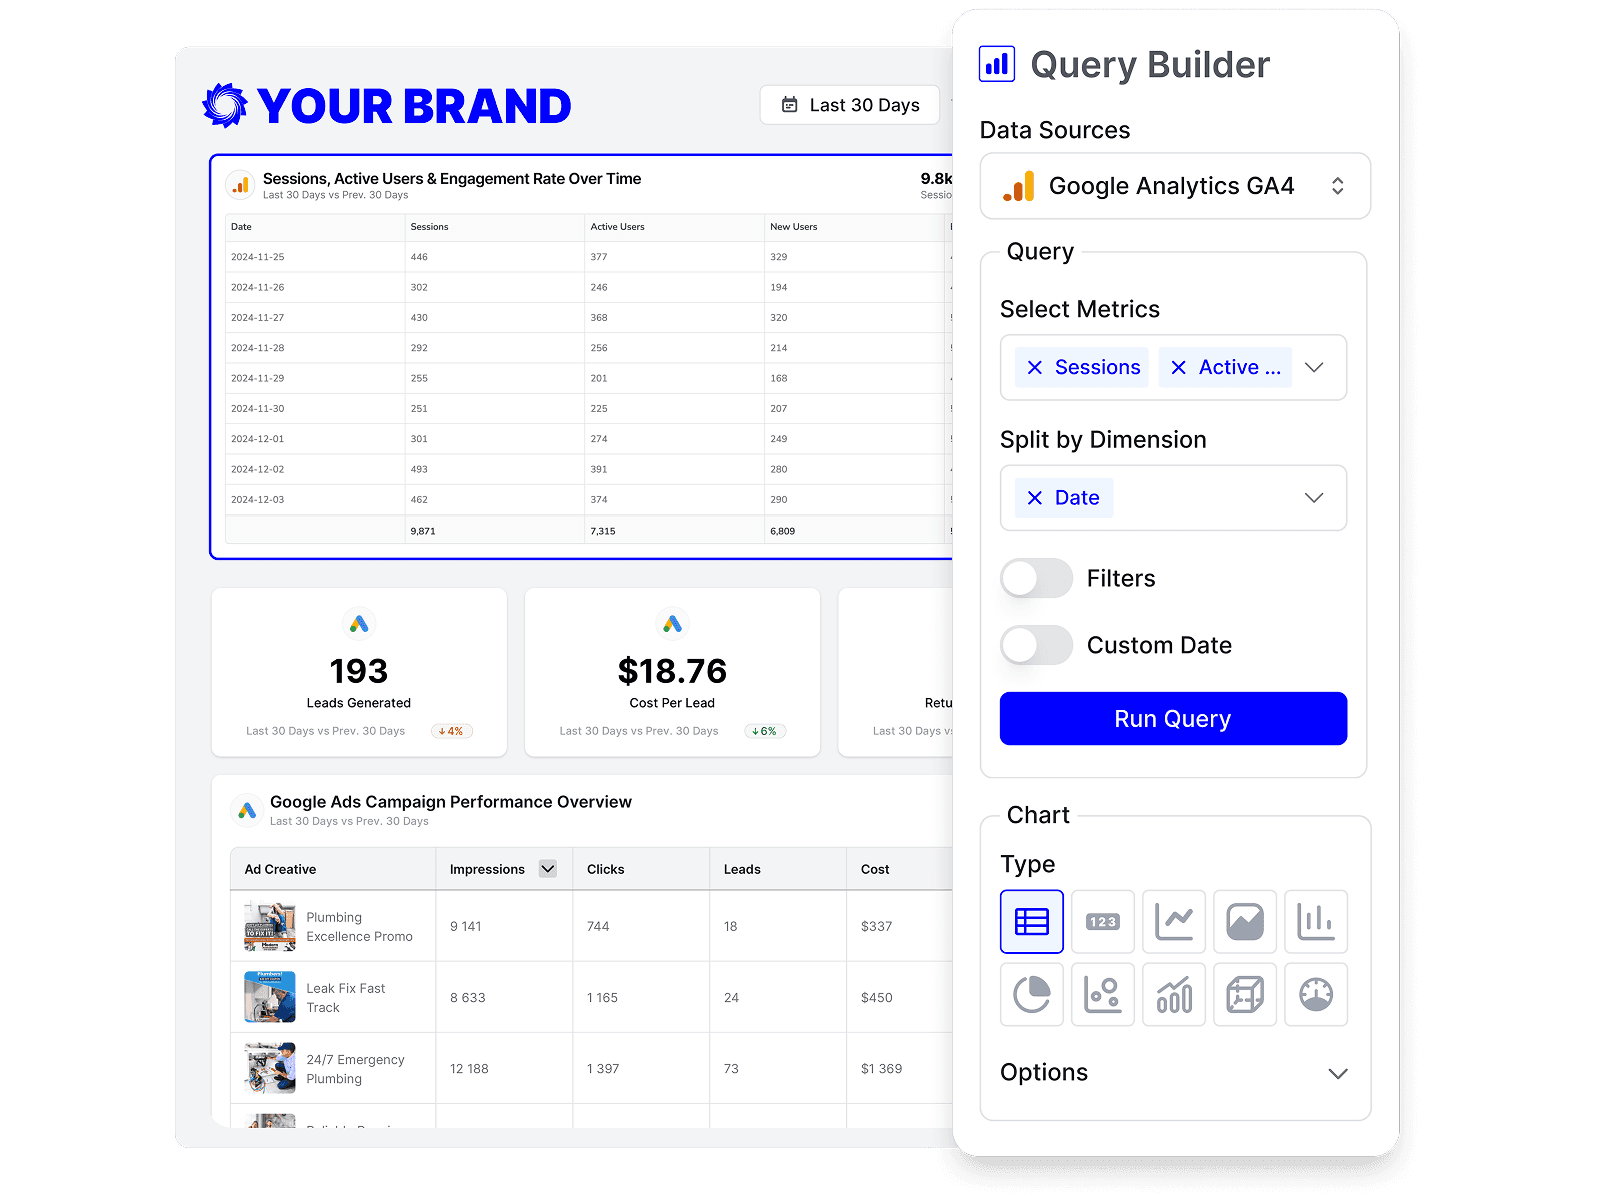
Pick the source, metric, and dimension behind a widget, filter it, compare it against the previous period, and choose how the figure is formatted.
A theme restyles the whole layout at once — chart colors, canvas, font, corners, and cover page — so the report you built reads as your agency's work.

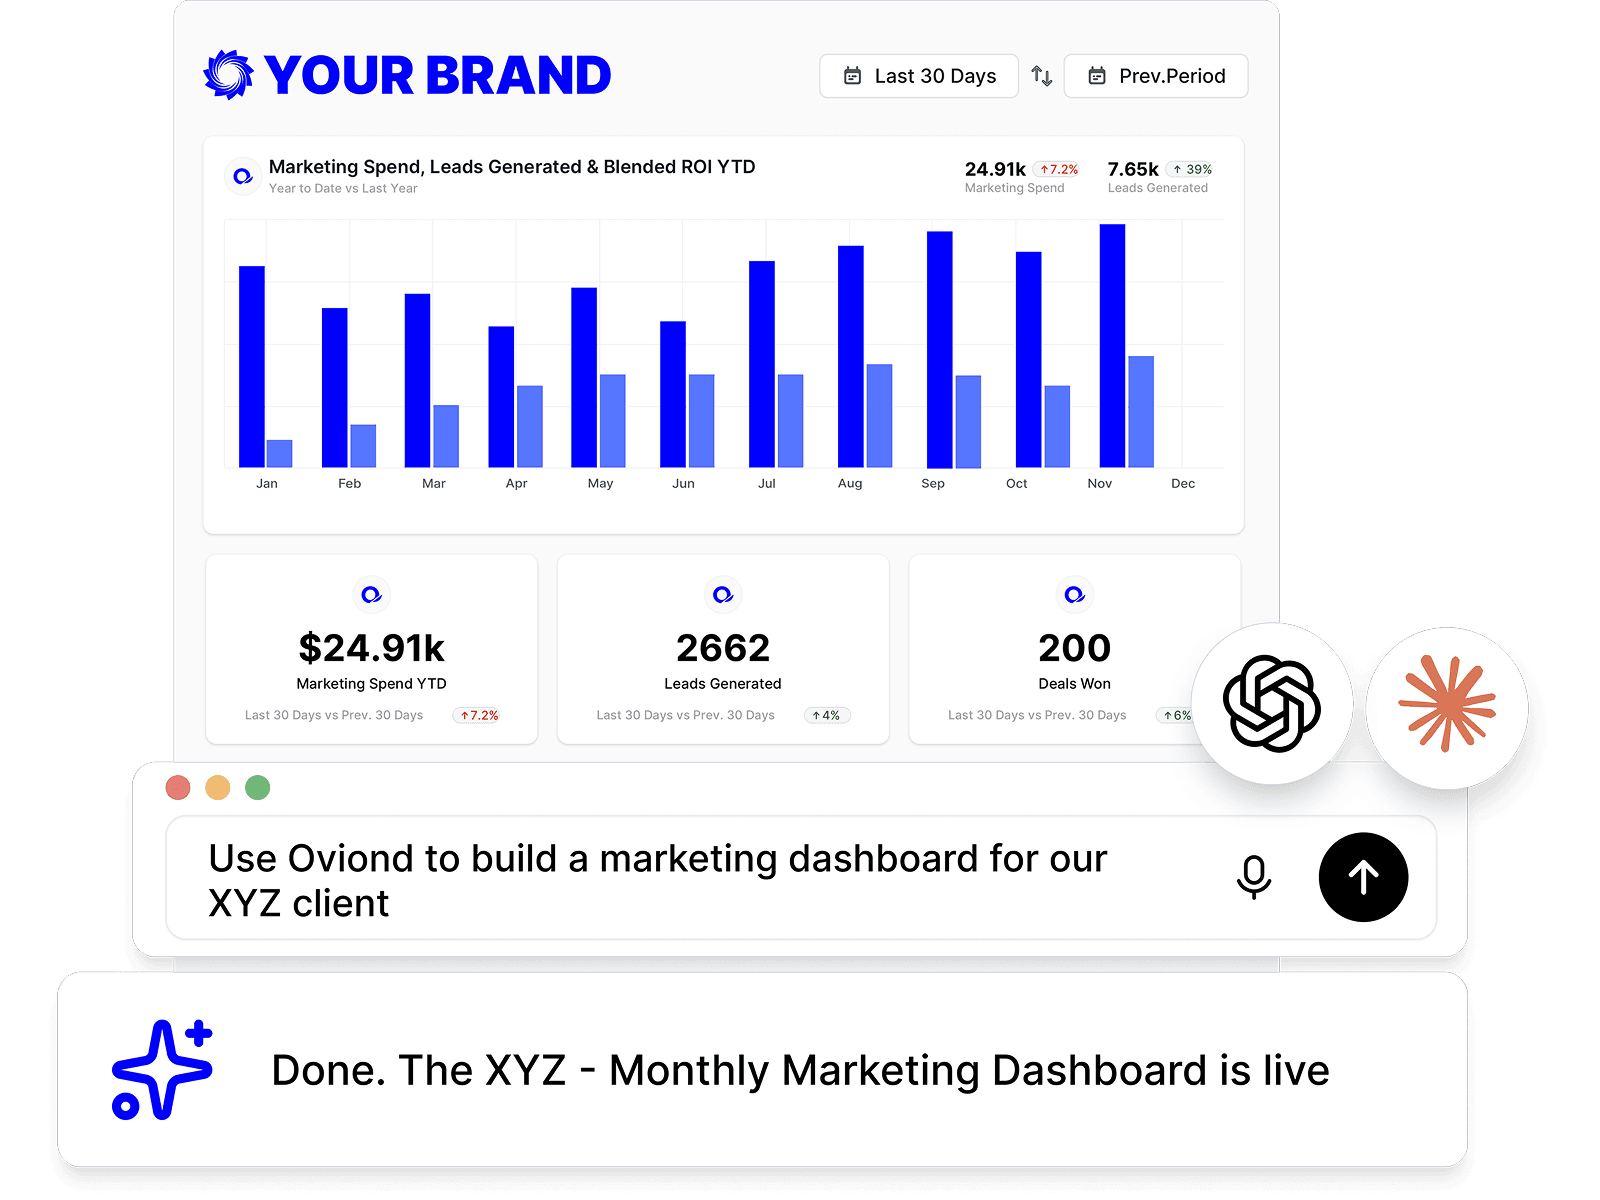
Connect an AI assistant over MCP and ask it to add pages and widgets for you, then finish the layout by hand in the builder.
Each widget can read from any of the 70+ marketing data sources connected to that client, so one page can hold paid media, analytics, search, and social side by side.
Open an agency-ready template, swap in the client's data, and edit only the pages you want to change.
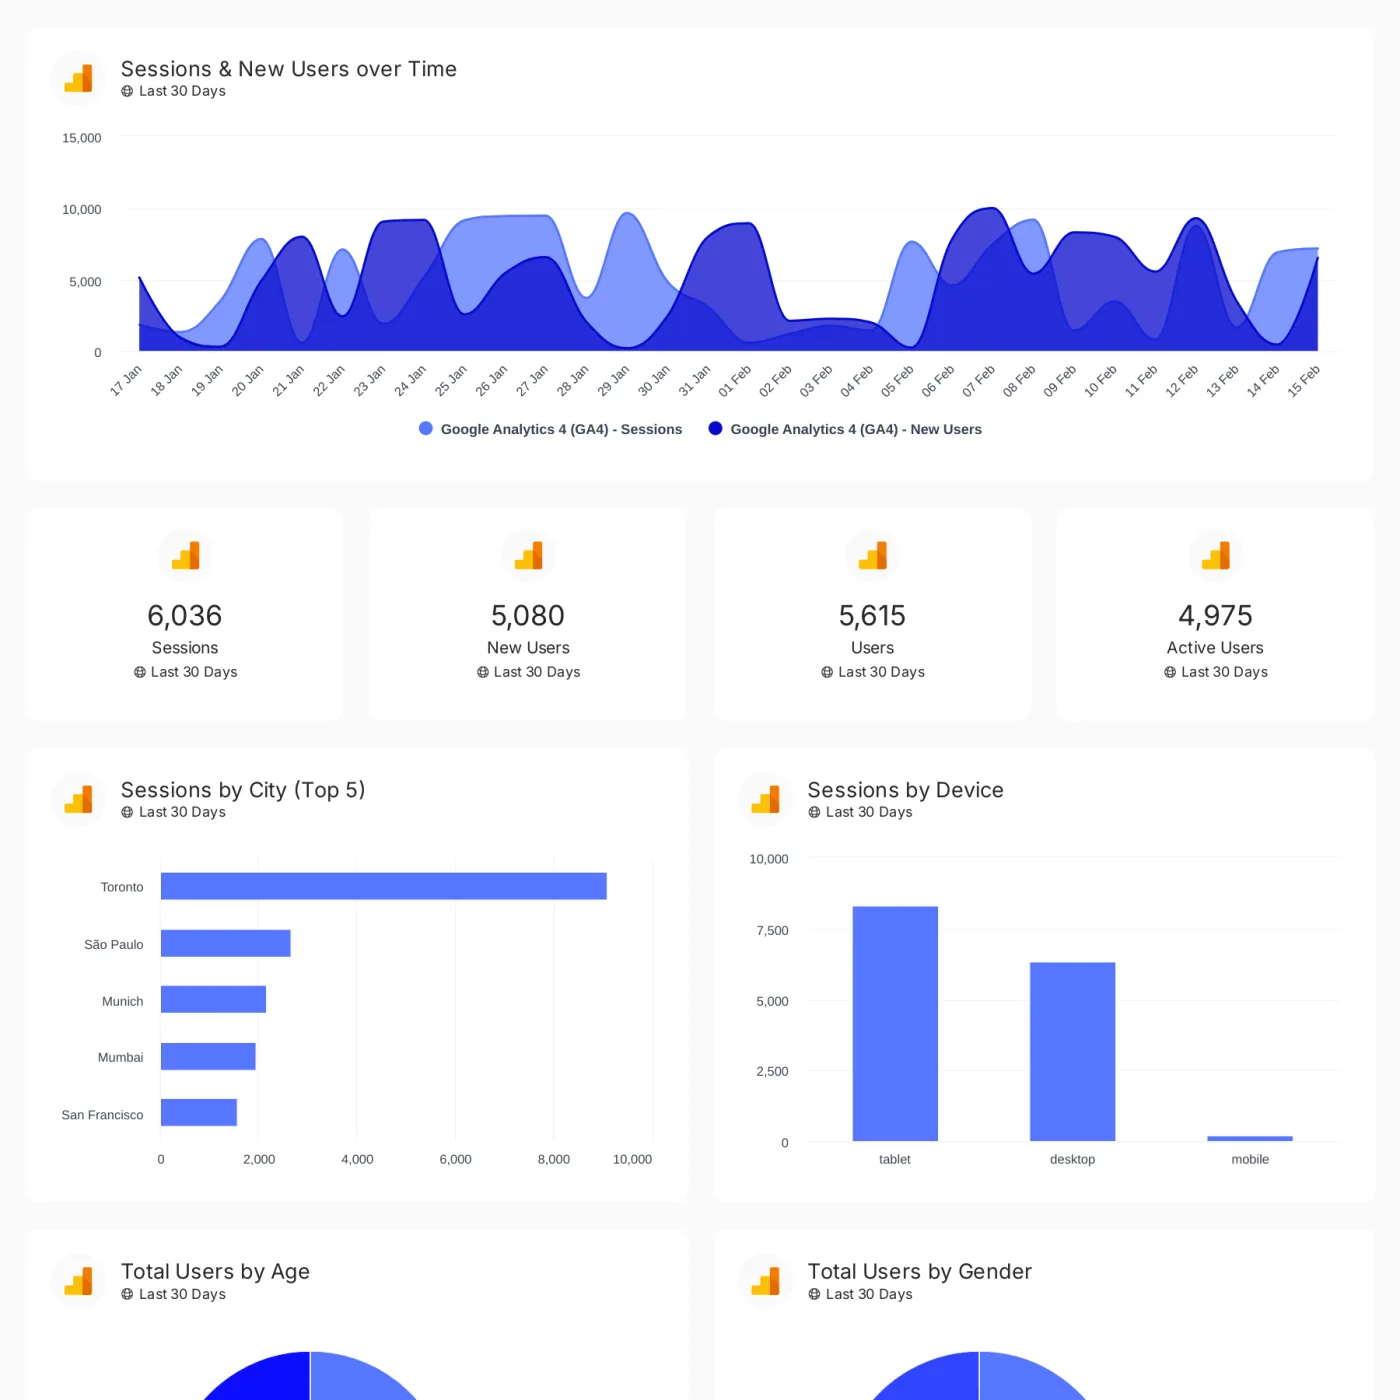
Track conversions, revenue, traffic, and customer engagement across your client's full marketing stack in one branded dashboard.
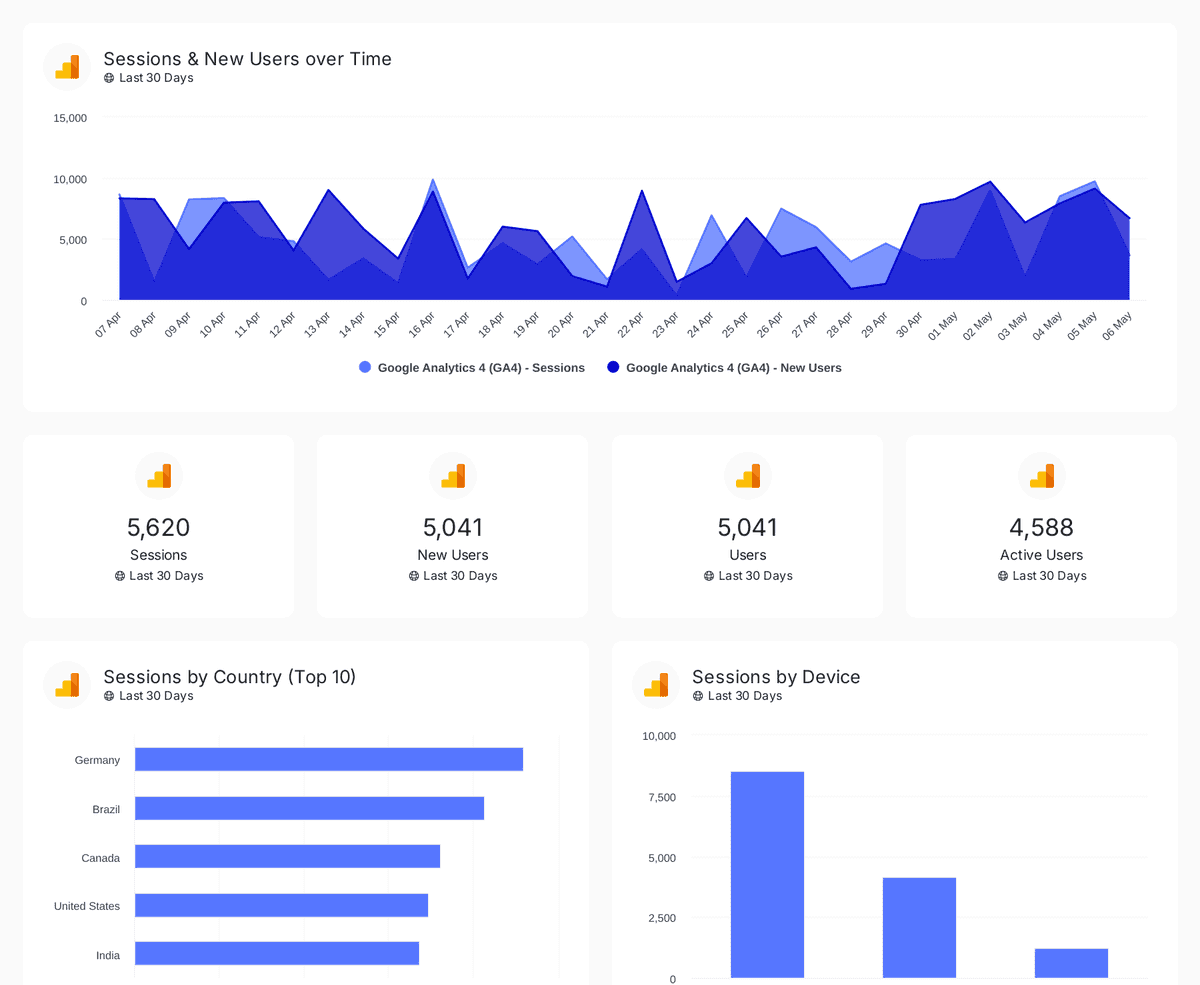
Track sessions, users, and traffic sources with insights by country, device, age, gender, and channel performance analysis
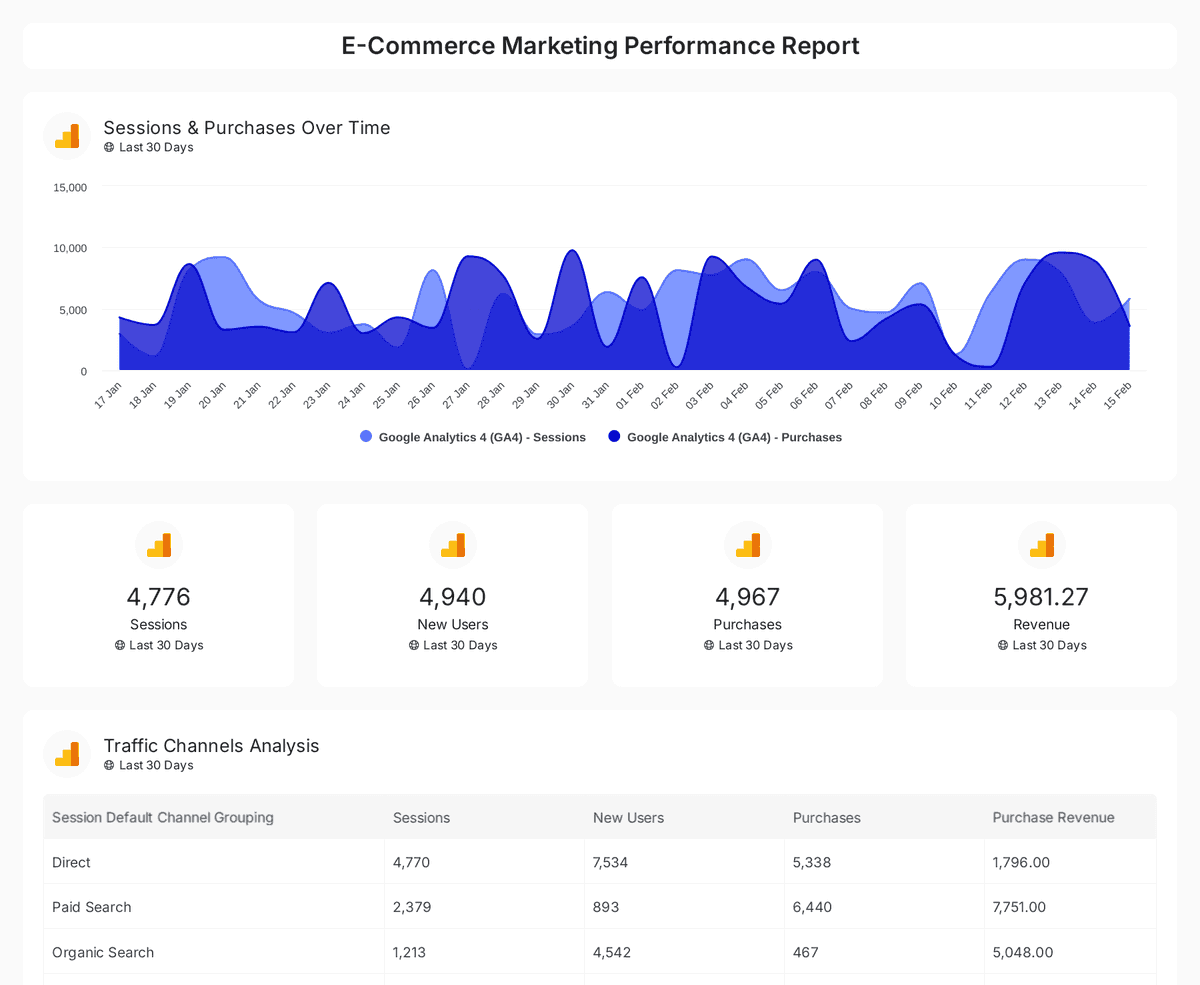
Analyze e-commerce sales, conversions, and traffic insights with interactive, real-time performance metrics.
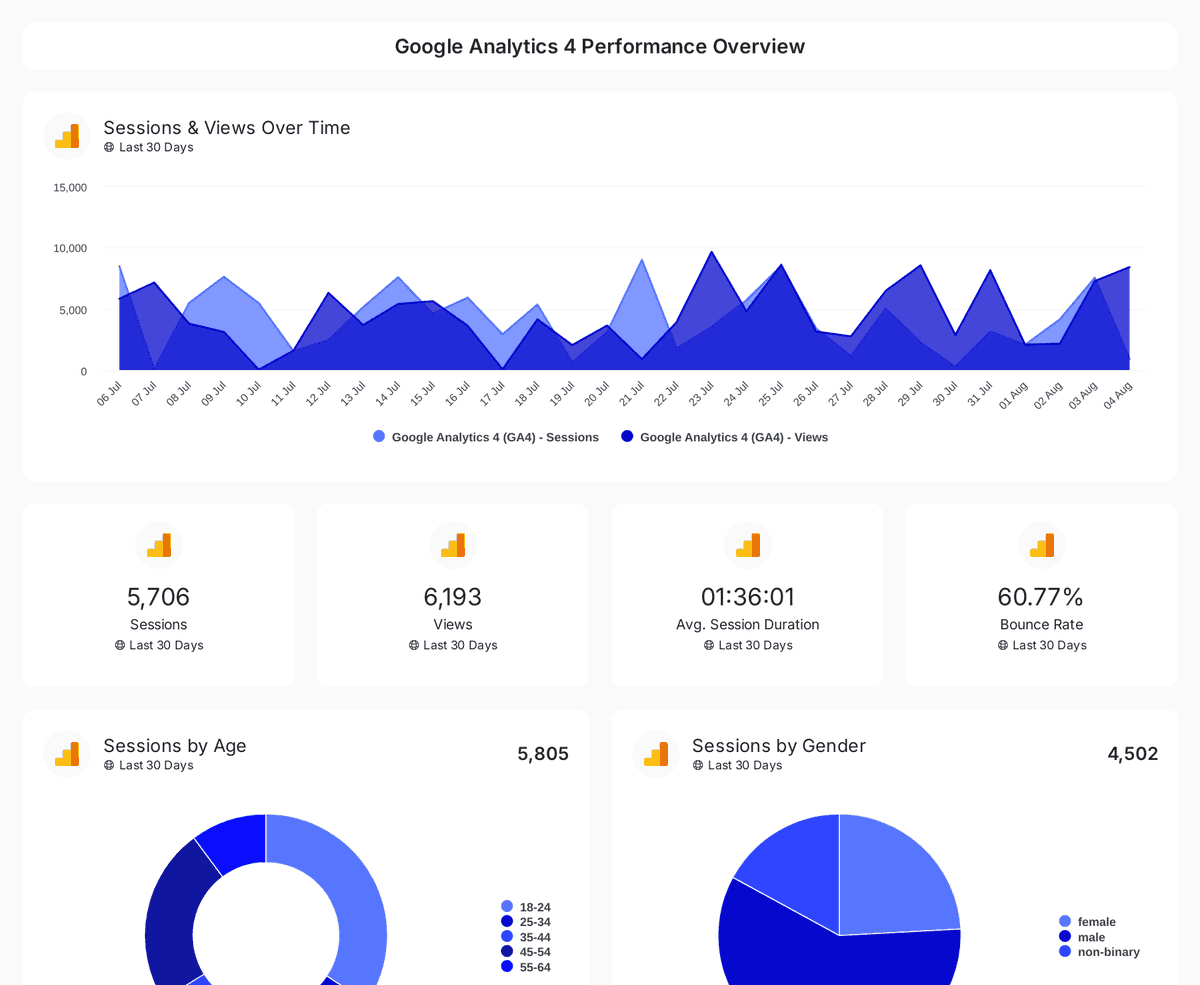
Monitor website traffic, user demographics, and page performance with insights from Google Analytics 4, Search Console, and Page Speed Insights.
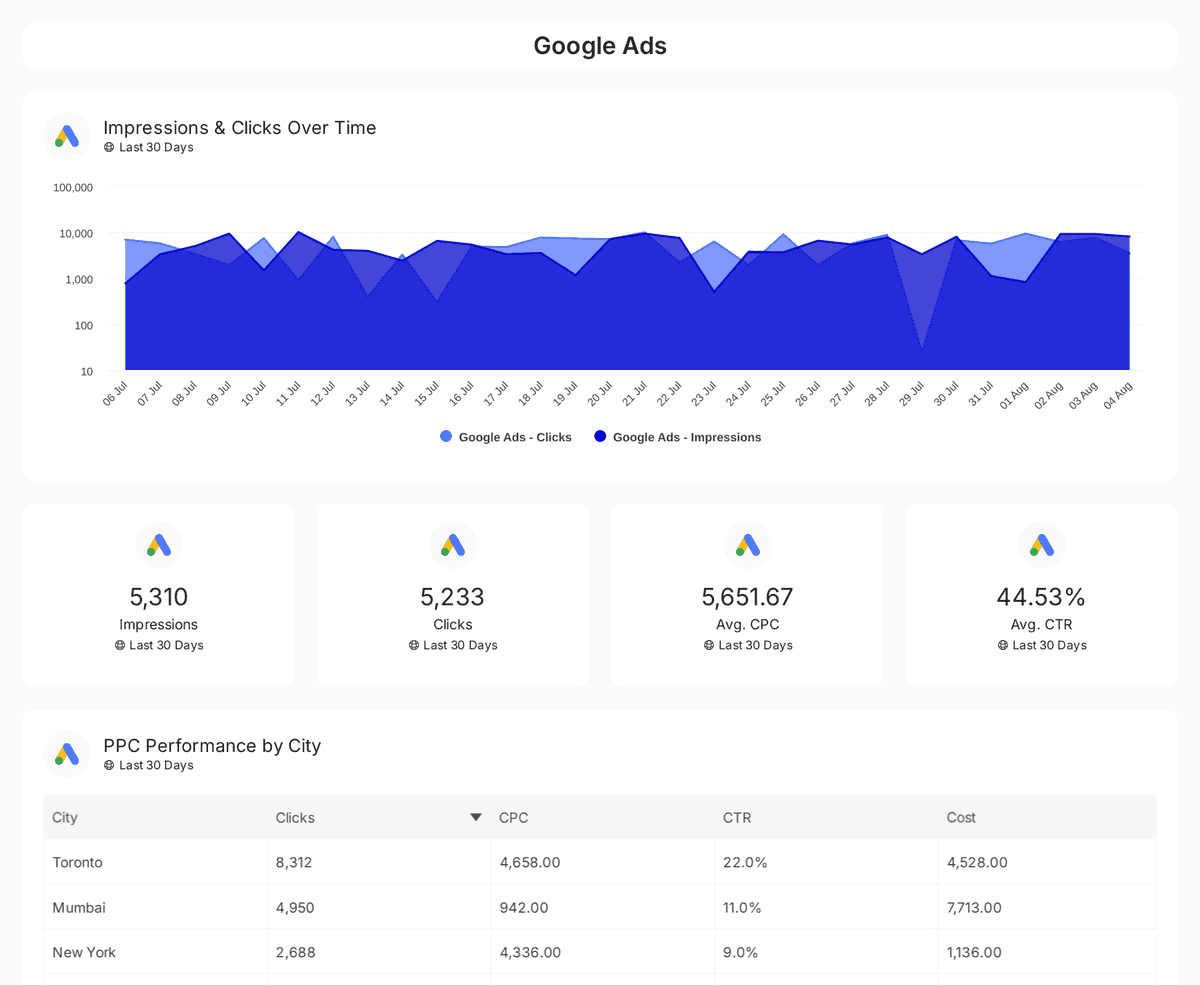
Track and compare reach, clicks, impressions, and CTR across Google, Facebook, Instagram, LinkedIn, and Twitter Ads over time.
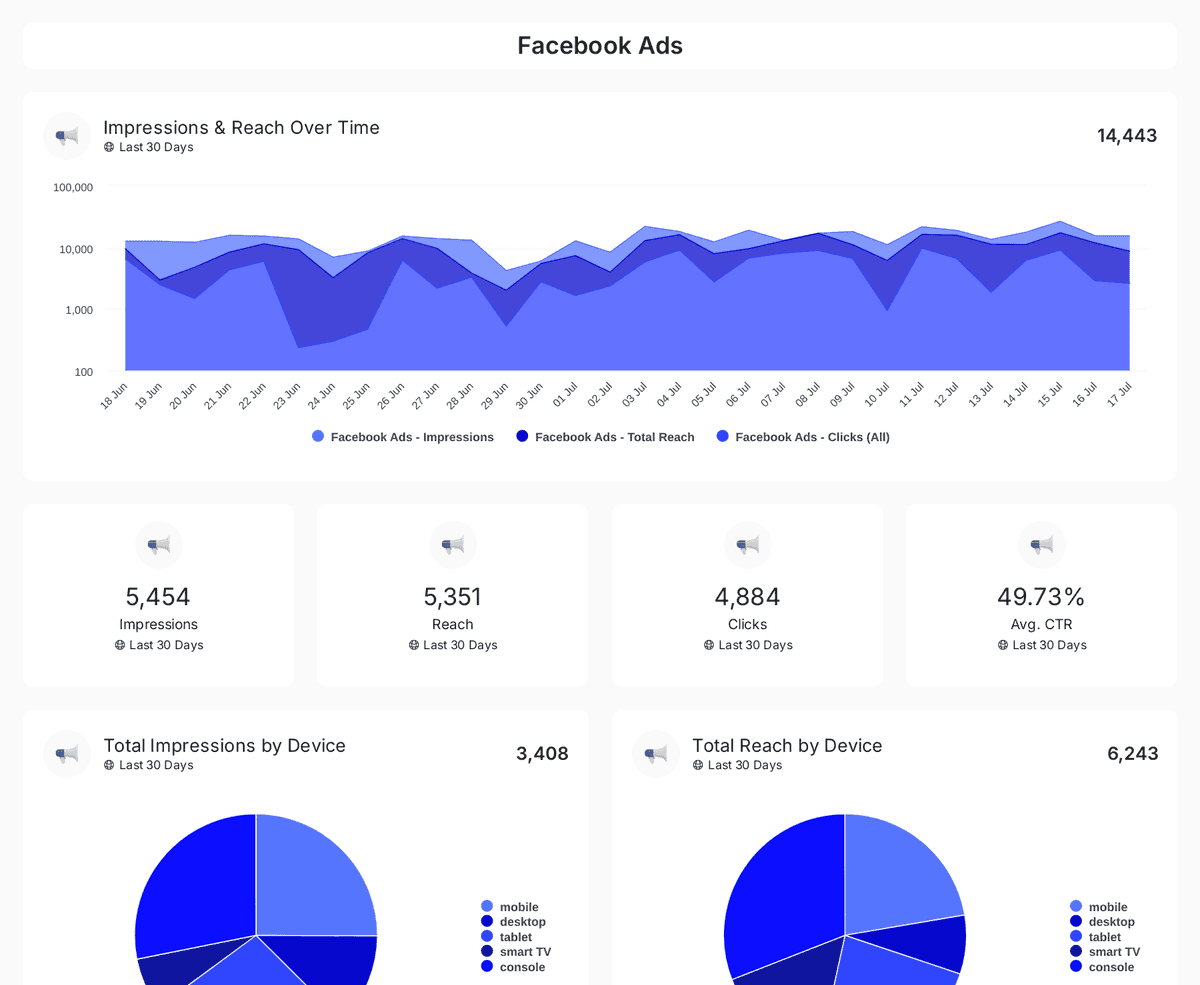
Track impressions, clicks, CTR, and ad spend across Facebook, Instagram, LinkedIn, TikTok, and Twitter Ads with insights on engagement & conversions.
| Fact | Oviond |
|---|---|
| Reports & dashboards | Unlimited reports and unlimited live dashboards on every plan |
| Calculated metrics | Formula-based custom metrics that can combine data from multiple sources |
| White-label | Included on every plan — unlimited white-label themes |
| Team users | Unlimited, no per-seat fees |
| Starting price | $40/month billed annually ($50 month-to-month) for 10 clients |
Oviond facts verified September 1, 2026 by Oviond Product. Pricing in USD. See full pricing
Widgets, pages, limits, and reuse — how building a report actually goes.
A marketing report builder is an editor for assembling a client report from blocks rather than writing it by hand. In Oviond you drag content types onto a grid, point the data ones at a connected source, and arrange the page until it reads the way you want.
No. The builder is drag and drop throughout. There is no query language to learn, no formula syntax for standard metrics, and nothing that needs a developer.
Ten content types: Data Query, Calculated Metric, Custom Data, Goal, and Static Value for figures, plus Heading, Textbox, Image, Button, and Embed for structure and context. Only Data Query reads from a marketing platform; the other data types bind to something inside Oviond.
A dashboard is one full-screen view with no pages — good for always-on client visibility. A multi-page report paginates, so you can give each channel its own named page and the client gets a table of contents on the shared report.
A dashboard holds up to 50 widgets, and a counter on the canvas shows how many slots are used. Reports paginate instead, so they have no widget cap — add another page when one gets crowded.
No. Oviond auto-saves as you work and persists the whole report — every page and every widget — in one atomic operation, so a report is never left half-saved.
Yes. Save any report as a template and it keeps every page, widget, metric and dimension choice, date range, theme, and presentation setting. Live values and data connections are stripped, and each widget is rewired to the client you create the new report for.
Yes. Textbox widgets take freeform commentary with variables that resolve per client and period, Image widgets pull from the media library or a URL, Button widgets link out to something like a booking page, and Embed widgets take any iframe-compatible source.
Yes. Drag a widget to reposition it and pull a corner handle to resize; both snap to the grid. Turn on Multi Select to pick several widgets and duplicate or delete them together.
The builder makes the thing you send. See marketing reporting for the recurring deliverable and marketing dashboards for the always-on view, then client report sharing and automated client reporting for getting it to the client. Sizing up alternatives? See all comparisons.
Drag in the data, add the context, and have a client-ready report before the afternoon goes.