
Oviond Blog
Looker Studio Report Template: Agency Setup Guide
Build a reusable Looker Studio report template for agency clients. Covers data sources, branding, calculated metrics, automation, and scaling across accounts.

A new client signs, and the reporting work starts before the kickoff is finished. Someone copies last month's Looker Studio dashboard, reconnects GA4 and Google Ads, replaces the logo, checks calculated fields, fixes a broken blend, and tests the date controls. Then the same process starts again for the next account.
That workflow feels manageable until an agency is maintaining recurring reports across 30 or more client accounts. Small differences accumulate. One dashboard uses a different conversion definition, another has an outdated brand treatment, and a third stops loading after a client changes access. The agency still delivers reports, but the reporting system becomes a collection of exceptions rather than an operation that scales.
A Looker Studio report template can reduce that repetition, but only when it's treated as an operational asset. The layout is the visible part. Cloning, permissions, connector ownership, field mapping, version control, and client delivery determine whether the template helps or creates another layer of maintenance.
Table of Contents
- Why Agencies Need a Repeatable Report Template
- Planning Your Template Structure Before You Build
- Connecting and Blending Marketing Data Sources
- Creating and Deploying the Template Across Clients
- Branding and White-Label Delivery for Client Reports
- When Looker Studio Templates Hit Their Limit
- Troubleshooting and Scaling Your Reporting Workflow
Why Agencies Need a Repeatable Report Template
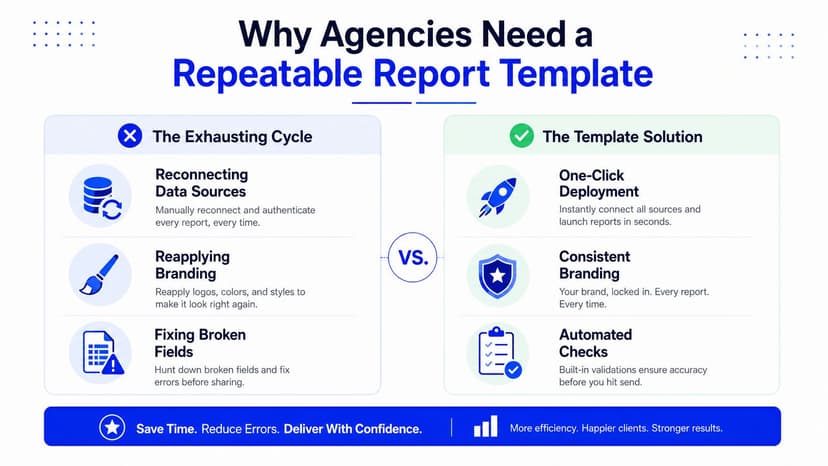
The recurring report cycle usually begins with good intentions. An account manager wants a client report that feels custom, so the team customizes the dashboard, adds a requested metric, changes the page order, and builds a one-off blend. The next account receives a slightly different version. After several reporting cycles, nobody can say which dashboard is the approved model.
That drift creates more than a design problem. Clients compare figures across reports, account managers explain why similar channels use different definitions, and ops leads spend time investigating whether a discrepancy comes from the source data, a calculated field, or a manual edit. A template-first workflow gives the team a controlled starting point while leaving room for deliberate client-specific changes.
Treat the report as a product
Google's visualization product opened to the public on 20 September 2018, and that release introduced community connectors and community visualizations. An independent history of the platform says that thousands of templates have since been created and that more than 900 connectors existed by the time of writing, illustrating how quickly a reporting ecosystem can expand around reusable assets. (Platform history and ecosystem context)
For an agency, the practical lesson is simple. The master report should have an owner, a documented purpose, a change process, and a clear distinction between standard components and approved custom work. It shouldn't be a disposable deliverable built again for every client.
A strong template-first workflow usually looks like this:
- Master structure: Define the pages, shared controls, metric definitions, and visual rules once.
- Client configuration: Map each client's properties, ad accounts, CRM data, and reporting preferences to that structure.
- Quality check: Test filters, date comparisons, totals, blends, and data freshness before delivery.
- Controlled exceptions: Record custom requests rather than allowing every request to change the master.
Looker Studio supports creating reports from scratch or from the Report Gallery, and its version-history documentation supports viewing, restoring, and managing previous versions. That makes edit history useful for agencies that need to revise a standardized dashboard without losing the ability to recover an earlier state. (Looker Studio report history and template context)
The template won't remove judgment from reporting. It will remove unnecessary rebuilding, expose exceptions earlier, and give account teams a consistent client experience.
Planning Your Template Structure Before You Build
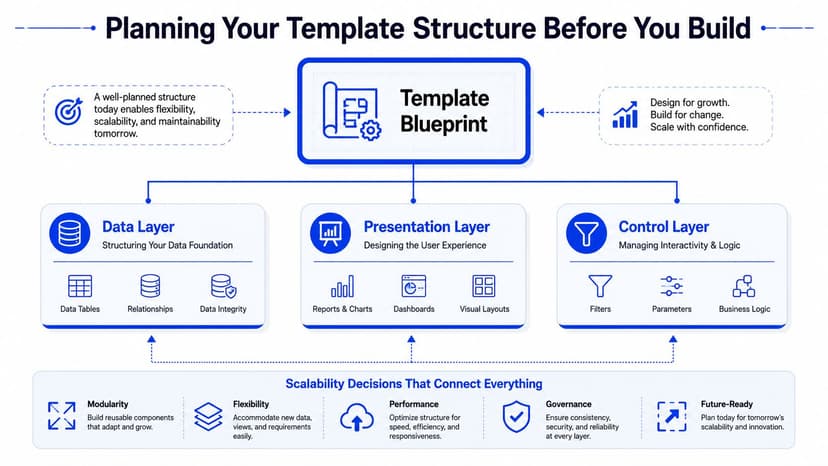
An account manager wants a client report that fits the client's reporting cadence, so the team customizes the dashboard. After that pattern repeats across several accounts, cloning becomes harder, permissions become unclear, and every exception adds maintenance work. Design the template around repeatable decisions before anyone drags a chart onto the canvas.
Start by listing the questions each audience needs answered, then assign those questions to pages. An executive summary can focus on business outcomes, a channel page can support the marketing manager, and a detailed table can help the account team investigate performance. Keep the client story clear without turning every request into a new layout.
Google's template examples and third-party reporting galleries show structures for paid media, social, GA4, Search Console, ecommerce, and email dashboards. Use them as references, not shopping lists. Each page should have one clear job, with shared navigation and controls that remain stable when the report is cloned for another client.
Set the page hierarchy
The first page should work without a walkthrough. It needs to show what changed, which channels matter, and where the client should focus. Deeper pages can cover paid-channel performance, attribution comparisons, funnel movement, content, or search visibility.
For agency reporting, a narrow sequence is easier to maintain than a dense dashboard:
- Performance overview: Core outcomes, period comparison, and reporting notes.
- Paid-channel snapshot: Spend, traffic, conversions, and efficiency by platform.
- Attribution comparison: Differences between platform-reported results and analytics data.
- Funnel view: Movement from traffic or leads toward the agreed business outcome.
- Content or SEO page: Landing pages, search queries, content engagement, or organic visibility.
Client needs will change, but page order should not change casually. Stable navigation reduces training for account managers and makes cloned reports easier to review.
Separate universal metrics from variable ones
Create a metric register before building. Mark each field as standard, optional, or client-specific. Standard fields might include date, source, campaign, spend, clicks, sessions, and agreed conversions. CRM stages and ecommerce revenue may be optional, while client-specific fields should sit in a documented extension layer outside the core template.
Record assumptions about attribution windows, currency, fiscal calendars, naming conventions, and conversion events. If two clients use different event names for the same action, resolve that difference in the source or mapping layer where possible. A complicated chart formula hides the issue and gives the next operator more maintenance work.
Use this digital marketing report component guide as a checklist for client-facing report content, then document the fields required on every page. The finished blueprint should show what gets cloned, what gets mapped, and which exceptions require approval.
Connecting and Blending Marketing Data Sources
The connection process is where many attractive templates fail. A report can look polished in a gallery and still depend on a specific property, account, field name, or third-party connector that a new client doesn't have.
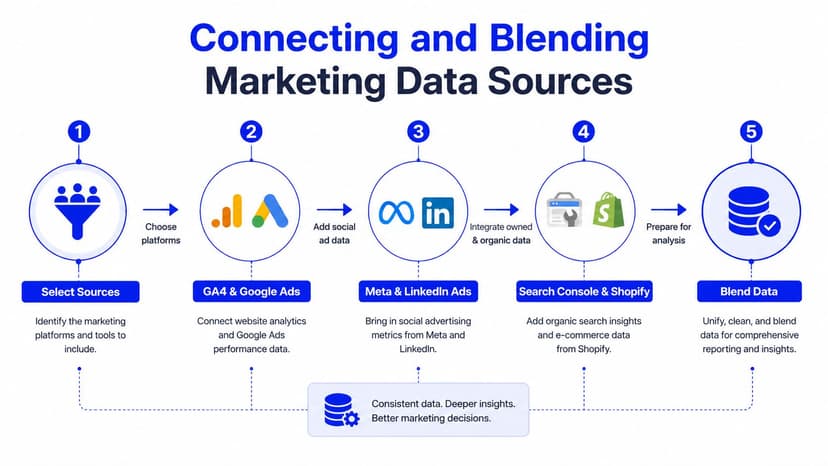
Start with a source inventory for each client. Common agency inputs include GA4, Google Ads, Meta Ads, LinkedIn Campaign Manager, Search Console, Shopify, WooCommerce, CRM systems, and email platforms. Decide which sources are essential to the core template and which belong to optional modules.
Build the source map first
For every connector, record the account owner, authentication method, required permissions, refresh expectations, and replacement process. Client-owned credentials can protect the agency from becoming the permanent owner of a client's access, but they can also create reconnect work when permissions change. Agency-managed connections can simplify administration, but they need clear internal ownership and offboarding controls.
Native connectors can keep the setup straightforward for Google-owned products. Partner connectors such as Supermetrics or Funnel.io may offer broader source coverage or more transformation options, but they add another dependency, subscription, and support path. Choose based on the client mix and the fields the template needs, not on the number of connectors advertised.
Standardize fields before blending
Blending becomes fragile when sources describe the same concept differently. One platform may call a result a conversion, another may use a lead, and GA4 may represent the action through an event. Create a common naming layer for dimensions and metrics before writing calculated fields.
A practical mapping sheet should include:
| Reporting concept | Source fields to map | Fallback decision |
|---|---|---|
| Date | Platform date fields | Use the agreed reporting timezone |
| Channel | Source, medium, platform, or campaign source | Apply a documented channel grouping |
| Cost | Ad-platform spend fields | Leave unavailable sources clearly marked |
| Conversion | GA4 event or platform result field | Define the approved business action |
| Campaign | Campaign name or identifier | Preserve a stable naming convention |
Blends should join on fields that align, such as date, campaign, or a normalized source label. Don't force a blend merely to place unrelated figures on one page. If a client lacks a dimension, use a clearly defined fallback or remove the dependent chart from that client's module.
A useful blended query builder update can help agencies think through cross-source reporting, but the operating rule remains the same: resolve schema differences before they reach the client dashboard.
One warning deserves special attention. Mixing GA4 and Universal Analytics field names can break charts, and GA4 data freshness can lag by up to 48 hours, according to agency reporting guidance. Label the report header with the data recency and comparison window so an account manager doesn't present an incomplete period as final. (Agency reporting template guidance)
Creating and Deploying the Template Across Clients
A report can look finished while still creating deployment risk. Across multiple accounts, the failures usually come from an unprotected master, inherited client connections, unclear permissions, or copies that drift from the approved structure.
Google's documented workflow uses a report URL with /preview appended to create a template. Google also notes that any report can become a template, so the technical conversion is straightforward. The operational controls require more attention. (Google's template creation workflow)
Protect the master
Keep the master report separate from client production copies. Use a staging version for layout changes, connector tests, and new calculated fields. Limit editing access to the people responsible for template maintenance, while account teams receive only the access required to configure or review client copies.
When the structure is ready, open the finished report and add /preview to its URL. Confirm that the preview contains no client data, then document which data sources the user must replace. A template should not rely on a live client connection that another account might inherit by mistake.
Use a deployment checklist
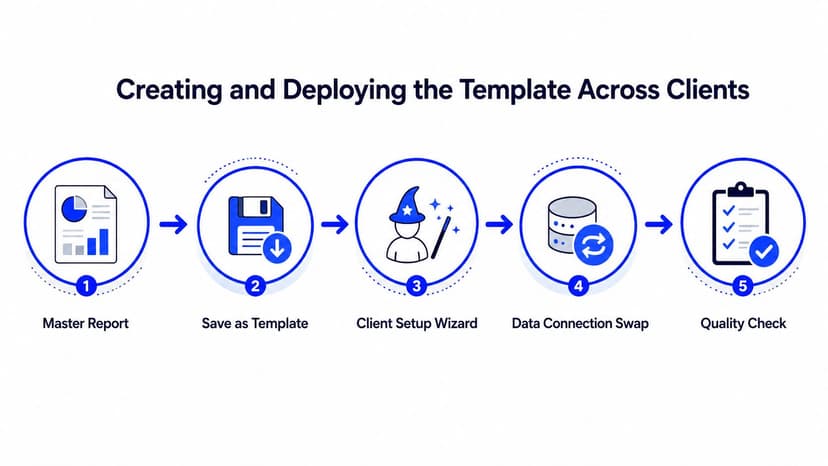
Deployers should copy the template and leave the master untouched. They then map each source deliberately, verify credentials, and inspect the report page by page.
- Copy ownership: Confirm that the new report belongs in the correct agency or client workspace.
- Data-source mapping: Replace every placeholder connection with the intended client property or account.
- Field validation: Check calculated metrics, filters, table dimensions, and blended keys after mapping.
- Permission review: Separate viewers from editors and avoid broad link sharing for sensitive client data.
- Client test: Open the report as a viewer and test date controls, page navigation, and visible labels.
Sharing gives access to an existing report. Copying creates a separate working asset that preserves the original layout while allowing client-specific connections. That distinction matters when an account manager needs to adapt a report without changing the agency standard.
Version control creates the larger maintenance burden. A master update will not safely rewrite every existing client copy, particularly when clients have approved custom pages or changed data sources. Keep a change log, use clear report naming conventions, and classify updates as mandatory, optional, or client-specific before publishing them. Over time, each exception increases the review work required for the next template release.
Branding and White-Label Delivery for Client Reports
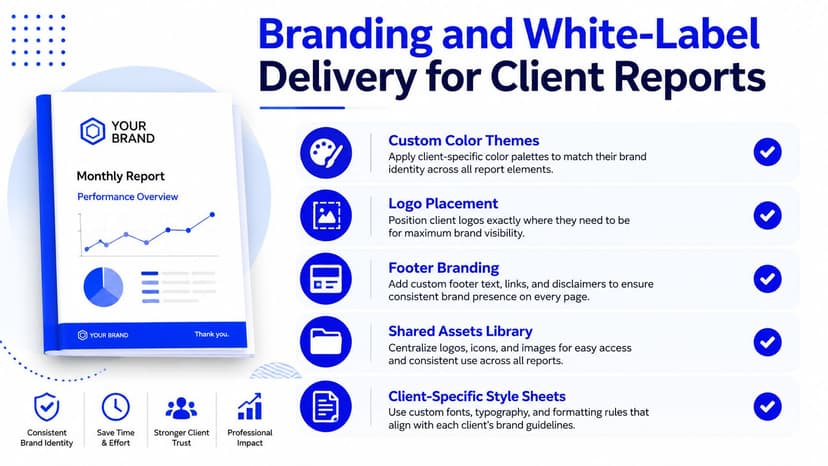
A client report should look like part of the agency's service from the first page. Looker Studio provides themes, logos, page layouts, colors, and sharing controls, but agencies still need operating rules for applying them across client copies. Across multiple accounts, small branding exceptions become maintenance work unless the template defines what can change and who approves it.
Start with a compact brand system. Document the agency palette, approved client accent colors, typography, chart styles, logo placement, and footer treatment. Keep the hierarchy consistent across accounts, then allow controlled changes such as a client logo, accent color, or cover-page note.
Make the template recognizable
Use a reusable theme instead of styling charts individually. Set page backgrounds, text hierarchy, table headers, scorecards, controls, and chart colors in that theme. Later style changes then have a consistent reference, which reduces the need to inspect every component in each client report.
Logo placement requires restraint. Position the agency or client mark so it supports recognition without competing with the report title, date range, or key result. A short data note can provide more practical value than extra decoration, especially when source freshness or attribution rules affect interpretation.
Scheduled email delivery supports recurring client reporting. Looker Studio lets teams schedule delivery from the Share menu, choose selected pages, set a send date and time, and select repeat frequency options such as custom schedules. Looker Studio Pro also supports personalizing scheduled emailed reports by filtering data according to the recipient's email address, provided each data source includes an email field. Google's scheduled delivery documentation
Know where the product stops
Looker Studio can produce a branded report experience, while agencies may still encounter platform branding, limited email design controls, and a gap between a polished dashboard and an agency-owned client portal. Embedding can improve continuity inside a client portal, but it adds implementation and permission work. A third-party delivery layer may provide more control, with another tool and workflow to maintain.
For agencies seeking white-label reporting, branded dashboards, custom domains, scheduled delivery, and reusable assets in one workflow, the Oviond white-label reporting tool offers one alternative to assembling those functions around Looker Studio. The important consideration is operational fit rather than visual polish. Assess whether the agency can maintain branding, access, delivery, and client-specific configuration without creating a separate manual process for every account.
When Looker Studio Templates Hit Their Limit
Looker Studio works well for flexible visual reporting, Google-native connections, and bespoke dashboards across a manageable number of accounts. The operating burden rises when every client copy becomes its own production system. A small change to the master report can require repeated edits, field checks, testing, permission reviews, and client explanations across the account list.
The question is whether the agency wants to own the connection maintenance, copy management, branding work, permission review, and delivery process around each metric. That responsibility grows with every cloned report, especially when clients use different account structures, naming conventions, or connector credentials.
| Dimension | Looker Studio Templates | Purpose-Built Platform, for example Oviond |
|---|---|---|
| New-client setup | Copy the report, map sources, test fields, and review permissions | Use reusable layouts and agency-oriented setup flows |
| Ongoing maintenance | Each client copy may need review when sources, fields, or layouts change | Centralized reporting workflows can reduce repeated configuration |
| Data blending | Flexible, but blends require careful keys, schemas, and validation | Cross-channel reporting is organized around recurring agency use cases |
| Branding | Themes, logos, embeds, and scheduled delivery are available, with platform constraints | White-label delivery, custom domains, branded reports, and sender options are built into the service |
| Team access | Permissions are managed across reports and data sources | Unlimited users support agency collaboration without per-seat fees |
| Report volume | Practical management depends on how many copies the team can maintain | Unlimited reports and dashboards are included in the stated platform offering |
| Commercial model | Tool and connector costs depend on the chosen setup | Pricing scales by client count, with features included in one plan |
A Looker Studio alternative for agencies becomes relevant when the reporting team needs more than a reusable canvas. Oviond presents agency reporting software with 70+ integrations, reusable templates, automated delivery, white-label dashboards, custom domains, calculated metrics, goals, and AI or MCP-assisted setup. These functions address the operating layer that a report template leaves to the agency, including repeatable deployment and client delivery.
AgencyAnalytics, Whatagraph, and Swydo also belong in the evaluation. Compare connector coverage, data transformations, branding controls, user access, automation, migration support, and pricing by client count. Looker Studio can remain a strong choice for bespoke work. A purpose-built platform may fit better when standardization, repeatable setup, and dependable client delivery outweigh maximum canvas flexibility.
Troubleshooting and Scaling Your Reporting Workflow
A report can look correct in the master file and still fail after deployment. Across multiple client accounts, the recurring problems usually involve permissions, field mapping, calculations, blends, data freshness, or slow rendering. A fixed diagnostic order keeps troubleshooting from turning into trial and error.
Start with the connection rather than the chart. If a cloned report displays errors, open the affected data source, run the reconnect workflow, and verify that the person making the change has the required credentials. Then compare the available fields with the template. A client source may use a different campaign dimension, conversion event, account ID, or naming convention, even when it appears to represent the same data.
Use a fixed diagnostic order
- Access first: Confirm that the connection still has an active owner and that client permissions have not changed.
- Schema second: Compare deployed dimensions and metrics with the fields required by the template.
- Calculation third: Test calculated fields separately, especially formulas tied to renamed or missing inputs.
- Blend fourth: Check that join keys use matching formats and the same level of granularity.
- Freshness fifth: Add a visible report-header label such as “Data through [latest available date]” and update it whenever the reporting window changes.
- Rendering last: Hide heavy tables or blends one at a time to identify the component causing slow loading or timeouts.
Keep staging and production copies separate. Name each report with the client, service line, environment, and revision, so an account manager can identify the approved version without opening every file. Maintain a change log for exceptions. A request that changes the core schema should prompt a template review, not an undocumented edit inside one client account.
Split a monolithic report when pages serve different audiences, rely on unrelated connectors, or repeatedly create performance problems. Narrow, role-specific pages and pre-aggregated daily tables can improve loading speed and reduce quota or latency pressure, as agency reporting guidance recommends. The same guidance notes that mixing GA4 and Universal Analytics field names can break charts. Keep connector-specific field conventions documented alongside the template rather than relying on memory. (Operational template guidance for agency dashboards)
The decision is operational. If the team can maintain copies, permissions, blends, branding, and delivery without recurring confusion, a Looker Studio report template remains useful. If every new client creates another disconnected workflow, consider an agency-native system that centralizes reusable dashboards, automated delivery, white-label presentation, and client-level configuration.
Oviond combines reusable client reporting templates, live dashboards, automated delivery, white-label branding, custom domains, 70+ integrations, and AI or MCP-assisted setup in one agency-focused workflow. If Looker Studio maintenance is becoming a recurring operations burden, visit Oviond to review an alternative approach to client reporting.
Related articles
Simplify marketing reporting today
Stop juggling multiple tools. Start presenting clear, automated reports your clients will love