
Oviond Blog
Shopify Dashboard for Agencies: What It Is, What It Misses
Learn what the Shopify dashboard shows and why agencies managing multiple stores need white-label client reporting that goes beyond native analytics.

Shopify's Analytics overview updates within about 1 minute and gives teams a near-real-time executive snapshot of sales, sessions, and fulfillment. It's useful for monitoring one store, but it isn't a white-label client reporting system for agencies managing multiple accounts.
That distinction matters most during the last week of the month. Your account managers are chasing exports, clients are asking why revenue changed, and every report needs to combine Shopify with paid media, search, email, and social data. The Shopify dashboard can give you a reliable starting point, but agencies need a layer that explains the numbers, keeps the client experience branded, and scales beyond one admin account.
Table of Contents
- The End-of-Month Reporting Reality for Agencies
- What the Shopify Dashboard Shows and How to Read It
- Where the Native Dashboard Falls Short for Agencies
- Native Shopify Dashboard Versus White-Label Client Reporting
- Connecting the Shopify Dashboard to a Third-Party Platform
- Building a Scalable Multi-Client Reporting Workflow
The End-of-Month Reporting Reality for Agencies
It's the final week of the month. One account manager has a Shopify export open beside Google Ads, another is checking Meta Ads, and someone else is asking a client for a screenshot because the usual file arrived with broken formulas. Twenty recurring reports are due, but every account has a slightly different layout, naming convention, and definition of success.
That's how reporting marathons start. The work rarely fails because the data doesn't exist. It fails because the data sits in too many places, arrives in different formats, and still needs a human to turn it into something a client can understand.

The Shopify dashboard is the usual starting point
For Shopify clients, the Analytics overview dashboard is usually the first place an agency checks. Shopify describes it as a core reporting surface for sales, sessions, and fulfillment, available from the admin and mobile app. Its cards can show metrics such as net sales by channel and sessions by device type, with each card opening a deeper report for investigation. Shopify's overview dashboard documentation also explains that the dashboard supports date comparisons and predefined ranges such as “today vs. yesterday” and “last 30 days.”
That makes it practical for a quick account check. An account manager can see whether sales are moving, whether traffic is concentrated on mobile, and whether fulfillment activity needs attention without building a spreadsheet first. For a broader view of ecommerce measurement, agencies can also use this ecommerce analytics resource when deciding which metrics belong in a recurring client report.
Practical rule: Use Shopify's native view to verify store activity. Don't mistake it for the finished client report.
Shopify has built reporting directly into the commerce platform rather than treating it as a separate add-on. The platform's international reach gives that design choice wide significance, with independent industry estimates placing Shopify's merchant base in the millions across more than 175 countries by late 2025 and 2026. Industry estimates on Shopify's scale describe a reporting layer used across North America, Europe, Asia-Pacific, and Latin America.
The agency question is different from the store-owner question. A store owner asks, “What happened in my shop?” An agency asks, “What happened across this account, why did it happen, how does it connect to the work we manage, and how do we deliver that explanation without rebuilding the report by hand?”
What the Shopify Dashboard Shows and How to Read It
Open Shopify Analytics and start with the cards, not the assumptions. The dashboard is designed as a customizable collection of metrics, so the useful question isn't “What can Shopify display?” It's “Which cards help this account manager make a decision today?”
Shopify says the Analytics page covers sales, sessions, and fulfillment, and that the data updates within about 1 minute. That refresh rate makes the dashboard suitable for live operational monitoring, especially when a client is running a promotion, launching a product, or investigating a sudden change in traffic. Shopify's Analytics overview documentation confirms the low-latency update behavior.

Read the cards in operational order
Start with sales, then traffic, then fulfillment. That sequence helps you separate the result from the activity behind it and the operational work required to support it.
Net sales by channel: This shows where sales are being attributed across the store's channels. If one channel changes sharply, open the card's linked report before offering an explanation. A channel shift might reflect a campaign, a product change, a reporting window, or a tracking issue.
Sessions by device type: Device breakdown gives an account manager a fast way to spot where visitors are browsing. A mobile-heavy account needs a different conversation from one where desktop sessions dominate, particularly when a client reports a conversion concern.
Fulfillment metrics: Fulfillment cards add operational context. Sales growth means something different when fulfillment activity is healthy than when orders are accumulating and delivery problems are affecting customer experience.
Use comparisons for questions, not decoration
The built-in date ranges are useful because they match the questions clients ask in meetings. “Today versus yesterday” supports a quick live check. “Last 30 days” gives a broader operating view. Comparisons work best when the period is connected to an action, such as checking a launch, reviewing a promotion, or explaining a channel movement.
The dashboard is for executive monitoring. Shopify's Reports area is for diagnosis. Cards can open into corresponding reports, while the Reports area supports custom explorations, filters, and reusable dimensions. Shopify's reports documentation describes that deeper workflow.
Useful habit: If a card raises a question, follow the drill-down before writing the client narrative.
A dashboard card tells you what moved. A deeper report helps you investigate where the movement came from. Agencies building broader KPI frameworks can use this ecommerce KPI guide to keep the client conversation focused on decisions rather than a long list of available metrics.
Where the Native Dashboard Falls Short for Agencies
The native Shopify dashboard is strong at store-level operational visibility. It becomes less useful when the agency needs to explain business quality, combine sources, or deliver a consistent branded experience to many clients.
Profitability is the clearest gap. Shopify's native analytics don't natively model the full economic picture of a client account, including profit, COGS, shipping costs, platform fees, or ad spend. That means revenue can look healthy while the agency still lacks enough context to answer the question clients care about: is the store growing profitably, or is it just generating more sales?
Independent analysis of Shopify analytics limitations highlights these gaps and also notes the lack of built-in cohort LTV on lower tiers. New automation and scheduled analytics features can make reporting faster, but they don't automatically solve attribution, profitability, or predictive retention analysis.
Revenue is not the same as account health
An agency report that stops at sales and sessions can leave out the evidence needed for a serious performance discussion.
- Profitability: Revenue needs to be read alongside costs that the native view doesn't fully model.
- Customer quality: New orders don't explain whether customers return or whether acquisition is becoming less efficient.
- Retention: Cohort and LTV analysis may require additional tools, calculations, or data connections.
- Attribution: Shopify activity alone doesn't explain the full relationship between spend, search visibility, email, and social activity.
This isn't a reason to abandon Shopify Analytics. It's a reason to define its job correctly. Keep it as the operational source for store activity, then bring in the other sources required for a client-level explanation.
Branding creates a second problem
The native dashboard is built for access inside Shopify. It isn't designed to become an agency-branded portal with a custom domain, branded sender, and client-ready navigation. An account manager can share findings from it, but the client experience still belongs to Shopify.
That matters when an agency manages recurring reporting. The link, email, layout, and terminology should feel consistent from account to account. Agencies researching ways to scale client results on Reddit may also find the broader agency workflow discussion useful, particularly when reporting becomes part of the service experience rather than an internal task.
For a deeper look at why branding and presentation matter, agencies can review this guide to white-label marketing dashboards. The practical conclusion is simple: Shopify's dashboard is an excellent internal checkpoint, but it isn't a complete white-label client reporting solution.
Native Shopify Dashboard Versus White-Label Client Reporting
The choice isn't really between “good” and “bad” software. It's between two jobs.
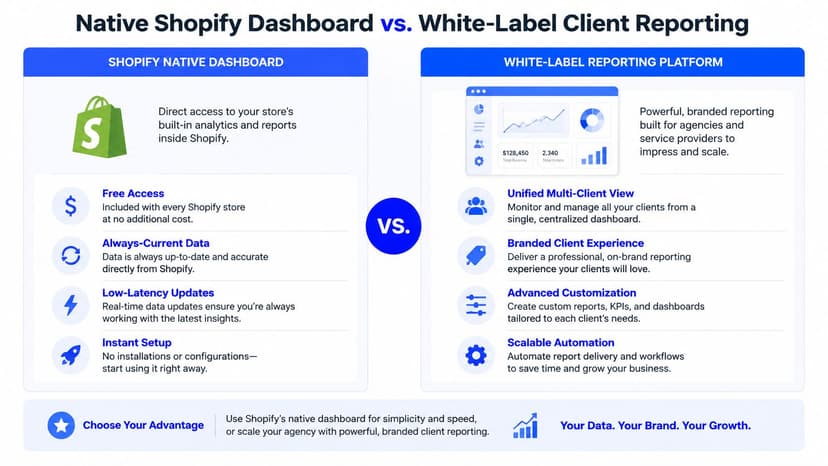
The native Shopify dashboard is the right tool when someone needs to open a store and check current sales, sessions, or fulfillment activity. It's available inside the Shopify admin, updates within about 1 minute, and requires no separate reporting setup for that store. For a store owner or an account manager doing a quick operational check, that simplicity has real value.
A white-label reporting platform solves a different problem. It gives the agency a client-facing layer where Shopify can sit alongside Google Analytics, paid advertising, social, email, CRM, and search data. The question is whether the agency needs a store view or a repeatable reporting system.
Compare the workflow, not the feature count
| Agency requirement | Native Shopify dashboard | White-label client reporting |
|---|---|---|
| Store activity | Strong for Shopify sales, sessions, and fulfillment | Can include Shopify alongside other channels |
| Current monitoring | Updates within about 1 minute | Depends on the platform's connection and refresh process |
| Client branding | Shopify admin experience | Agency styling, branded reports, and custom domain options |
| Scheduled delivery | Not the central workflow | Built for recurring automated delivery |
| Multi-source reporting | Shopify-focused | Designed to blend ecommerce, analytics, ads, search, social, email, and CRM |
| Investigation | Cards open into deeper Shopify reports | Custom metrics, calculations, goals, and cross-source views may be available |
Ask practical questions before choosing the setup:
- Can the client open the report without seeing a vendor subdomain?
- Can the agency send the report automatically instead of attaching a PDF manually?
- Can Shopify sales sit beside Facebook Ads spend and Google Search Console performance?
- Can the team reuse one approved template across multiple accounts?
- Can account managers adjust the view without rebuilding every chart?
White-label reporting commonly replaces a vendor subdomain with an agency-owned address such as reports.youragency.com. DashThis' white-label documentation describes this approach as using the agency's own domain so the vendor URL isn't visible. Custom-domain setup usually requires DNS configuration, and propagation can take from about 15 minutes to 72 hours, depending on the platform and setup. Swydo's white-label reporting guide explains that activation may take about an hour or more in some cases.
Branded delivery also needs to cover the inbox. Some platforms support authenticated agency-domain sending, so messages can come from an address such as reports@yourcompany.com and pass SPF and DKIM checks. ClicData's white-label platform documentation describes this email-side branding.
For a practical implementation guide, agencies can review how to white-label digital marketing reports and dashboards. The trade-off is clear. Shopify keeps store monitoring simple. A third-party layer adds setup and governance, but it gives agencies the control required for branded, multi-client delivery.
Connecting the Shopify Dashboard to a Third-Party Platform
Connection work should be repeatable. If every account manager uses a different process, the agency eventually gets duplicate dashboards, inconsistent permissions, and reports that no one knows how to maintain.
Start with one client store and document each step before rolling the process across the account base.
A practical connection sequence
Create the reporting workspace: Set up the client project in your reporting platform and decide who can edit, approve, and view the report. Keep client access separate from internal configuration access.
Find the Shopify connector: Open the integrations or data sources area and search for Shopify. Platforms vary in how they authorize the connection, so follow the connector's documented permission flow rather than passing credentials around in chat.
Authorize the store: The connection may use store admin authorization or an API token, depending on the platform. Confirm that the connected store is the intended
.myshopify.comdomain before building any charts.Validate the pull: Check a small group of familiar metrics against Shopify Analytics. Validate the date range, channel labels, currency treatment, and refresh behavior before adding paid media or search data.
Build the first client view: Add only the measures that support the client's reporting conversation. A compact dashboard that explains movement is more useful than a screen filled with every available field.
Bundle KPIs around decisions
A useful ecommerce dashboard usually combines Shopify activity with the channels the agency manages. A client might need net sales by channel, conversion rate trends, average order value, and top-performing products, then compare those outcomes with paid media spend and organic search performance.
Calculated metrics are useful when the native source doesn't provide the business ratio you need. Goals can also give the report a clear reference point by setting targets on selected metrics and tracking progress. Keep definitions visible in the dashboard, especially when “revenue,” “sales,” “orders,” and “conversion rate” have different meanings across platforms.
Data check: Don't publish a blended metric until someone has verified the source fields, date range, attribution setting, and calculation.
A connector reduces exports, but it doesn't remove the need for governance. Name data sources consistently, save reusable queries, and record which metrics belong to the standard template. If the client changes its tracking setup, the account manager should know which cards need review.
Looker Studio is another credible option for agencies that want a flexible reporting builder. It supports scheduled automatic delivery through the report's Share menu, where users select schedule delivery. Google's Looker Studio documentation covers that built-in workflow. The trade-off is operational consistency. Without clear templates, permissions, naming rules, and ownership, a flexible tool can turn into another reporting system that depends on one person who knows how it was built.
Building a Scalable Multi-Client Reporting Workflow
Scaling from a handful of clients to dozens isn't solved by adding charts faster. It's solved by making the reporting process predictable enough that a new account doesn't create a new reporting method.
Use the Shopify dashboard as the verified store activity layer. Add the agency layer for branding, multi-source context, calculated metrics, goals, and delivery. The workflow below works because it separates account decisions from repetitive production work.
Start with a controlled rollout
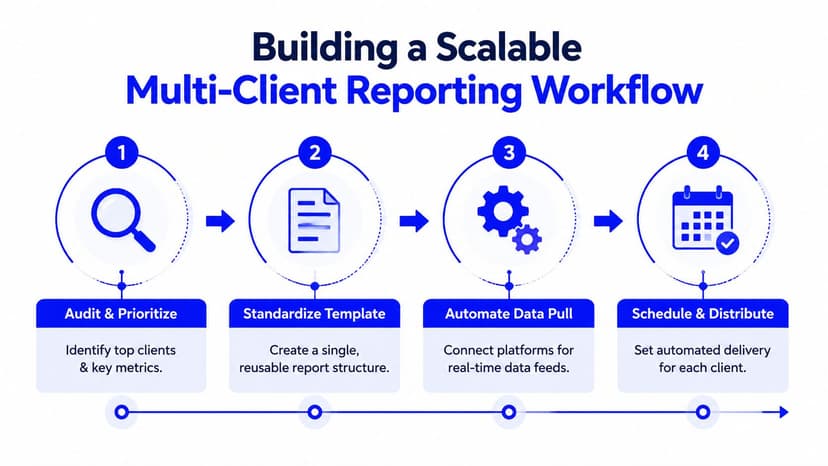
Begin with your top five clients, not every account at once. Choose stores with different reporting needs, such as a paid media-heavy account, a search-led account, and one where fulfillment or retention is central to the conversation.
For each client, write down:
- The decision: What should the client do after reading the report?
- The Shopify evidence: Which sales, sessions, or fulfillment cards support that decision?
- The supporting sources: Which analytics, ad, search, social, email, or CRM connections add context?
- The missing economics: Which profitability or retention measures need custom data or calculations?
- The delivery standard: Which sender, custom domain, cadence, and approval process should the client receive?
This audit prevents the common mistake of copying a dashboard template before anyone agrees on what the report needs to explain.
Turn the first report into a reusable system
Build one approved template with clear sections for business outcome, channel contribution, product movement, customer quality, and action items. Don't force every client into identical KPIs, but keep the structure stable so the team knows where to find the important information.
A platform such as Oviond can serve as the white-label reporting layer, with Shopify and other marketing data connections, branded dashboards, scheduled reports, calculated metrics, goals, unlimited reports and dashboards, unlimited team users, and full API access included in its agency-oriented setup. Its pricing is based on client count, and its available connections include Shopify among a broader set of sources. Agencies can also use AI or MCP-assisted setup where that fits their internal process.
The tool matters less than the operating rules around it. Assign ownership for data connections, template changes, client approvals, and delivery failures. Keep a change log for metrics, because a silent definition change can create more confusion than a missing chart.
Automate delivery without abandoning review
White-label platforms can support automated report delivery, custom domains, and custom email senders. That removes the recurring task of exporting files and attaching them manually, while preserving the agency's branding through the portal and inbox.
Automation still needs a review step. Before a report goes out, check whether a tracking issue, promotion, stock problem, or unusual fulfillment event changes the interpretation. The report should send itself, but the agency's judgment shouldn't.
Operating principle: Automate the assembly and delivery. Keep human review focused on explanation, context, and next actions.
The Shopify dashboard remains valuable because it provides a direct operational view of the store. Agencies need more when they manage multiple accounts, blend channels, explain profitability gaps, and protect a consistent client experience. With reusable templates, controlled connections, scheduled delivery, and clear ownership, reporting stops being a monthly rescue project.
Watch the workflow in practice:
Agency reporting should finally feel simple. Visit Oviond to connect Shopify with your wider marketing stack, build branded dashboards, and automate recurring client reporting from one agency-focused workspace. Use it to replace spreadsheet chasing and Looker Studio sprawl with a consistent reporting process your account team can maintain.
Related articles
Simplify marketing reporting today
Stop juggling multiple tools. Start presenting clear, automated reports your clients will love