
Oviond Blog
Social Media Reporting Tool: The Agency Guide
Find the right social media reporting tool for your agency. Compare features, KPIs, automation, and white-label options to scale client reporting

Your client report is due tomorrow. The data is spread across native platform dashboards, exported spreadsheets, old Looker Studio links, and a folder of logos that may or may not contain the latest brand kit. Someone on the account team is still checking whether last month's figures were copied correctly, while the client wants a clear answer to one question: what did social media contribute?
That workflow becomes harder with every new client, platform, custom metric, and delivery preference. For agencies managing 5 to 50 or more client accounts, a social media reporting tool needs to do more than display attractive charts. It needs to collect dependable data, preserve context, support reusable templates, and deliver a branded report without another round of manual assembly.
Table of Contents
- What a Social Media Reporting Tool Does for Agencies
- Core Features and KPIs Every Agency Should Expect
- Why Automation and White-Labeling Change the Agency Game
- How Oviond Compares to Looker Studio and Other Agency Tools
- Implementation Checklist for Onboarding Your First Clients
- Example Dashboards and Report Templates Clients Read
- Measuring ROI Beyond the Dashboard
What a Social Media Reporting Tool Does for Agencies
A client report often looks like a dashboard problem, but the expensive work happens around it. An agency may need to apply each client's branding, schedule delivery on a different cadence, define custom metrics, and explain why the numbers matter. A social media reporting tool connects platform data to that operating process, giving the team a repeatable way to collect, organize, interpret, and deliver results.
Native analytics work well for inspecting one account. They become cumbersome when an account manager compares paid and organic activity, combines several networks, applies an agency-specific formula, and prepares a consistent client-facing report. Spreadsheets allow nearly any structure, but that flexibility shifts the labor to the team: collect, clean, label, calculate, format, check, and send.
The hidden cost is repetition across accounts. Each new logo, report schedule, custom metric, and approval preference creates another variation for the team to maintain. A platform earns its place by reducing those variations, not merely by displaying attractive charts.
Reporting platforms have developed beyond basic export utilities. Hootsuite describes analytics retrieval at least once a day, historical backfill ranging from 28 days to up to 12 months depending on the network and account type, and indefinite storage for some post and page-level metrics in its available report data documentation. That makes the reporting layer useful for recurring views and trend reviews, provided the agency checks each network's retention and API limits before promising historical coverage.
The agency view of reporting
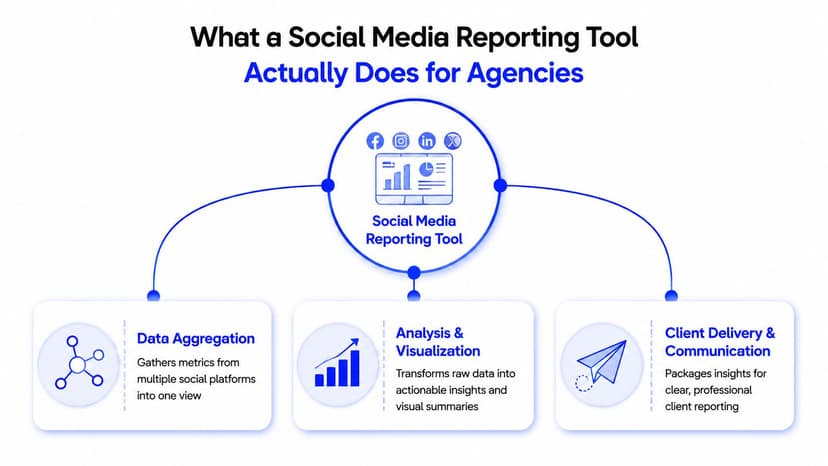
An agency workflow has three connected jobs:
- Data aggregation: Bring social profiles, advertising accounts, and supporting sources into a client view without repeated copying.
- Analysis and visualization: Turn reach, impressions, engagement, follower, video, and conversion data into answers to a specific client question.
- Client delivery: Apply the agency's visual identity, set the delivery cadence, and control who can view or edit the report.
Delivery is often the overlooked workload. An internal dashboard can still create manual tasks if the team must remove vendor branding, rebuild layouts, export files, and email each client separately. Reusable templates, client-specific fields, scheduled distribution, and custom calculations matter because they reduce maintenance across the account roster.
Reporting also needs to support strategy. A resource on bedding brand social media strategy can help an account team connect channel activity with positioning and content decisions. The report should make that discussion easier, not bury it under disconnected totals.
Practical rule: If a tool does not reduce collection, interpretation, or delivery work, it adds another screen instead of solving the agency's reporting problem.
Core Features and KPIs Every Agency Should Expect
The first filter is coverage. A tool should connect the networks your clients use and bring post-level, profile-level, and engagement metrics into a consistent workspace. API-driven aggregation can make reach, impressions, follower growth, and video analytics available in dashboards or business intelligence tools, with up to 12 months of historical data available for trend and year-over-year analysis according to Socialinsider's social media API overview.
That history comes with a condition. Platform APIs define what can be collected, how much history remains available, and which metrics are exposed. A polished interface can't restore data the source platform doesn't provide. Before migration, verify the retention window and API coverage for every important network.
The feature checklist
A credible agency setup usually needs the following capabilities:
- Multi-channel aggregation: Keep paid and organic social data in one client view instead of separate exports.
- Drag-and-drop building: Reuse a report structure while changing the order, chart type, notes, and client-specific sections.
- Calculated metrics: Create formulas for engagement rate, blended performance, or other definitions that matter to the account team.
- Goal tracking: Set a target against a selected metric and show progress in the same place as actual performance.
- Custom queries: Answer questions that aren't available as a native platform tile, such as performance by campaign label or content category.
- API access: Give technical teams a path to extend the reporting layer when a client's data needs exceed standard connectors.
- Reusable assets: Save layouts, queries, text blocks, and visual components so a new account doesn't start from a blank page.
A basic export tool may handle the first item. Scaling agencies need the full workflow because clients rarely ask for a single platform total. They ask why reach changed, whether video content held attention, which campaign generated meaningful action, and how the result compares with the agreed objective.
KPIs that support a client conversation
Start with reach and impressions to establish distribution. Use engagement rate to discuss interaction quality, but define the calculation clearly because platforms and teams may use different formulas. Follower growth can provide audience context, while video completion helps explain whether the creative kept viewers engaged.
Conversion metrics belong in the report when the data connection supports them. They're more useful when paired with landing-page or CRM information, rather than presented as isolated social totals. A client report should make the next decision easier, not just prove that the team collected data.
Why Automation and White-Labeling Change the Agency Game
Manual reporting doesn't end when the numbers are collected. An account manager still has to apply the client's logo, check the reporting period, adjust the commentary, confirm the recipient list, export the file, and send it from the right address. Multiply that process across a multi-client roster and reporting becomes an operational queue, not a strategic service.
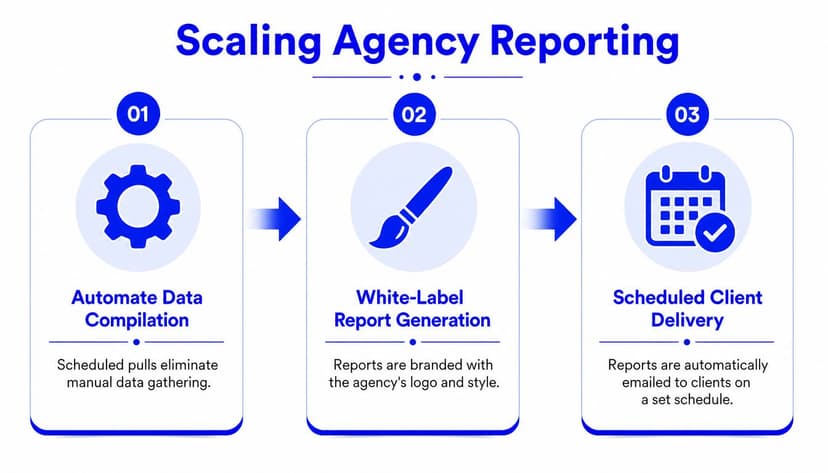
Automation changes the sequence. The system refreshes connected sources, applies the saved report structure, generates the output, and delivers it on schedule. White-label reporting workflows commonly connect scheduled refresh, transformation, report generation, and email delivery without requiring a manual export at each stage.
Branding is part of the service
White-labeling isn't decorative. Clients experience the reporting process through the dashboard URL, email sender, report design, and language used in the commentary. A vendor-branded portal can make the agency feel like a reseller, even when the analysis is strong.
A white-label marketing dashboard is a live, client-facing interface that uses the agency's branding and can sit on the agency's custom domain instead of a third-party URL, as described by AgencyAnalytics' white-label feature documentation. That gives the account team one consistent answer when a client asks where to find current performance.
Custom domains also reduce version confusion. A client can open the same branded destination and see the current dashboard, while the scheduled summary provides a formal review artifact. The team doesn't need to explain which PDF is latest or resend a file because someone opened an old attachment.
Automation needs to cover the whole workflow
Scheduling a report is useful, but it isn't the same as automating reporting. Ask whether the tool can refresh data, apply client-specific filters, generate the correct format, use a custom sender, and deliver on the agreed cadence.
Agencies should also test exceptions. A disconnected ad account, an expired permission, or an empty date range can create a report that sends successfully but tells the client very little. Build an internal review step for failed connections and unusual values, even when delivery itself is automatic.
For a detailed explanation of how branded dashboards fit into agency operations, see this white-label marketing dashboard guide.
How Oviond Compares to Looker Studio and Other Agency Tools
The right comparison isn't a feature-count contest. Agency owners should evaluate how each platform handles recurring client delivery, branding, access, data connections, and pricing as the client roster changes.
Looker Studio remains useful for teams that want flexible visualization and already have the skills and connectors to maintain it. Its agency limitations become visible when the workflow requires a client portal, alerting, custom domains, and built-in scheduled delivery. Independent commentary on agency reporting after Looker Studio describes the resulting manual work, including sending links and exports account by account.
AgencyAnalytics, Whatagraph, and Swydo each approach agency reporting with different balances between dashboards, integrations, automation, and presentation. The practical question is whether the tool matches your delivery process, not whether it has a longer feature page.
Agency Reporting Tool Comparison
| Feature | Oviond | Looker Studio | AgencyAnalytics | Whatagraph | Swydo |
|---|---|---|---|---|---|
| White-label delivery | White-label reports and dashboards, custom domain options, and custom email senders | Branding controls exist, but agency delivery can require additional manual handling | Strong agency-focused white-label workflow | Agency-oriented branded reporting | Agency-focused reporting and branding |
| Scheduled delivery | Automated report delivery and recurring data refresh | Commonly requires manual link or export workflows when built-in delivery is insufficient | Scheduled reporting available | Scheduled reporting available | Scheduled reporting available |
| Custom domains | Supported for client-facing delivery | Not built in as a complete branded client portal experience | Supported in white-label workflows | Availability depends on plan and setup | Availability depends on plan and setup |
| Pricing model | One plan, pricing by client count | Product access is separate from the agency workflow you build around it | Tiered platform pricing | Tiered platform pricing | Tiered platform pricing |
| Integrations | 50+ connections across analytics, paid media, search, social, email, CRM, and e-commerce | Broad connector ecosystem, with configuration responsibility on the team | Broad marketing reporting connections | Broad marketing and advertising connections | Marketing and advertising connections |
| Team access | Unlimited users without per-seat fees | Sharing permissions depend on the Google workspace setup | Team access varies by plan | Team access varies by plan | Team access varies by plan |
| Custom metrics and goals | Custom queries, calculated metrics, blended metrics, and goals | Calculated fields and flexible charts, with more setup responsibility | Customization available within platform structure | Custom metrics and report customization available | Custom metrics and report customization available |
Oviond's model is built around all features in one plan, unlimited reports and dashboards, unlimited users, white-label delivery, custom domains, and pricing by client count. It also supports AI and MCP-assisted setup, which may help teams create reporting assets through assistants such as Claude or ChatGPT.
That doesn't make every alternative a poor fit. Looker Studio can suit an agency comfortable maintaining its own reporting architecture. AgencyAnalytics, Whatagraph, and Swydo may fit teams that prefer their particular interface, connector mix, or workflow. Agencies comparing migration paths can use this Looker Studio alternatives comparison to assess the trade-offs against their own client process.
Implementation Checklist for Onboarding Your First Clients
A reporting migration fails when the team treats it as a design project instead of an operations project. Start with the recurring questions clients ask, then build the data and delivery system around those questions.
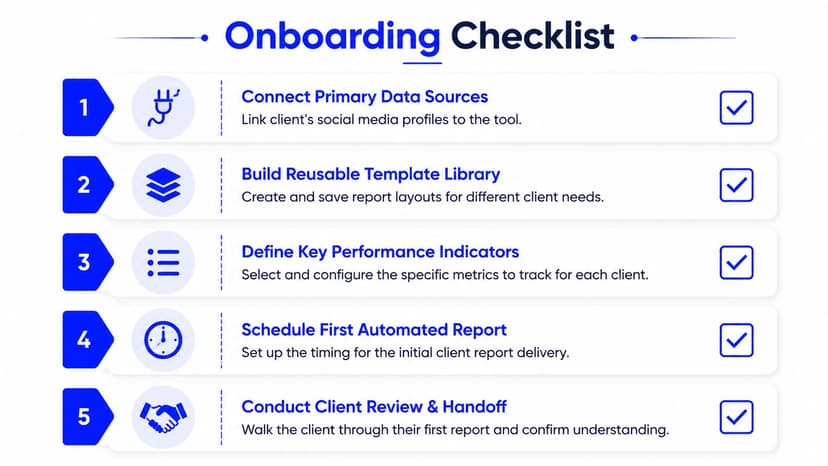
Five steps for a repeatable setup
Connect the primary sources. Link the client's organic profiles and advertising accounts first. Add analytics, search, email, CRM, or e-commerce sources only when they help answer a defined reporting question. Check permissions and date availability before building the layout.
Create a reusable template library. Build a small set of structures, such as monthly social performance, paid social campaign review, and multi-channel marketing summary. Keep the layout stable while allowing space for client-specific notes and goals.
Define the KPIs before styling the report. Select the metrics the client agreed to review. Configure calculated metrics, blended data, filters, and goals before adding decorative elements. A clean report with unclear definitions still creates support work.
Schedule the first automated report. Choose the delivery cadence, recipient list, sender identity, domain, and output format. Send an internal test before the client receives anything. Check the date range, time zone, logo, links, permissions, and commentary.
Conduct the client review and handoff. Walk through the first report and explain where the live dashboard differs from the scheduled summary. Confirm which sections support decisions and which can be removed from future versions.
Avoid the setup traps
Over-customizing every report creates a new template problem. Standardize the structure, naming conventions, and core KPI definitions, then customize the interpretation. Account managers should be able to recognize the layout across clients without forcing every account into identical messaging.
Also avoid connecting every possible data source on day one. More connectors can create more noise, unclear ownership, and confusing client conversations. A social media reporting tool earns its place when it makes the agreed workflow easier to run.
For a fuller agency process, use this client onboarding checklist for digital marketing agencies.
Example Dashboards and Report Templates Clients Read
A report earns attention when it answers three questions quickly: how performance changed, why it changed, and what the client should do next. Agencies also need a repeatable structure. Rebuilding branding, schedules, and custom metrics for every account turns reporting into ongoing production work.

The monthly performance summary
Place the account's goals first, then show reach, impressions, engagement rate, follower growth, and the strongest content examples. Add a brief interpretation beside each meaningful change. “Reach increased” records a result. “The campaign reached more people after the creative moved toward short-form video” creates a useful client discussion, provided the data supports it.
A live dashboard suits ongoing access. A scheduled PDF or email summary supports a formal monthly review, particularly when the account manager adds commentary and recommendations. Standardized sections reduce review time, while account-level branding keeps the report client-ready.
The campaign analysis
A campaign report should isolate the campaign, audience, platform, creative group, and conversion path when the connected data supports those views. Include spend, impressions, clicks, engagement, and conversion metrics for paid activity, then compare results with the campaign goal.
Label campaign and always-on activity separately. Combining a launch with unrelated posts and evergreen ads makes performance harder to assess and can lead to the wrong recommendation.
The executive overview
Senior client contacts often need a concise cross-channel view. Use a small set of outcome-focused metrics, a plain-language summary, and three actions for the next period. Keep platform details on a supporting page, so each stakeholder sees the level of detail relevant to their decisions.
Oviond offers social media marketing reporting templates that agencies can adapt for social performance and paid media reporting. Prebuilt layouts can shorten setup, but the account team still needs to remove irrelevant widgets, apply the correct branding, and write the interpretation. Templates improve consistency. They do not create strategy on their own.
Measuring ROI Beyond the Dashboard
A prettier dashboard doesn't prove that the reporting process works. Agency owners should measure the operational result: how much manual handling remains, how often clients ask for corrected figures, whether account managers can reuse assets, and whether the agency can add accounts without rebuilding the reporting function.
Attribution is a separate challenge from visualization. Independent coverage identifies restricted organic data access, privacy changes, and fragmented systems as reasons marketers still struggle to connect social activity with campaign effectiveness. A cited 2025 State of Your Stack survey identified data integration as the number one barrier to effective marketing measurement, according to Improvado's analysis of social media reporting. A dashboard can show a conversion event without proving that social caused the revenue.
The operational scorecard
Track the reporting process itself:
- Manual handling: Record where staff still export, rename, format, or resend files.
- Client support: Note recurring questions about missing data, old links, or unclear definitions.
- Consistency: Check whether each account uses approved KPI names, date ranges, and commentary standards.
- Capacity: Ask whether a new client can use an existing template and delivery workflow instead of requiring a custom build.
- Client confidence: Review whether stakeholders open the dashboard, discuss the findings, and understand the next action.
The same discipline applies outside commercial marketing. Teams learning how to track ministry impact metrics can use the same principle, connecting channel activity to a defined outcome rather than treating engagement as the final answer.
Oviond's pricing scales by client count, and the platform combines live dashboards, scheduled branded reports, white-label delivery, custom domains, 60+ integrations, calculated metrics, goals, unlimited reports, unlimited dashboards, and unlimited users in one agency reporting environment. The value isn't the dashboard alone. It's the reduction of repeated work across every account.
If your agency is still rebuilding social reports in spreadsheets or maintaining a patchwork of Looker Studio links, visit Oviond to see how white-label dashboards, custom domains, reusable templates, and automated delivery can bring the workflow into one place. Start with one recurring client report, test the full refresh-to-delivery process, and decide from the operational result.
Related articles
Simplify marketing reporting today
Stop juggling multiple tools. Start presenting clear, automated reports your clients will love