
Oviond Blog
White Label SEO Reports That Scale Across Clients
White label SEO reports built for agencies: core metrics, branded delivery, automation tips, and how Oviond simplifies multi-client reporting at scale.

Monday morning starts the same way for too many agencies. One account manager is exporting Search Console data, another is hunting down GA4 access, someone else is pasting backlink notes into a deck, and the report that was supposed to go out before lunch still needs branding, client-specific comments, and one more round of cleanup. That's the white label SEO reports problem, not the logo, but the monthly rebuild hiding behind it.
Once reporting turns into a recurring scramble, agencies lose time in all the small places. Version confusion creeps in, metrics get copied by hand, and every client ends up with a slightly different story about what happened last month. The fix is a standard reporting operating model, branded delivery, and automation that keeps the same structure moving across every account without turning the team into spreadsheet operators.
Table of Contents
- The Monday Morning Reporting Problem
- What White Label SEO Reports Actually Are
- The Sections Every SEO Report Should Contain
- Core Metrics and Where They Come From
- How Agencies Build These Reports Today
- Setting Up Branded Delivery at Scale
- Where Oviond Fits the Agency Workflow
- A Practical Rollout Checklist
The Monday Morning Reporting Problem
The bad version of agency reporting looks like this. Ten clients need updates, half the data is waiting on logins, one account still uses last month's template, and someone has to explain why the screenshots don't match the numbers in the deck. By noon, the team has spent more time assembling reports than interpreting them.
That's why white label SEO reports are an operating choice. They decide whether the agency keeps rebuilding deliverables from scratch or runs a repeatable system that carries the same brand, structure, and cadence every time.
Why the manual approach breaks first
Manual exports work when the roster is tiny and the deliverable is informal. They break when the agency adds even a modest amount of volume, because each new client adds another folder, another file version, and another chance to miss a field or paste the wrong period. The pain is not just effort, it's inconsistency.
A report that arrives with a different layout every month trains clients to treat it like a handoff, not a management tool. A standard format does the opposite. It gives account managers a fixed rhythm, makes review easier, and keeps the work from becoming a monthly fire drill.
Practical rule: if the team has to rebuild the same report twice, the workflow is already too manual.
The agencies that scale reporting smoothly usually stop thinking about reports as documents and start thinking about them as a system. Once the template is fixed, the recurring delivery becomes the main job, not the assembly. That shift is what frees account managers to spend time on the conversation clients care about, instead of formatting cleanup.
What White Label SEO Reports Actually Are
A white-label SEO report is a client-facing deliverable that carries the agency's own identity instead of the software vendor's. In practice, that means the client sees the agency name, the agency domain, and the agency's tone, whether the report lives in a dashboard or arrives on a schedule.
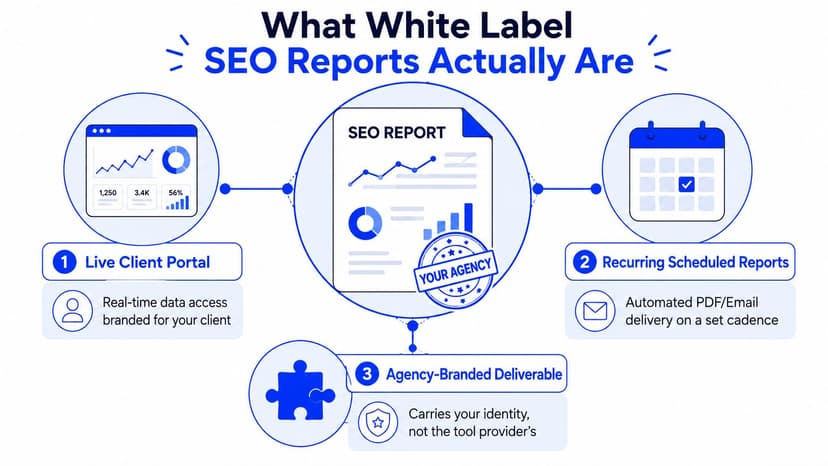
Two delivery formats agencies actually use
The first format is a live dashboard shared by link or embed. Clients can open it whenever they need current numbers, and the agency doesn't have to regenerate a PDF every cycle. The second format is a scheduled report, usually sent by email or link on a fixed cadence, which works well when the client expects a packaged update rather than a portal.
The difference matters because the delivery format changes the operating burden. A static file needs repeated assembly and version control. A live or scheduled report can be connected once, branded once, and then refreshed on its own.
What white-label means in real terms
White-label is more than removing a logo from the footer. It means the report does not expose the tool vendor through the URL, sender name, or visible interface. It also means the client experience feels like one consistent agency workflow, not a patchwork of tools.
A custom domain and custom email sender are the mechanics that make that feel real. Without them, the report can still look polished, but it doesn't fully behave like the agency owns the delivery. That gap is what clients notice when they forward the report internally.
For a clean definition of the reporting side, the overview at Oviond's SEO reporting guide is useful context. The important point is simple. A white-label report is a branded client asset, not a renamed export.
A report that still feels like software output, even after the branding pass, isn't really white label yet.
The Sections Every SEO Report Should Contain
A serious report is layered. It does not dump every number onto one page and call it done. It starts with a plain-English summary, then moves into search performance, technical health, content and authority signals, and finally the business outcome layer that shows what the work produced.
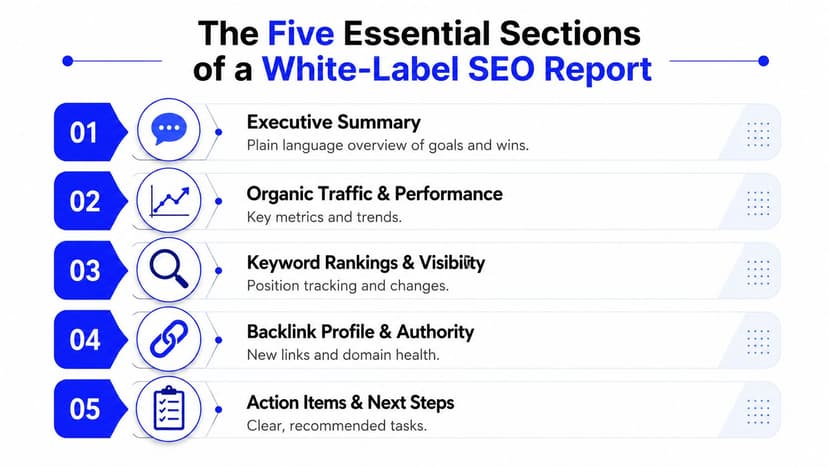
The five working layers
The executive summary answers what changed and what matters. The search performance section shows impressions, clicks, CTR, and ranking movement. The technical layer covers crawlability, indexation, speed issues, and page-level friction that can hold growth back.
The content and backlink layer shows whether authority is building in the right places. The business-outcome layer closes the loop by tying organic work to leads, conversions, revenue, or other client goals. That order matters because each layer answers a different question, and agencies that skip one usually end up answering client questions twice.
Decision rule: if a section does not help an SEO lead, a developer, or a client decision-maker act differently, it probably does not belong in the core report.
Assign each layer to a source
Search performance belongs to Google Search Console. Business outcomes live in GA4 or the client's revenue system. Technical checks belong to the audit layer, where page health and site structure can be separated from traffic trends.
That separation is what makes the report useful. A ranking drop caused by crawl trouble needs a different response than a ranking drop caused by weaker content or lost authority. When those signals are mixed together, account managers end up guessing instead of explaining. Clean source mapping keeps the report from turning into a pile of disconnected charts.
For a practical reference on which SEO metrics belong in each layer, see this SEO metrics reference. The report should show the right layer of the work, not just the most visible one.
Core Metrics and Where They Come From
A white label SEO report falls apart fast when the metrics are random. An agency team needs a fixed stack, the same core fields in every client file, and a clear source for each one. Otherwise the report turns into a monthly rebuild, and the account manager spends the call explaining formatting instead of performance.
Search Console supplies impressions, clicks, CTR, and average position. GA4 adds sessions, users and new users, conversions, revenue, and e-commerce transactions. That split gives the client both search visibility and business impact, which is the point of the report.
Search metrics and business metrics belong together
Ranking movement on its own is a partial story. If the report only shows visibility, the client has to guess whether that visibility led to anything useful. Once traffic and conversion data sit beside search data, the conversation becomes much easier to have.
That is why white label reporting should connect organic work to the rest of the client story. The report should show where attention went, what changed, and what that change produced. Agencies save time when that logic is standardized across accounts instead of rebuilt for every monthly delivery.
| Metric | What it measures | Primary source |
|---|---|---|
| Impressions | How often pages appeared in search results | Google Search Console |
| Clicks | Search visits generated from result listings | Google Search Console |
| CTR | The share of impressions that turned into clicks | Google Search Console |
| Average position | Where a page or query tended to rank | Google Search Console |
| Sessions | Visits that reached the site | GA4 |
| Users and new users | Audience size and new audience growth | GA4 |
| Conversions | Completed actions that matter to the client | GA4 or connected systems |
| Revenue | Monetary return tied to tracked actions | GA4 or connected systems |
| E-commerce transactions | Purchase activity recorded in the store flow | GA4 or connected systems |
Technical and authority signals do a different job
Backlink and referring-domain summaries belong in the authority layer. They help explain whether trust signals are rising or slipping over time. Technical checks belong in the diagnostic layer, where robots.txt, canonicalization, XML sitemaps, structured data, HTTPS, mobile viewport behavior, and similar checks show whether the site is easy to crawl and index.
Core Web Vitals belong in that same diagnostic set. Search Console and PageSpeed Insights can validate LCP, INP, and CLS at the page level, and the report should connect those scores to the likely cause, such as render-blocking assets, JavaScript hydration timing, blocked resources, or layout instability. That keeps the report focused on fixable issues instead of surface symptoms.
The metric, the meaning, and the source should stay tied together. For a practical reference on which SEO metrics fit each layer, see Oviond's metrics guide.
How Agencies Build These Reports Today
Agencies usually build reports in four ways, and each one fits a different stage of growth. Manual exports and spreadsheets are fine when the roster is tiny. They become painful as soon as the team needs repeatability, governance, and a clean handoff between people.
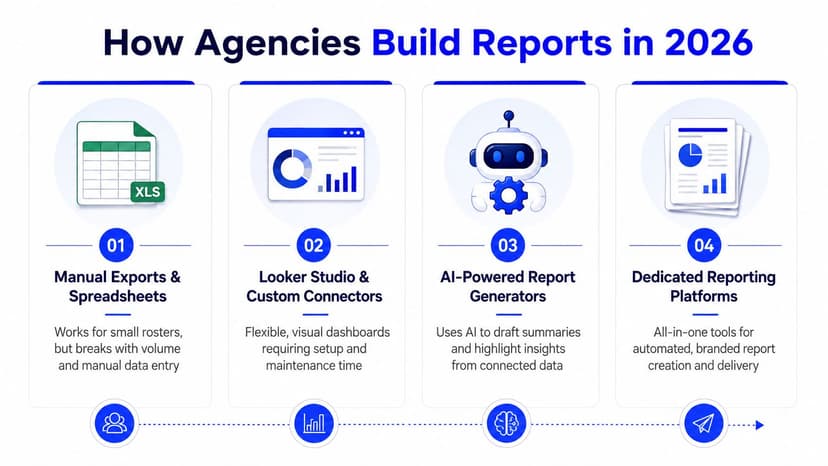
Four approaches and the trade-offs
Manual exports and spreadsheets give total control, but every client update still depends on human assembly. That makes version control messy and onboarding slow.
Looker Studio is flexible and visual, which is why a lot of teams start there. The catch is governance. Across multiple clients, the setup can turn into connector maintenance, template drift, and a lot of one-off edits.
Dedicated reporting platforms such as AgencyAnalytics, Whatagraph, and Swydo reduce the assembly work by bundling branded delivery and templates. They're built for client reporting, but pricing and packaging can add another layer to think through as the roster grows.
Unified agency platforms combine SEO, analytics, ads, email, CRM, and e-commerce data in one place, which makes them easier to standardize across accounts. That matters for agencies that want fewer moving parts and less copy-paste work every month.
If the reporting stack takes more managing than presenting, the tool choice has become part of the problem.
What to compare before you commit
The true comparison isn't just features, it's operational friction. Ask how much time the team spends maintaining connectors, how easy it is to reuse a template, and whether client branding can stay consistent across every report. A platform that looks good in a demo can still create chaos if it's hard to govern across 20 or 30 accounts.
For a workflow view that matches agency operations more closely, this agency workflow reference is the kind of thinking worth applying. The right tool should fit the way the agency already runs recurring work, not force the team to invent a new ritual every month.
Setting Up Branded Delivery at Scale
The operational win comes from doing the setup once and then letting the workflow repeat. Connect the data sources, build master templates, apply the agency brand, and schedule delivery so the system keeps moving without a monthly rebuild.
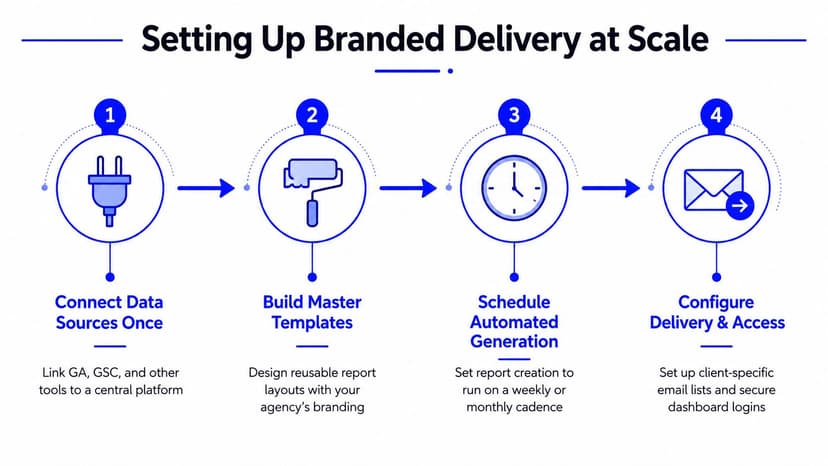
The setup sequence that saves the most friction
Start by connecting live data sources such as Google Search Console and GA4 once, then map the report fields you need. From there, build a master template for each client type, such as local SEO, lead gen, or e-commerce, so the layout doesn't need to be reinvented each cycle.
Branding comes next. Add the agency logo, colors, footer, custom domain, and sender identity so the report feels native to the agency, not borrowed from a software vendor. That small detail matters because the client experience starts with the message in their inbox, not the chart in the middle of the page.
Blend SEO with the rest of the client stack
A clean white-label report shouldn't isolate SEO from the rest of the marketing mix. Google Ads, Facebook Ads, LinkedIn Ads, Mailchimp, CRM data, and e-commerce systems can sit beside organic data in the same reporting frame. That makes it easier to show how search performance relates to leads, bookings, and transactions.
Calculated metrics and goals help here because they let the agency surface deltas and targets without reworking the report every month. They also make blended KPIs more readable for account managers who need one place to explain progress.
Practical rule: if the report can't show the business effect of organic work, the client will keep asking for a second dashboard.
For agencies that need a broader reporting stack, the setup logic in Oviond's marketing reporting overview matches the same model. Connect once, standardize the template, and let scheduled delivery handle the recurring work.
Where Oviond Fits the Agency Workflow
A client renews, the report is due, and the account team still needs to pull SEO, ads, CRM, and revenue data into something branded enough to send without embarrassment. Oviond fits that workflow as a reporting and dashboard layer for agencies that want to move away from spreadsheet maintenance and the cleanup work that comes with Looker Studio. It is built for recurring reporting across multiple clients, so the value shows up when the agency needs consistent delivery at scale, not a one-off presentation.
That operating fit matters more than feature lists. Oviond offers a single plan with all features included, pricing that scales by client count and gets cheaper as agencies add clients, unlimited reports and dashboards, full API access, custom email senders, and multiple custom domains per account with one custom domain allocation per client slot. Those details line up with the friction that usually slows agencies down, especially when reporting volume grows and every new account starts to feel like a repeat of the last setup.
The parts that map directly to agency workflow
The platform's 60+ integrations help teams pull analytics, ads, search, social, email, CRM, and e-commerce data into one place. That cuts down the need to stitch together disconnected tools for every client. The white-label layer and custom domain support keep the client-facing experience on-brand, which matters when recurring reporting has to look consistent across accounts and not like a bundle of separate vendor logins.
It also supports AI and MCP-assisted setup, which can help teams build dashboards and reports from assistants like Claude or ChatGPT. That does not replace good reporting logic, but it can reduce the setup drag that slows down template creation and initial deployment. For agencies that keep rebuilding the same monthly dashboard structure, that kind of setup help saves real time.
What it changes in day-to-day work
The bigger shift is simple. Account managers stop rebuilding the same dashboard every cycle. They can start from a reusable structure, adjust the client-specific fields, and keep the recurring delivery moving without having to recreate the whole reporting stack from scratch.
That is a cleaner fit for agencies handling 5 to 50 or more clients than a pile of disconnected reporting files. AgencyAnalytics, Whatagraph, Swydo, and Looker Studio all have their place, depending on how a team wants to balance control, flexibility, and cost structure. The deciding factor is usually how much of the setup and maintenance the agency wants to own internally. A system that keeps the brand, data, and delivery in one place makes recurring work easier to govern.
A Practical Rollout Checklist
The cleanest rollout starts with a small, controlled setup. Inventory the current client data sources, pick one report type per service line, and define the metrics that matter before anyone touches the template editor. That keeps the first build from turning into a pile of assumptions.
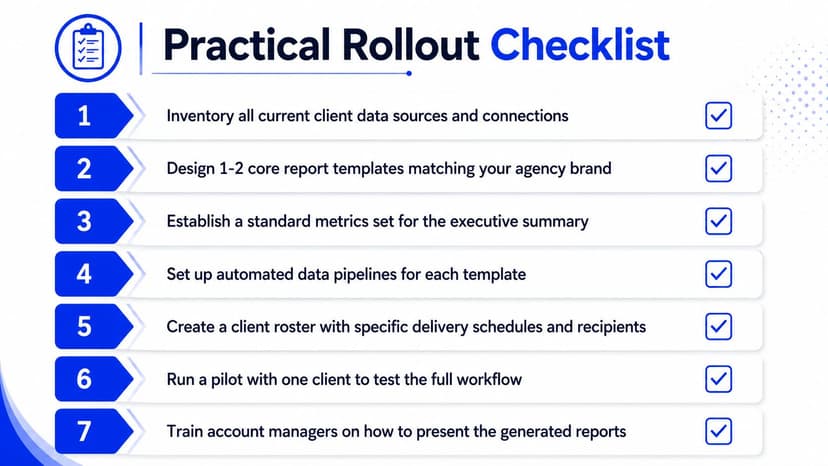
The rollout sequence
- Inventory all current client data sources and connections. Make a list of Search Console, GA4, ads, CRM, and e-commerce access before you standardize anything.
- Design one or two core report templates. Keep them aligned to the agency brand and the service types the team sells most often.
- Set a standard executive-summary metric set. Decide which numbers belong at the top so every client gets the same opening structure.
- Automate data pipelines for each template. Connect the sources once, then let the report refresh on schedule.
- Create a delivery roster. Define the cadence, recipients, and sender identity for each client.
- Run one pilot account first. Use it to catch missing fields, branding errors, and handoff issues before rolling the workflow wider.
- Train account managers on how to present the report. The delivery is only half the job, the conversation around it matters too.
A quarterly review keeps the system from getting bloated. Retire metrics clients ignore, tighten the summary, and keep the report focused on what still informs decisions. That's how the report stays useful instead of becoming a reporting museum.
White-label SEO reports only pay off when they stop being a monthly rebuild and become a branded, always-current layer of the agency experience. If your team is still stitching together reports in spreadsheets, visit Oviond and see how its agency reporting setup can replace the chaos with one repeatable workflow.
Related articles
Simplify marketing reporting today
Stop juggling multiple tools. Start presenting clear, automated reports your clients will love