
Oviond Blog
Instagram Analytics Report Template for Agencies
Build a reusable Instagram analytics report template that scales across clients. Covers KPIs, layout, automation, and white-label delivery with Oviond.

Month-end lands, and your team opens the same stack of Instagram exports, screenshots, spreadsheets, and presentation slides. Someone checks whether follower growth is up, someone else rebuilds the engagement chart, and an account manager rewrites nearly identical commentary for client after client. The report eventually goes out, but the process becomes harder to control every time your roster grows.
A reusable Instagram analytics report template should remove that repetition without flattening every client into the same story. It needs consistent formulas, format-level analysis, clear recommendations, and delivery that carries your agency's branding. For agencies managing 5 to 50+ clients, the practical objective is simple: build the reporting system once, then adjust goals and commentary without rebuilding the report from scratch.
Table of Contents
- Why Most Instagram Reports Fail to Scale
- The Five Metric Categories Every Template Needs
- Designing a Client-Ready Report Layout
- Building the Template in Oviond
- How Oviond Compares to Other Reporting Tools
- Automating Delivery and White-Label Branding
Why Most Instagram Reports Fail to Scale
A manual report often starts innocently. An account manager downloads Instagram data, pastes headline figures into a spreadsheet, copies the previous month's deck, and changes the colors for a new client. After several accounts, small differences appear. One report uses engagement divided by followers. Another uses engagement divided by reach. A third shows total interactions without stating the denominator at all.
That inconsistency makes client conversations harder. A client may appear to be underperforming because the formula changed, while a strong Reel can disappear inside an account-level average. Instagram reporting has expanded from simple summaries of impressions, followers, likes, and interactions into broader reviews that include reach, demographics, saves, shares, Reels metrics, website clicks, and calculated rates, as documented in Instagram analytics report template guidance.
The three structural problems
- Unclear definitions: Teams compare figures that were calculated differently. The dashboard may look polished, but the underlying KPI rules aren't stable.
- No format breakdown: A total engagement figure doesn't tell an account manager whether Reels, Carousels, Static posts, or Stories created the response.
- Manual delivery: Staff rebuild charts, export PDFs, check attachments, and resend files. That work creates more opportunities for missing data and delayed reporting. The difference between manual and automated workflows is outlined in this comparison of manual and automated digital marketing reporting.
Practical rule: If a metric can't be defined once and reused for every client, it doesn't belong in the master template yet.
A scalable report has a fixed measurement stack, reusable queries, client-level goal settings, and a layout that survives different account sizes. The account manager should only need to review anomalies, add context, and approve the final narrative. That architecture is what lets one agency support more accounts without turning every reporting cycle into a custom production project.
The Five Metric Categories Every Template Needs
A reusable report should make each category answer a client question: Are we growing? Which content earns attention? Is that attention meaningful? Do people stay with the content? Does Instagram lead to a downstream action? A long list of disconnected figures cannot answer those questions consistently across five or fifty accounts.
Instagram reporting guidance recommends separating audience, engagement, content, reach, and conversion measures, while also pairing totals with normalized rates and period-over-period changes. Reporting Ninja's Instagram analytics guidance supports that structure. Oviond's guide to Instagram performance metrics is useful when deciding which measures belong in the reusable stack.
| Category | Key Metrics | Standardized Formula |
|---|---|---|
| Audience growth | Followers, new followers, unfollows, follower growth rate, demographics, active hours | Follower growth rate = net follower change ÷ followers at the start of the period × 100 |
| Content performance | Reach, impressions, engagements, top posts, performance by Reels, Carousels, Static posts, and Stories | Average format reach = total format reach ÷ number of published assets in that format |
| Engagement depth | Likes, comments, saves, shares, engagement rate | Engagement rate by reach = total engagements ÷ reach × 100 |
| Story and Reels quality | Story completion, exits, average watch time, retention, Reels views | Story completion rate = viewers of the final frame ÷ viewers of the first frame × 100 |
| Conversion and links | Profile visits, website clicks, action-button taps, DMs, sign-ups, leads or sales proxies | Click-through rate = clicks ÷ impressions × 100 |
Standardize the denominator
Decide whether engagement rate uses reach or followers before building the master dashboard. Both formulas are valid, but they answer different questions. Reach-based engagement shows how the people who saw the content interacted. Follower-based engagement shows interaction against the account's audience base.
Benchmark comparisons also become unreliable when agencies leave the denominator unstated. Nano-influencers typically achieve about 4.2% to 5.0% engagement, while mega-influencers are closer to 0.8% to 1.0%. Porter Metrics' Instagram Insights template guidance recommends showing absolute and normalized metrics while separating distribution, engagement depth, retention, and outcomes.
Set the formula once in the master template and reuse it for every client. Put the denominator in the label, such as Engagement rate by reach. Keep totals beside rates. A high rate on limited reach and a lower rate on broad reach can lead to different strategic decisions, so neither figure should stand alone.
Don't let likes carry the report
Likes are easy for clients to scan, but saves, shares, comments, retention, and clicks often give the account manager clearer direction. A post with many likes and few saves may earn approval without creating a reason to return. A post with fewer likes and stronger shares may contribute more to discovery.
Break results down by Reels, Carousels, Static posts, and Stories. Include non-follower reach, shares per 1,000 reach, and changes over time when the data connection supports them. This format-level view prevents one viral asset from distorting the period and gives the team a repeatable basis for recommendations.
Designing a Client-Ready Report Layout
Clients scan reports. They rarely read every chart, tooltip, or footnote, so the first page needs to answer three questions quickly: what changed, why it changed, and what the agency recommends next.
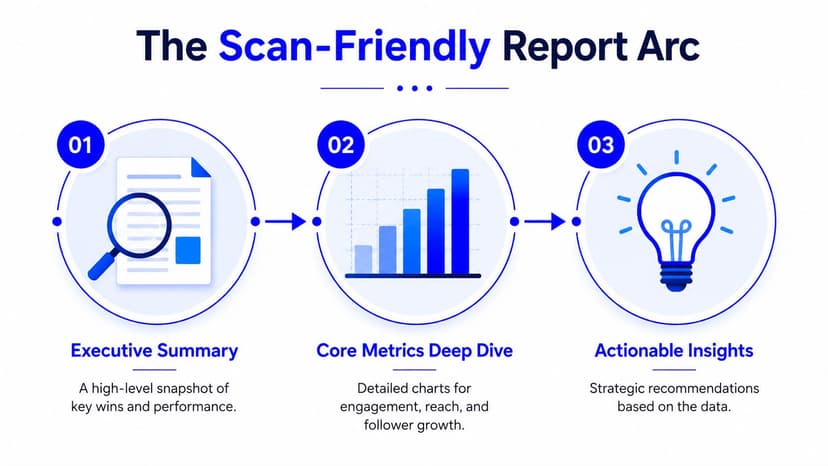
Start with an executive summary. Use three to five headline KPIs, each with a clearly labeled period comparison, followed by a two-sentence interpretation. Don't fill the page with every available figure. The account manager's commentary should explain the movement, identify the content or campaign behind it, and state whether the team will repeat, adjust, or stop that approach.
Build the narrative in a deliberate order
- Executive summary: Place scorecards for reach, engagement rate, follower growth, and a relevant conversion measure. Add the strategic takeaway directly below them.
- Audience growth: Use a line chart for follower movement over the last six months, with campaign milestones or major content changes annotated in the commentary.
- Content performance: Rank top posts with a horizontal bar chart using engagement rate or reach, depending on the client objective. Add the format beside each asset.
- Format comparison: Use a compact table to compare average Reels, Carousel, Static, and Story performance. Include the number of assets published so a small sample doesn't look equivalent to a sustained pattern.
- Engagement depth: Use a stacked bar chart for likes, comments, saves, and shares. The composition gives the client more context than a single total.
- Retention and conversion: Close the performance pages with Story completion, exits, average watch time, profile visits, website clicks, and other agreed outcome proxies.
- Recommendations: End with three concrete next steps. Each should name the format, audience, hook, distribution approach, or conversion path the team will test.
Keep commentary close to the evidence
Put a short note beside the chart it explains. If the audience page shows follower growth after a campaign, annotate the relevant period rather than forcing the client to search another page. If Reels produced discovery but Stories produced clicks, state that distinction plainly.
A report shouldn't hide weak results behind design. Conditional colors can direct attention, but they shouldn't replace explanation. The final page should make ownership clear, with one action for creative, one for distribution, and one for conversion tracking.
Building the Template in Oviond
The master build should start with the data connection, not the visual design. In Oviond, connect each client's Instagram Business account inside the agency workspace, then verify that the account returns the fields your template needs. Check reach, impressions, follower movement, engagement by post type, Story completion, and any conversion fields before you lock the layout.
Create reusable data rules
Build a master query set for the core account and content views. Save the queries as reusable assets, then clone them for new client profiles instead of recreating each chart manually. Keep naming consistent, for example:
- Account overview: Reach, impressions, followers, profile visits, and website clicks.
- Content performance: Post-level reach, engagements, format, publication date, and top-content ranking.
- Format analysis: Reels, Carousels, Static posts, and Stories with their relevant averages and totals.
- Retention view: Story completion, exits, average watch time, and other available retention signals.
- Outcome view: Link clicks, action-button taps, DMs, sign-ups, or another agreed proxy.
Use calculated metrics to enforce your agency's definitions. Engagement rate by reach should use total engagements divided by reach. If paid Instagram activity is part of the account, create a separate cost-per-engagement calculation and label it clearly so paid and organic measures don't merge into one misleading figure.
Keep the formula visible. A client may not need the arithmetic on every page, but your team needs a shared definition when it reviews accounts and writes commentary.
Assemble and deploy the master layout
Create a widget library with a top-line scorecard row, a time-series chart for reach and engagement, a format comparison table, and a top-performing content grid. Add goal thresholds for each client, since a lead-generation account and an awareness account shouldn't be judged against identical targets. Conditional formatting can flag a metric for review, but the account manager should still inspect the underlying content before writing a conclusion.

Lock the layout only after testing it against accounts with different audience sizes and content mixes. Then use the duplicate-and-reassign workflow to apply the master to new client profiles, overriding goals, logos, date ranges, and commentary fields as needed. Oviond's Instagram reporting template is a starting point for agencies that want connected Instagram data, reusable reporting components, and branded client delivery in the same workflow.
The trade-off is deliberate standardization. A master template won't capture every unusual campaign without customization, but it gives the team a dependable baseline and keeps special reporting requests contained rather than allowing every client deck to become a separate system.
How Oviond Compares to Other Reporting Tools
Agencies usually evaluate reporting software against five practical criteria: Instagram data depth, multi-client handling, white-label presentation, automation flexibility, and cost structure as the roster expands. No tool removes the need to define KPIs and interpret results, so the right choice depends on how much control the agency needs versus how quickly the team wants to assemble a dashboard.
| Feature | Oviond | AgencyAnalytics | Whatagraph | Swydo | Looker Studio |
|---|---|---|---|---|---|
| Instagram reporting | Format-level reporting with reusable queries and calculated metrics | Multi-client reporting with Instagram support | Multi-channel reporting with customizable dashboards | Agency reporting with dashboard and report building | Flexible reporting through connectors |
| Multi-client workflow | Client-based workspace and reusable master templates | Built for multi-client workspaces | Supports recurring client reporting | Designed for agency reporting | Possible, but often requires more manual administration |
| White-label options | White-label delivery and custom domain support | Full white-labeling from its Agency plan, including custom domains and branded email sends, listed at $239 per month in an independent 2026 comparison (Databox comparison) | White-label reporting options | White-label reporting options | Design control is broad, but native branded delivery may require additional setup |
| Calculated metrics and goals | Custom calculations and client-level goals | Custom metrics available depending on setup | Custom calculations and reporting controls | Custom metrics and reporting options | Formula flexibility depends on the connector and report design |
| Delivery model | Scheduled reports, live dashboards, branded links, and client access | Scheduled client reports and dashboards | Automated reporting and dashboard delivery | Automated report delivery | Sharing and scheduled delivery through Google's ecosystem |
| Main trade-off | More setup discipline than a simple drag-and-drop tool | Agency-oriented feature depth may come with higher plan requirements | Strong cross-channel presentation, with setup decisions around data sources | Simpler reporting workflows may offer less customization for complex templates | High design freedom, but connector maintenance and administration remain with the agency |
Oviond positions itself as an agency-native alternative to spreadsheet-heavy workflows and complicated Looker Studio maintenance. Its model includes one plan with all features, pricing by client count, unlimited reports, dashboards, and users, white-label delivery, custom domains, 60+ integrations, and AI or MCP-assisted setup. Those details matter when the agency wants one reporting process across Instagram, paid media, search, analytics, email, CRM, and e-commerce rather than a separate tool for every channel.
The practical choice is straightforward. Choose a lighter tool when the team values rapid setup over deep customization. Choose Looker Studio when maximum design freedom outweighs connector upkeep. Choose an agency platform when repeatable templates, client access, branded delivery, and calculated metrics need to work together.
Automating Delivery and White-Label Branding
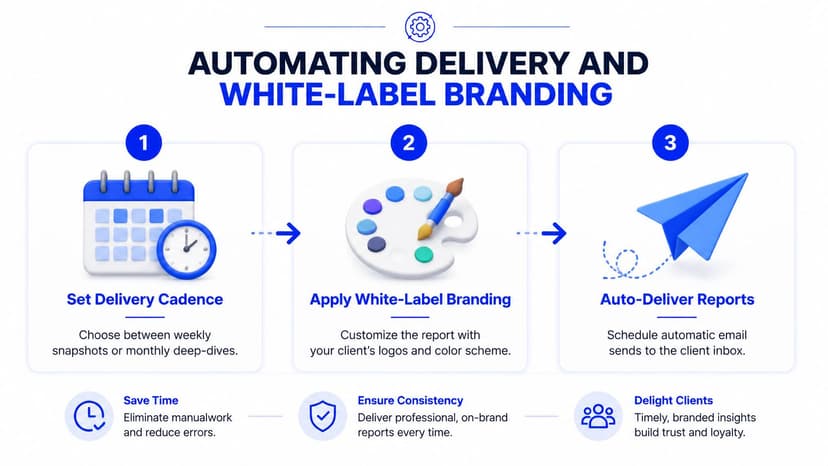
A finished dashboard still creates work if someone has to export it, rename the file, check the recipient list, and send it manually every cycle. Configure delivery rules at the client level instead. High-touch accounts may receive weekly snapshots, while retainer clients may prefer a monthly deep dive that includes recommendations and content analysis.
Set the delivery experience
Use live dashboards for stakeholders who want to filter and explore the data. Use PDFs when the client wants a curated document that can be circulated internally. Schedule the report after the data refresh window, then set the recipient list, sender name, reply-to address, subject line, and accompanying commentary.
Apply your agency's white-label layer globally. A custom domain makes live report links feel like part of your client portal rather than a third-party handoff. Add your logo, colors, and cover-page treatment, then place the client's logo beside your agency branding where the relationship calls for co-branded presentation. Oviond's white-label reporting guidance covers the broader setup for branded reports and dashboards.
Add safeguards before switching it on
Automation should reduce routine handling, not remove review completely. Set a notification when a key KPI crosses a client-defined threshold, then route that alert to the responsible account manager. A week-over-week engagement decline of more than 20% can be used as an alert condition when that threshold fits the client's reporting policy, but it should not be treated as a universal performance judgment.
Give clients portal access to current and historical reports so the team doesn't need to resend old files. Keep a delivery checklist for failed connections, unusual spikes, missing conversion data, and campaigns that require written context. Oviond says agencies can manage one client or a hundred from a single workspace, with branded dashboards and scheduled recurring delivery, which reflects the operational model agencies need as their client count grows (Oviond for marketing agencies).
Oviond brings Instagram data connections, calculated metrics, reusable dashboards, white-label branding, custom domains, and automated client delivery into one agency reporting workflow. Visit Oviond to build a reusable Instagram analytics report template that your team can deploy across clients without returning to spreadsheets every month.
Related articles
Simplify marketing reporting today
Stop juggling multiple tools. Start presenting clear, automated reports your clients will love