
Oviond Blog
Marketing Reporting Tool: 2026 Agency Guide to Choosing
Find the best marketing reporting tool for your agency. Learn core features, tips, and how to automate client reporting at scale.

The first week of the month hits, and the same scramble starts again. Someone on the team is pulling Google Ads numbers, someone else is checking Meta, GA4 doesn't match the CRM, and the spreadsheet that was “good enough last month” is already drifting out of date. For agencies managing a dozen clients, that routine doesn't just waste time, it creates the kind of reporting drift that makes account managers nervous and clients skeptical.
A marketing reporting tool exists to stop that cycle. In plain terms, it collects performance data from multiple channels, organizes it, visualizes it, and shares it in a way clients and internal teams can use, which matches the basic reporting workflow described by Ruler Analytics. The category grew because agency reporting stopped being a spreadsheet problem and became an operations problem, with campaigns spanning search, paid social, email, SEO, analytics, and CRM systems that need to be stitched into one view. Trendy's practical guide to agency reporting workflow pairs well with that reality, especially if your team is also juggling social reporting alongside broader client updates, as outlined in Trendy's guide to social media management.
Table of Contents
- Why Agencies Need a Dedicated Marketing Reporting Tool
- Core Features That Define a Modern Reporting Platform
- Benefits That Move the Needle for Agencies
- Comparing Popular Marketing Reporting Tools for Agencies
- How to Evaluate and Migrate to a New Reporting Platform
- Scaling Reporting as Your Agency Grows
- Next Steps to Simplify Your Agency Reporting
Why Agencies Need a Dedicated Marketing Reporting Tool
The pain usually shows up on the calendar first. It's the first week of the month, five clients want updates, and your team is trapped inside a familiar loop, copying figures from ad platforms, analytics, and CRM exports into one spreadsheet that nobody fully trusts. A Looker Studio template might hold together for a while, but once the client list grows, every extra data source adds another place for the report to break, drift, or need manual patching.

A dedicated marketing reporting tool is built to solve that problem. It pulls data from multiple channels, centralizes it, and presents it in dashboards or scheduled reports, which is the core definition used in Ruler Analytics' marketing reporting tools guide. By 2026, tools in this category were commonly described as systems that collect, consolidate, and visualize data from ad platforms, analytics tools, and CRMs, so teams can replace fragmented views with unified dashboards and reports, a shift documented in Improvado's 2026 overview.
Why spreadsheets stop scaling
Spreadsheets are fine when the work is small and the reporting asks are simple. They get shaky when every client has a different channel mix, a different KPI set, and a different cadence for updates. The problem isn't only the manual copy-paste work, it's the fact that a spreadsheet doesn't enforce source consistency, metric definitions, or update discipline.
That's where agency ops gets burned. The team spends time reconciling numbers instead of explaining them, and the report becomes a file transfer exercise instead of a management tool. Guidance from Funnel's digital marketing reporting guide reinforces a simple rule that too many teams skip, reports need consistent units, time periods, and definitions if they're meant to be compared across campaigns or clients.
Why the category exists for agencies
Agency reporting is different from in-house reporting because it has to work across clients, not just across channels. That means the platform has to support repeated setup, reusable structure, and clean delivery without making every account feel like a one-off project. Industry guidance now treats a strong report as a mix of output metrics, outcome metrics, quality metrics, and progress toward goals, which reflects the shift from “show me the numbers” to “help me run the account” on Databox's marketing reporting guidance.
The practical lesson is straightforward. If the report can't be automated, branded, and repeated without rebuilding the same logic every month, it's not really helping the agency scale. It's just putting a nicer wrapper on the same old bottleneck.
Core Features That Define a Modern Reporting Platform
A reporting platform looks simple until an agency tries to run five, ten, or fifty client accounts through it. The hidden work shows up fast, per-seat fees, template rebuilds, data normalization gaps, and the handoff pain of moving accounts off spreadsheets and Looker Studio. A tool earns its keep when it reduces that operational drag instead of adding another layer of setup.
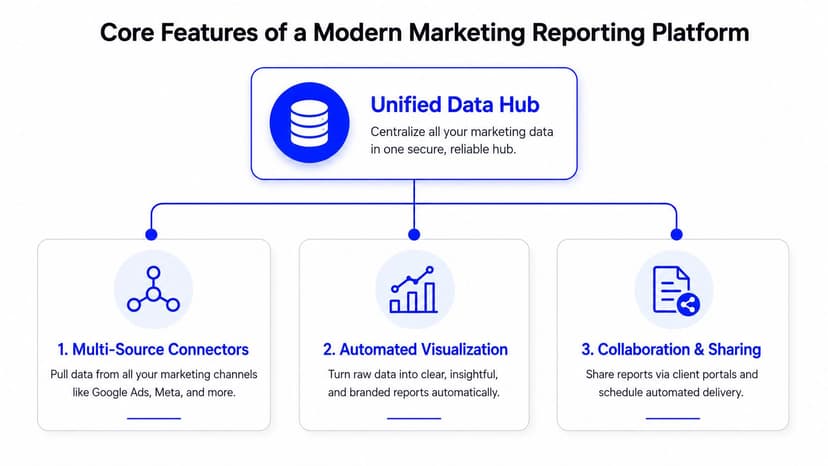
A serious platform starts with connectors, because agencies do not have a reporting problem until they have multiple source systems that disagree with each other. The market has moved far beyond “can it connect to Google Ads?” Category summaries point to broad integration coverage, from Improvado's marketing reporting software overview and its discussion of data hubs, connectors, and automation, to DashThis and Vectoron's discussion of marketing reporting tools. That range matters because agencies need a tool that can pull from ads, analytics, email, CRM, and sometimes custom sources without turning setup into a monthlong project.
Data connection is only the starting point
Connector breadth matters, but refresh automation matters just as much. The issue is not whether a platform can import data once, it is whether it can keep that data current without an analyst babysitting exports. That is the difference between a report that reflects what happened and one that is already stale by the time the client opens it.
A platform also has to handle the mess that comes after the connection is live. Campaign names differ by channel, conversions do not always line up across systems, and client teams often define the same KPI in different ways. If the reporting layer cannot normalize those inputs cleanly, the agency ends up fixing the same mismatch every cycle. For teams building recurring client reporting, Oviond's automated marketing reports are one example of how automation is positioned around repeatable delivery rather than one-off dashboard building.
Practical rule: if a vendor leads with charts but stays vague on connector reliability, the reporting layer will eventually become a maintenance queue.
What turns raw data into client-ready reporting
A dashboard builder is not enough if the data still needs manual cleanup every month. Agencies need calculated metrics, reusable templates, goal tracking, and custom-source ingestion so the same framework can adapt to different client KPIs without being rebuilt from scratch. That matters when client reporting has to show traffic, leads, revenue, clicks, conversions, and ROI in one place, because those numbers often come from systems that define things differently.
The feature set that changes agency operations tends to look like this, not just “more charts”:
- Multi-source connectors, so the team can pull from Google Ads, Meta, LinkedIn, GA4, email, CRM, and e-commerce without exporting files by hand.
- Reusable templates, so every account does not become a redesign project.
- Calculated metrics and goals, so the report reflects client-specific targets rather than generic channel totals.
- Automated delivery and branded sharing, so the report reaches the client on schedule and under the agency's brand.
The common trap is to buy a tool that looks flexible but still requires a lot of manual configuration every month. Agencies do not need a prettier spreadsheet. They need a reporting layer that can keep up when account volume rises and the team cannot afford brittle one-off builds anymore.
Benefits That Move the Needle for Agencies
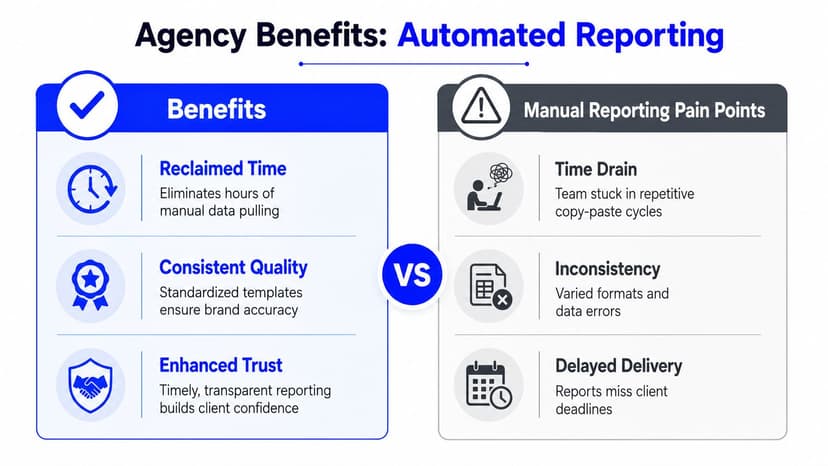
The value is not in the dashboard itself, it is in the work that stops landing on the team's week. Automated delivery means nobody has to chase the monthly report deadline, white-label presentation helps the agency look polished in front of the client, and live dashboards cut down on the constant “can you send the latest numbers again?” messages. Those are operational wins, and they matter more than a flashy interface.
Automation changes the rhythm of client work
A good agency reporting setup does more than send reports faster, it changes when the team has to think about them. Once recurring delivery is in place, account managers can spend less time formatting updates and more time reviewing what changed, why it changed, and what to do next. The report becomes a working tool instead of a monthly chore.
That shift is the operational gain. It reduces the hidden cost of redoing the same cleanup work every cycle, and it gives the team room to focus on the client conversation instead of the export process.
White label delivery protects the relationship
Clients notice presentation. A branded dashboard with a custom domain and consistent sender identity feels like part of the agency's service, while a plain tool link or exported PDF feels like a stopgap. That difference shows up in trust, especially when clients are comparing channels side by side and asking for the story behind traffic, conversion rates, cost per acquisition, and return on ad spend.
A few benefits are easy to miss until the agency starts scaling reporting across more accounts:
- Unlimited reports and dashboards mean the team does not have to ration setup by client or by use case.
- Unlimited users remove the per-seat friction that shows up when every new account manager or strategist needs access.
- Always-current dashboards reduce version chasing, which matters when clients want to self-serve between formal update meetings.
- A setup built around automated marketing reports cuts the repetitive rebuild work that usually shows up when templates have to be recreated for each client.
A client does not ask for “more reporting.” They ask for fewer surprises, clearer numbers, and a cleaner handoff between the report and the conversation that follows.
The hidden win is consistency. When every client sees a similar reporting experience, the team spends less time explaining format differences and more time interpreting the data. That helps reduce burnout, and it gives the agency a more reliable operating cadence.
Comparing Popular Marketing Reporting Tools for Agencies
The names people run into first are usually AgencyAnalytics, Whatagraph, Swydo, and Looker Studio. Each one can fit a different stage of agency life, but the right choice depends on connector needs, branding depth, pricing structure, and how much maintenance the team can carry. For a useful cross-check, the broader market review at Oviond's comparison of digital marketing reporting platforms is worth reading alongside the vendor pages themselves.
How the options differ in practice
Looker Studio gives agencies a lot of flexibility, and it's hard to beat on cost. The trade-off is fragility, especially once the dashboard starts blending several sources and the team has to maintain the logic by hand. AgencyAnalytics is more agency-native, with reporting plus SEO and client communication features in one place, while Whatagraph focuses on white-labeled client dashboards and fast setup. Swydo tends to sit in the same conversation for teams that want agency reporting with structured delivery, while Oviond is positioned as a simpler, white-label option with all features in one plan, pricing by client count, unlimited reports and dashboards, custom domains, and 60+ integrations.
Agency reporting tool comparison
| Tool | White-Label Depth | Pricing Model | User Limits | Best Fit |
|---|---|---|---|---|
| Looker Studio | Basic, depends on setup | Free, with connector costs often added | Typically flexible, but maintenance is on the team | Agencies that want flexibility and already have technical bandwidth |
| AgencyAnalytics | Strong white-labeling and client portals | Per-campaign pricing | Usually tied to campaign structure | Agencies that want an all-in-one agency reporting stack |
| Whatagraph | Strong branded reporting and scheduled delivery | Tiered subscription | Can scale with source and user needs | Small to mid-sized agencies that want quick client onboarding |
| Swydo | Agency-focused white-label reporting | Tiered subscription | Product and plan dependent | Agencies that want structured reporting workflows |
| Oviond | White-label delivery with custom domains | Pricing by client count | Unlimited reports, dashboards, and users | Agencies that want simpler multi-client reporting in one plan |
The important comparison isn't which platform has the longest feature page. It's which one keeps the reporting process stable as client count rises. A tool that looks inexpensive can become expensive once per-user fees, connector charges, or rebuild work show up. A tool that feels rigid at first may still be the right choice if it removes recurring operational drag.
How to Evaluate and Migrate to a New Reporting Platform
Choosing a new platform is the easy part. The work begins when the team has to trust the numbers, keep the templates intact, and avoid breaking client delivery during the switch. A useful evaluation needs to cover data trust, normalization, connector reliability, support quality, and the operational load of moving 5 to 50 or more client accounts without forcing the team to rebuild everything by hand.
Start with the report, not the software
Begin with the report's job. The clearest planning advice is to define the decision the report must support first, then choose the audience, data, and action items around that decision, which aligns with YouTube guidance on report planning. If the report does not answer a real operational question, the platform choice will not fix it.
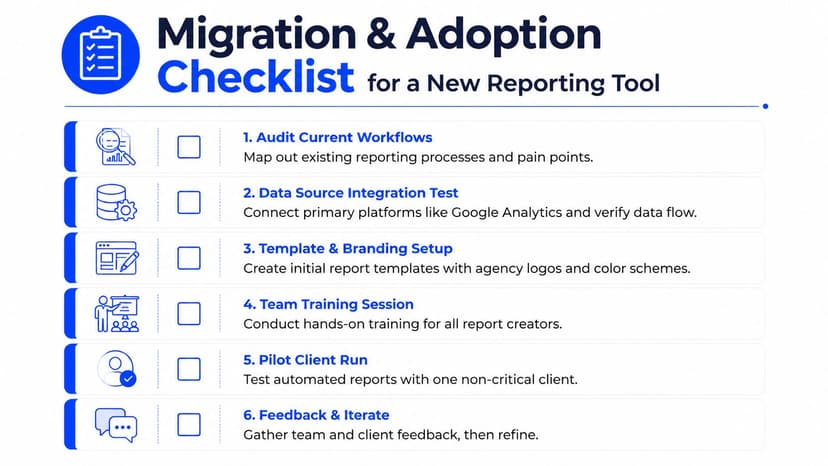
A practical migration checklist looks like this:
- Audit current workflows. List every report, who builds it, who reads it, and what breaks most often.
- Test the data sources. Reconnect the highest-priority platforms first, then verify that the data flow matches what the team expects.
- Map client KPIs. Do not copy every chart, only the metrics that support decisions.
- Set templates and branding. Lock in the structure before rolling across accounts.
- Pilot with a few clients. Use low-risk accounts before switching the whole book.
- Review discrepancies early. Compare totals across systems and sort out definitions before client-facing delivery starts.
The hidden cost shows up in the rebuild. Agencies that migrate from spreadsheets or Looker Studio often discover that per-seat fees, connector charges, and template recreation do more damage to margins than the software demo suggested. A useful reference point is migrating from Excel to Oviond, because the hard part is not importing data, it is preserving the reporting rhythm the team already depends on.
Don't ignore normalization and trust
One gap in a lot of tool comparisons is data normalization. Agencies are often told to choose based on connectors and templates, but the harder problem is making sure different platforms do not produce misleading rollups. Industry guidance points out that agencies should deduplicate exposure before trusting blended metrics and normalize data before reporting. That matters because the same number in three tools can still come from three different measurement rules, even when the dashboards look aligned.
Migration rule: the first goal is not to make the new dashboard look polished, it is to make sure the team believes the data enough to use it.
Support also changes the outcome. If the vendor offers hands-on setup, template help, and migration assistance from the start, the team is far more likely to finish the move without stalling halfway through. Without that help, agencies usually end up running parallel systems longer than planned, rebuilding reports twice, and spending more time on cleanup than on actual analysis.
Scaling Reporting as Your Agency Grows
Scaling reporting isn't about adding more dashboards. It's about adding clients without adding the same reporting pain each time. That means the combination of automation, branding, and pricing has to work as one system, or the agency just replaces spreadsheet pain with subscription sprawl.
The scaling problem is usually commercial, not technical
A lot of tools can build dashboards. Fewer can do it in a way that protects margins as the account list expands. Per-seat fees are especially awkward for agencies, because the reporting workload doesn't always match the number of users who need access. Pricing by client count tends to fit agency economics better, especially when the plan includes unlimited reports, dashboards, and users instead of charging every time the team grows.
What scales cleanly
The cleanest reporting setups usually share a few traits:
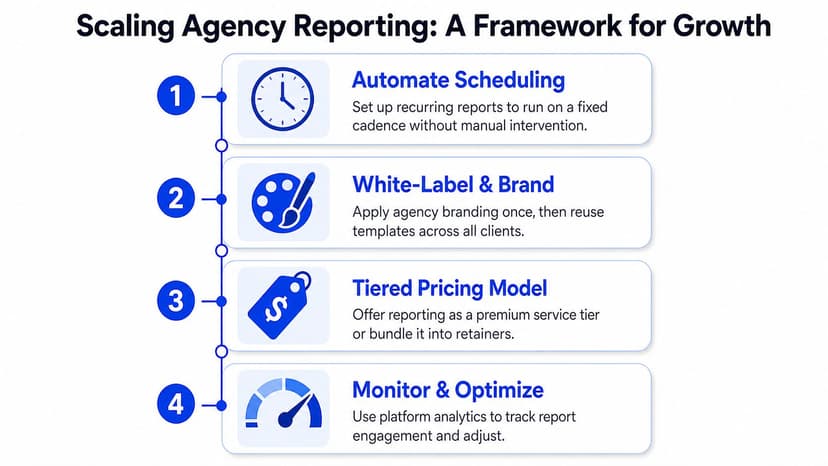
- Scheduled delivery, so reports go out on a fixed cadence without manual intervention.
- Reusable templates, so new clients don't force a rebuild from scratch.
- Custom data imports, so odd sources don't become a permanent exception.
- White-label branding, so the delivery experience stays consistent as the agency grows.
Those features matter because agencies don't just need more output, they need repeatable output. If the platform also supports custom domains, custom email senders, and full API access, it can keep pace with more advanced client setups without pushing the team back into manual work. On the strategy side, a unified reporting process that covers analytics, ads, search, social, email, CRM, and e-commerce makes it easier to keep client stories consistent instead of piecing them together account by account, a workflow direction reflected in Oviond's platform overview.
The scaling test is simple. If adding the next five clients requires rebuilding the workflow, the platform isn't really helping growth. If the next five clients mostly reuse the same structure, branding, and delivery logic, the agency has a reporting system it can live with.
Next Steps to Simplify Your Agency Reporting
A marketing reporting tool should cut manual work, improve client trust, and scale with the agency without adding hidden complexity. If it creates more login juggling, per-seat fees, or template rebuilds, it's just moving the bottleneck around.
This week, do four things. Audit how long reporting takes across your team. List the top five client KPIs that matter most. Identify the most fragile reports, the ones that break when a source changes or a client asks for a different view. Then pilot a new platform with one or two clients before touching the full book.
If you want a simpler agency-native setup, Oviond offers white-label client reporting, custom domains, unlimited reports and dashboards, and pricing by client count starting from $39/month billed annually for up to five clients. It's built to replace spreadsheet chaos with a cleaner reporting process, and you can review it at Oviond when you're ready to compare it against your current workflow.
If your agency is stuck rebuilding the same reports every month, it's time to switch to a system that fits client work. Visit Oviond to see how white-label reporting, automated delivery, and client-based pricing can simplify the way your team handles reporting.
Related articles
Simplify marketing reporting today
Stop juggling multiple tools. Start presenting clear, automated reports your clients will love