
Oviond Blog
Return on Ad Spend: The Agency Guide to ROAS Reporting
Master return on ad spend reporting for agency clients. Learn ROAS formulas, benchmarks, attribution pitfalls, and how to build automated dashboards.

Monday's client email lands before the coffee does. “What's our ROAS this month?” The account manager opens three tabs, checks platform numbers, spots a mismatch with GA4, and now has to explain why the paid social dashboard looks stronger than the backend revenue system.
That's the day-to-day reality of return on ad spend in agency reporting. It's a simple metric on paper, revenue tied to ad spend, but it gets messy fast once campaigns span search, social, email, retargeting, and different attribution rules. For account teams, the job isn't just to calculate ROAS, it's to define it clearly, segment it properly, and present it in a way clients can trust.
Table of Contents
- Why ROAS Is the Metric Clients Always Ask About
- The ROAS Formula and How to Present It
- ROAS Benchmarks by Channel and Industry
- When ROAS Lies About Profitability
- Attribution Disagreements and Platform ROAS Problems
- Building ROAS Dashboards That Clients Actually Use
- Scaling ROAS Reporting Across Your Client Base
Why ROAS Is the Metric Clients Always Ask About
The first reason clients ask for ROAS is blunt: it feels like the cleanest answer to “is this working?” A single number that ties spend to revenue is easier to digest than a wall of clicks, impressions, and assisted conversions. That's why ROAS has become one of the earliest historical metrics agencies used to compare channels, ad groups, and campaigns, because it speaks the language of efficiency instead of vanity.
A solid client-facing explanation helps here. If a new account manager needs a quick refresher, the what is ROAS guide from Click Click Bang Bang is a straightforward place to start. The important part for agency reporting is not the definition alone, but the consistency around it, because one team's “ROAS” can become another team's “revenue after platform fees” if nobody writes it down.
Why the simple number causes trouble
ROAS looks simple because it is simple in structure, revenue divided by ad spend. The trap is that the number doesn't explain what was included, what was excluded, or which part of the funnel drove it. That's where agencies get into trouble with blended reporting, especially when one dashboard combines prospecting, retargeting, and multiple markets.
Practical rule: if two people can look at the same report and reasonably disagree about what the number means, the metric is not defined well enough for client delivery.
The other reason clients keep asking for ROAS is benchmark pressure. Brandwatch notes that 4:1 is widely treated as a strong benchmark, while its cited Nielsen 2022 ROI Report puts the median ROAS across industries at about 2.63:1 (Brandwatch). That gap matters in client conversations. A campaign can look healthy relative to the median and still fall short of a strong profitability target.
For agency teams, that means the question is never just “what's our ROAS?” The better question is “which ROAS, from which source, for which campaign type, and measured against which business goal?” That framing saves account managers from promising certainty where the data only supports directional confidence.
The ROAS Formula and How to Present It
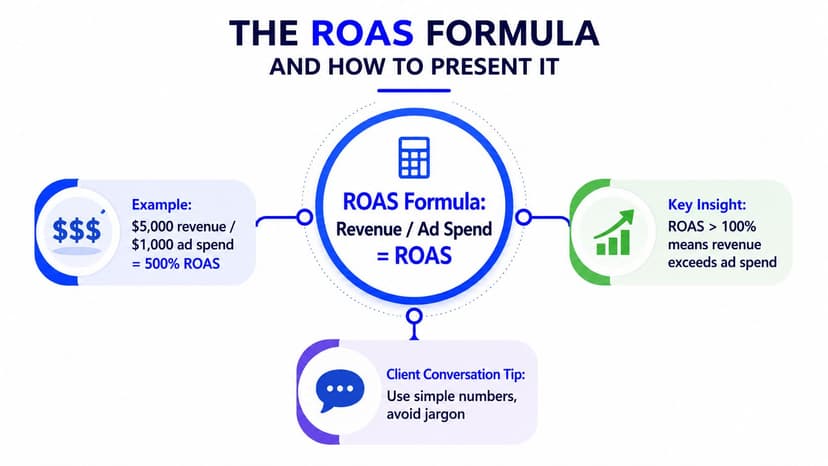
The core formula is straightforward, ROAS = revenue generated from advertising divided by ad spend. Amazon Advertising gives the cleanest working example, a campaign earning $10,000 on $2,000 of spend has a ROAS of 5:1, or 500% (Amazon Advertising). That's the version most clients understand fastest, because it turns media efficiency into a plain-language ratio.
The reporting mistake agencies make is mixing formats. One dashboard says 3, another says 300%, and a third says 3:1. GrowthLoop's explanation is useful here, because it shows the same result can be written as a ratio or as a percentage, but the format has to stay consistent inside a single report (GrowthLoop). If the client sees both styles in one deck, they'll assume the team changed the math.
How to define what counts
The safest reporting rule is to define revenue as the amount directly attributable to the ad campaign, and spend as the total advertising cost for that campaign. ClicksGeek specifically warns not to confuse ad revenue with overall business revenue, and notes that some practitioners also include related costs such as bid management tools and landing page services when they want a fuller picture (ClicksGeek). That detail matters because platform defaults rarely match how agencies budget.
For client reports, I'd keep the definition visible on the dashboard itself. Not buried in a footnote, visible. If the number is from paid search only, say that. If it excludes agency fees, say that too. Clients don't need a finance lecture, they need to know why the number moved and what was included.
The simplest way to present it is to anchor every ROAS view to a single formula statement, then show supporting context underneath. In a multi-touch funnel, that might mean one card for channel-level ROAS, one for blended ROAS, and one note that explains which source is the reporting basis. Oviond's digital marketing performance report guidance is relevant here because the presentation layer matters as much as the math.
ROAS Benchmarks by Channel and Industry
A blended ROAS target usually starts the wrong conversation. Account managers need channel-level context first, because paid search, paid social, email, and organic do different jobs and are judged on different time horizons. First Page Sage's benchmark data shows that PPC/SEM ROAS sits at 1.55, LinkedIn Ads at 2.30, Facebook Ads at 1.80, email marketing at 3.50, influencer marketing at 3.45, and SEO at 9.10 (First Page Sage). Those figures are not a universal pass-fail line, they show why one blended number can hide the full context.
Channel context matters more than the blended number
A client who sees one blended ROAS across paid social, search, and email will usually react to the wrong lever. Search may be doing steady lower-funnel work, while SEO carries long-tail revenue and email is harvesting repeat demand. A single number flattens that mix, and it also hides which channel needs more budget, more testing, or more time.
| ROAS Benchmarks by Marketing Channel | Average ROAS | Performance Context |
|---|---|---|
| PPC/SEM | 1.55 | Often used for demand capture and testing, not always for top-line efficiency |
| LinkedIn Ads | 2.30 | Usually judged in higher-value lead environments, not quick revenue loops |
| Facebook Ads | 1.80 | Can vary sharply by audience, creative, and funnel stage |
| Email marketing | 3.50 | Often performs well on repeat demand and owned audiences |
| Influencer marketing | 3.45 | Needs careful attribution, especially when assisted revenue matters |
| SEO | 9.10 | Reflects compounding value over time, not media spend alone |
Industry-level context changes the benchmark again. In the same First Page Sage dataset, PPC/SEM ROAS ranges from 0.95 in aerospace and defense to 2.25 in construction, while SEO ranges from 3.65 in eCommerce to 12.10 in automotive. That spread is why agencies should not sell a single “good ROAS” threshold across every client in the book.
A benchmark only helps if it matches the channel, the sales cycle, and the margin profile.
For eCommerce reporting, channel segmentation is not optional. Teams need a reporting layer that separates paid media from revenue sources cleanly, which is why many account teams use tools like Oviond's ecommerce analytics overview to keep channel performance visible without collapsing everything into one blended efficiency number. If attribution disputes are already slowing down reporting, analysts also need a way to find web scraping API pricing so they can compare data collection options before promising a new dashboard workflow.
The reporting rule is simple. Use channel benchmarks to set expectations, not to excuse weak execution. If a channel is underperforming against its own context, that needs action. If it is beating the wrong benchmark, the problem is usually the reporting frame, not the media plan.
When ROAS Lies About Profitability
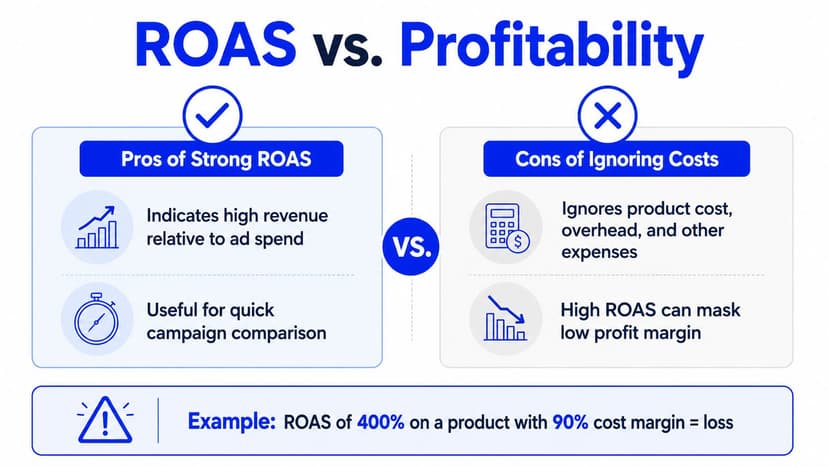
ROAS can look great while the business still loses money. That's not a theory, it's a definition problem. Standard ROAS measures revenue over ad spend, so it says nothing about product margin, shipping, transaction fees, or refunds, which means it can reward campaigns that grow revenue and damage profit at the same time.
The profit-minded alternative is POAS, profit on ad spend. The Northwestern Kellogg discussion on ROAS points to the need for margin-aware metrics, especially when a blended number hides that one campaign is revenue-positive but margin-negative (Kellogg Insight). That's why mature agency reports should stop treating ROAS as the final answer and start treating it as a first-pass efficiency read.
When to switch the conversation
If the client sells a high-margin service, ROAS may be enough to steer media decisions. If the client runs low-margin products, fast refunds, or heavy fulfillment costs, ROAS should sit beside a profit metric, not replace it. The logic is practical, not ideological, because a campaign can return strong revenue and still fail once the rest of the cost stack is applied.
The clearest way to explain this to a client is to separate revenue efficiency from business profitability. ROAS tells you how hard ad dollars are working. Profit-based metrics tell you whether the business is better off after all direct costs are counted.
For agencies, that distinction also helps in audits and fee conversations. If you need a neutral reference point for operational costs, the find web scraping API pricing article from Scrapeway is a reminder that reporting infrastructure itself has a cost layer, even before you get to media economics. That's relevant when clients ask why the team wants cleaner tracking instead of another spreadsheet patch.
Working rule: use ROAS to compare media efficiency, then switch to profit-based metrics any time margin, refunds, or fulfillment materially change the story.
Oviond's cost per lead calculation guide is useful as a companion metric, because lead efficiency and profit efficiency often need to be read together in agency reporting. If the team only reports ROAS, the client can miss the fact that revenue quality is drifting even while top-line efficiency looks fine.
Attribution Disagreements and Platform ROAS Problems
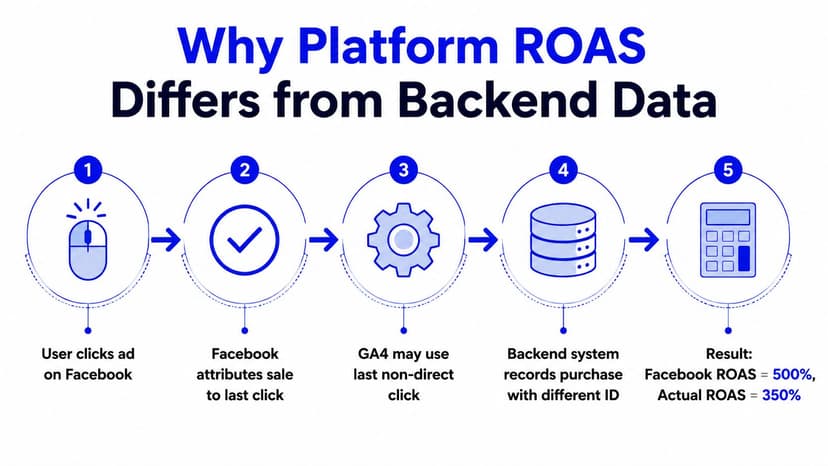
Platform ROAS and backend ROAS rarely agree perfectly. That's not a sign the dashboard is broken, it's a sign the systems are answering different questions. A platform might credit the last click, while GA4 applies a different attribution view, and the billing system records revenue against a separate order identity.
The operational problem gets worse when teams blend prospecting, retargeting, and multiple markets into one number. HubSpot's glossary points out that unified tracking and cross-platform attribution matter, but the harder issue is deciding when to trust the blended view and when to segment it by campaign type, market, or revenue source (HubSpot). In 2025, modeled data and attribution changes make that decision even more important, because platform-reported ROAS is less comparable than it used to be.
What to reconcile and when
The cleanest agency workflow is to treat the platform number as the tactical view, then reconcile it against a source of truth such as payment data or CRM revenue. That doesn't mean the platform is wrong. It means it's optimized for a different layer of the funnel than the finance system.
A practical review cadence looks like this.
- Daily or live dashboard checks: confirm that spend and attributed revenue are flowing correctly.
- Weekly client reporting: segment ROAS by campaign type and market so budget shifts don't get made on a blended average.
- Monthly reconciliation: compare platform ROAS against backend revenue or CRM data, then note the variance clearly in the report.
The important part is consistency. If the team changes attribution models, changes market mix, or launches a new retargeting structure, the report needs a note that says what changed. Otherwise the client sees a swing and assumes performance changed, when the measurement layer changed instead.
Clients usually accept attribution uncertainty if the agency names it early and shows the reconciliation rule in writing.
The way to present this is simple. Lead with the platform view for speed, then show the source-of-truth reconciliation underneath it. That keeps the report usable for account managers while still making space for the numbers the finance team will trust.
Building ROAS Dashboards That Clients Actually Use
A ROAS dashboard only works if the client can read it in under a minute. That means one clear headline metric, a few supporting channel views, and a definition panel that says exactly how the number was built. It also means the report needs to arrive on its own, because manual monthly rebuilds are where agencies start losing consistency.
Oviond is one option for this kind of setup. It pulls in analytics, ad, search, social, email, CRM, and e-commerce data into live dashboards and branded reports, with white-label delivery, custom domains, automated scheduling, calculated metrics, and goals. The practical value is simple, it cuts down the spreadsheet stitching that usually makes ROAS reporting harder than it should be.
What to put on the dashboard
Start with a headline ROAS card that uses one agreed calculation. Then add channel-level tiles so search, paid social, and email don't get flattened into one blended average. After that, include a short note that names the attribution source and whether the metric is ratio-style or percentage-style.
The dashboard should also show the context clients ask about most.
- Spend by channel: so the client can see where the budget went.
- Attributed revenue: so ROAS can be read against the right denominator.
- Target or goal: so the number has a benchmark, not just a trendline.
- Commentary field: so the account manager can explain a shift without a separate email thread.
If the agency uses templates, that structure should repeat across accounts with only the source connectors and client-specific goals changing. That's the difference between a reusable reporting system and a pile of pretty one-offs.
The internal connection matters too. Oviond's web analytics dashboards fit well when ROAS has to be shown alongside traffic and conversion context, not as a standalone media score. That's usually where clients stop asking “is the ad account good?” and start asking the better question, “which part of the funnel changed?”
A good ROAS dashboard doesn't try to impress people. It answers the same question the client asked in the first email, then shows enough context that the next email doesn't have to ask it again.
Scaling ROAS Reporting Across Your Client Base
Once an agency gets past a handful of clients, ROAS reporting breaks if every account manager defines it differently. The fix is boring but effective, standardize the formula, standardize the source rules, and standardize the delivery format. That gives the team one reporting language across all clients, while still letting each account show the right channels and targets.
That's also where operational features matter. Unlimited reports and dashboards, unlimited users, white-label delivery, and pricing tied to client count all help agencies avoid the seat-by-seat math that makes collaboration awkward. A shared reporting system should scale with the book of business, not punish the team for adding people who use it.
The report should change by client, not by who built it.
For agencies managing recurring reporting across 5 to 50-plus clients, the workflow should be repeatable. Use one ROAS definition, one reconciliation rule, one template set, and one delivery schedule. Then let the client-specific inputs do the customization work. That keeps the team out of spreadsheet drift and makes monthly reporting feel consistent instead of improvised.
If the agency needs a cleaner path, Oviond handles white-label client reporting, custom domains, automated delivery, and template-based dashboards in one place. That's the kind of setup that keeps ROAS reporting from becoming a monthly scramble.
If your team is still rebuilding ROAS reports by hand, it's time to simplify the stack. Visit Oviond to set up white-label client reporting, automated dashboards, and branded ROAS delivery that keeps every account on the same measurement rules.
Related articles
Simplify marketing reporting today
Stop juggling multiple tools. Start presenting clear, automated reports your clients will love