
Oviond Blog
Calculating Cost Per Lead: The Agency's Guide to Profit
Stop guessing. Learn the agency-focused method for calculating Cost Per Lead (CPL) across all your clients. Standardize, automate, and prove your value.

A client asks for their cost per lead on the monthly call. Your paid media manager has one number from Google Ads. Your account manager has another from the CRM. Finance has a third number in a spreadsheet nobody fully trusts. All three are defensible. None of them match.
That is the main issue with calculating cost per lead in an agency. The formula isn't hard. The operational mess behind the formula is.
If you manage recurring reporting across 5–50+ clients, CPL stops being a simple KPI and becomes a process question. Are all accounts using the same lead definition? Are you counting platform spend only, or the actual cost to generate qualified pipeline? Can you show the number in a client-ready report without rebuilding it by hand every month? If not, your agency ends up debating math instead of proving value.
Table of Contents
- Why Your Agency Needs a Standardized CPL
- Before the Formula Gathering the Right Data
- The CPL Formulas Your Agency Should Use
- Building Your Automated CPL Dashboard in Oviond
- Automating CPL Reporting for Every Client
- Answering Is Our CPL Good
Why Your Agency Needs a Standardized CPL
When agencies answer “What's our CPL?” differently across teams, they aren't just dealing with messy reporting. They're risking margin, retention, and trust.
A standardized CPL gives your team one operating definition across every client account. That matters because the moment each account manager calculates it differently, your reporting stops being scalable. One client gets platform spend divided by form fills. Another gets agency fees included. A third gets CRM-qualified leads only. The numbers look precise, but the process is broken.
The pressure gets worse as client count grows. The marketing agency industry is projected to reach $386.36 billion in market value in 2025 with a 4.5% compound annual growth rate, according to these marketing agency industry projections. In a growing agency market, manual monthly reporting doesn't hold up for teams managing multi-client delivery.
Standardization protects both reporting and profitability
A lot of agencies treat CPL as a presentation metric. It's more useful as an account health metric.
If CPL rises while lead quality drops, the problem usually isn't the report. It's targeting, offer fit, form quality, attribution, or follow-up. If CPL looks low but sales keeps rejecting leads, you're buying cheap noise. Standardization helps you catch that early because every client gets measured the same way.
Practical rule: If your team can't explain exactly what counts as spend and exactly what counts as a lead in one sentence, your CPL isn't standardized.
That's also why a process matters more than the formula itself. The arithmetic is easy. The agency challenge is getting the same logic applied across Google Ads, LinkedIn Ads, GA4, forms, CRM stages, and client-facing reports without rebuilding the whole thing every month.
Why agencies struggle to keep it consistent
Three issues usually cause the drift:
- Scattered numbers: Spend lives in ad platforms, lead counts live in forms or CRM records, and payroll or software costs often live somewhere else.
- Manual reporting habits: Teams export CSVs, clean data in Sheets, and make judgement calls account by account.
- Client presentation pressure: Even when the math is right, agencies still need branded, readable reporting that clients can understand quickly.
If you need a cleaner framework for KPI consistency before you lock CPL in place, this guide on what marketing KPIs agencies should track is a useful starting point.
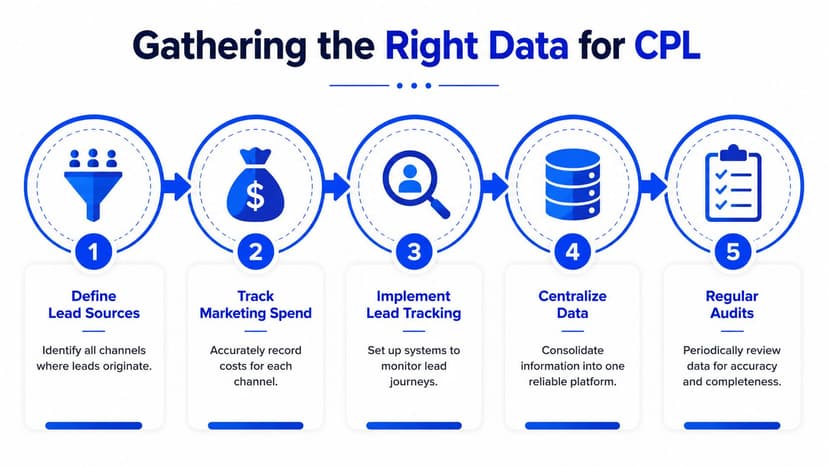
Before the Formula Gathering the Right Data
Most CPL errors happen before anyone touches a calculator.
Teams usually rush to divide ad spend by conversions from a platform dashboard. That produces a number, but not a reliable one. Agency reporting gets more accurate when you gather the inputs with the same discipline every month, across every client.
Start with one lead definition
Before you calculate anything, lock the denominator.
A “lead” can mean a contact form fill, booked consultation, demo request, whitepaper download, MQL, or SQL. If one client report uses form fills and another uses MQLs, your multi-client CPL reporting becomes impossible to compare. That's why the lead stage has to be defined first and kept consistent.
A rigorous CPL method requires agencies to aggregate full costs and divide by a strictly defined lead stage such as MQL or SQL, not a vague conversion bucket, as outlined in this Mailchimp CPL methodology reference.
The denominator causes more reporting damage than the numerator. Teams can usually find spend. They lose consistency when “lead” changes from report to report.
In practice, agencies should pick one main reporting standard for recurring delivery. Usually that means MQL for top-of-funnel efficiency reporting, plus a second quality metric later in the report for SQL or opportunity performance.
Count the full cost, not just ad spend
Platform spend alone almost always understates the true cost of generating a lead.
For agency reporting, the cleanest approach is to pull together the five cost buckets that matter:
- Paid media: Google Ads, LinkedIn Ads, Meta Ads, Microsoft Ads, and any other direct campaign spend.
- Marketing tech stack: Attribution tools, call tracking, automation, form tools, landing page software, and reporting tools used to support lead generation.
- List or data acquisition: Purchased lists, prospecting databases, or external lead data used upstream.
- Verification and enrichment: Email verification, enrichment, and validation tools that make top-of-funnel activity usable.
- Allocated payroll: The portion of SDR, marketing, or campaign-management labor tied to top-of-funnel execution.
That's also why pricing conversations with clients get messy if you don't have a complete cost model. If you're reviewing retainers or prospecting economics, this breakdown of how agencies compare lead gen agency prices is a helpful external reference.
Centralize before you calculate
Most agencies don't have a math problem. They have a source-of-truth problem.
Marketing teams cite lack of centralized data as a major reporting obstacle, and that matches what agency ops teams deal with every month. Spend sits in platform dashboards, lead counts sit in forms or CRMs, and qualification data may only exist in pipeline stages or sales notes. Until that data is brought into one reporting workflow, calculating cost per lead stays fragile.
A practical checklist helps:
- Pull spend by channel from every active lead-gen platform.
- Validate lead counts against one agreed source, usually the CRM or a tracked form destination.
- Map qualification stages so MQL and SQL mean the same thing each month.
- Add non-media costs where your agency includes them in the reporting model.
- Audit duplicates and timing so spend and lead counts cover the same date range.
If your team is still wrestling with lead source visibility, lead tracking made easier gives a practical look at tightening that part of the workflow.
The CPL Formulas Your Agency Should Use
On Monday morning, one account manager pulls CPL from Google Ads form submissions, another uses CRM-created leads, and a third includes management fees in spend. By Friday, the agency is presenting three different versions of the same metric. The formula is simple. The operating model around it is where agencies usually lose consistency.
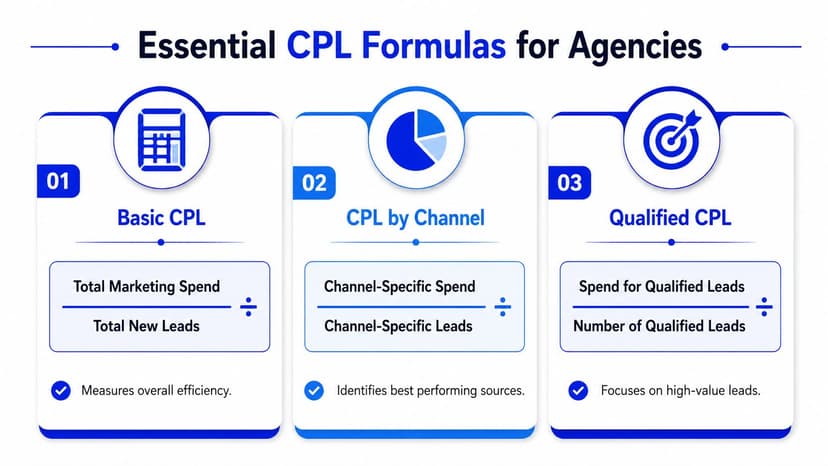
For client reporting, use a small set of formulas with fixed definitions. That gives your team one way to calculate CPL across every account, while still leaving room for channel and funnel detail inside a marketing dashboard template for agencies.
Start with one agency-wide baseline
Every client should have a standard blended number:
CPL = Total Marketing Spend / Total New Leads
This is the headline metric. It gives clients a clean top-line view and lets your team track direction month over month. It also keeps monthly reporting from turning into an argument about methodology.
The key is to standardize the inputs, not just the math. Decide once whether spend includes only media or media plus agency fees. Decide once what qualifies as a lead. Then keep those definitions fixed across every dashboard and QBR.
Break CPL into the views your team can act on
A blended CPL is useful for account summaries. It is weak for optimization.
Two additional formulas do the work:
CPL by channel
Channel spend / channel leads
Use this to compare paid search, paid social, organic, partner, and any other source you report consistently.CPL by campaign
Campaign spend / campaign leads
Use this when one offer, landing page, geography, or audience segment is skewing the account average.
This is usually where messy client setups show up. One channel may count leads from native platform forms, while another relies on CRM attribution. If those lead sources are not aligned, your channel CPL table will look precise while telling the wrong story.
Moving Beyond Raw CPL to Effective CPL
Raw CPL is the acquisition metric. Effective CPL adds quality.
Agencies should report both, because a cheap lead that never reaches sales acceptance will distort channel performance. In practice, the second metric is usually one of these:
Cost per MQL
Total spend / marketing qualified leadsCost per SQL
Total spend / sales qualified leadsEffective CPL
Total spend / qualified leads, using the qualification stage your agency and client have agreed to report
Wall Street Prep's explanation of CPL blind spots makes the same point in practical terms. Lead cost only becomes useful when it is viewed alongside downstream qualification rates in its cost per lead analysis.
A simple client example:
| Channel | Raw CPL view | Qualified lead view |
|---|---|---|
| Google Ads | Higher lead cost | More leads may reach SQL because intent is stronger |
| LinkedIn Ads | Lower or similar lead cost | Leads may stall before qualification if targeting or offer fit is weak |
This is the version I want account teams presenting in reviews. Raw CPL explains media efficiency. Qualified CPL explains whether that efficiency survives the handoff to sales.
If you want to extend the conversation beyond leads and into fuller funnel economics, this explainer on true cost per acquisition is a useful companion.
Add a sustainability formula for strategy conversations
Some metrics belong in the dashboard. Others belong in the review deck.
A sustainability check helps account leads answer the question clients care about. Can the business afford this lead cost?
Use a simple benchmark formula:
Maximum Sustainable CPL = LTV × Gross Margin % × Close Rate
If actual CPL is above that number, the channel may still generate leads, but it is putting pressure on margin. That changes the discussion from “why is this CPL high?” to “does this lead cost still work for the client's economics?”
That is a better agency conversation. It ties reporting back to business reality, especially in accounts where lead quality, sales cycle length, and close rate vary sharply by source.
Building Your Automated CPL Dashboard in Oviond
A CPL model becomes useful when your team can reuse it without touching a spreadsheet every month.
That's the point of moving the logic into a dashboard workflow. Once the calculation lives inside the reporting layer, account managers stop rebuilding the same metric for every client, and clients stop getting slightly different answers depending on who pulled the report.
Marketing teams report 37% lack of access to centralized data as a top challenge when showing business impact, according to Smartsheet's research report. Agency teams feel that pain every time they try to combine ads, analytics, CRM, search, social, and email into one number.
Build one reporting logic, then reuse it
For agency ops teams, the smartest setup is template-first.
Create a standard CPL dashboard structure once. Then duplicate it across clients and swap the connected data sources. That keeps layout, metric logic, commentary blocks, and visual hierarchy consistent across accounts. It also makes QA easier because your team is reviewing one reporting model, not dozens of custom ones.
A practical build sequence looks like this:
Connect the core sources
Bring in ad platforms for spend, analytics for conversions, and CRM or lead-tracking sources for qualified lead counts.Create calculated metrics
Build the base CPL formula first. Then create channel-specific formulas and a qualified-lead version where the denominator is MQLs or SQLs.Blend where needed
If spend is coming from multiple ad channels but lead stage is validated in one CRM source, combine them in the calculated metric rather than trying to force one source to do everything.Lock naming conventions
Use identical metric names across all client templates. “Blended CPL,” “Google Ads CPL,” and “Cost per SQL” are far easier to govern than account-specific labels.
What the dashboard should include
Agencies often overload CPL dashboards with too many charts. A better client-facing setup is tighter.
Include the metrics that answer the client's likely questions first:
- Blended CPL for the reporting period
- CPL by major channel so the client can see source-level efficiency
- Qualified lead volume to stop the low-cost, low-quality trap
- Trend view so month-over-month movement is visible
- Context note explaining what counts as a lead in this report
A short comparison table inside the dashboard works well too:
| Dashboard element | Why it matters |
|---|---|
| Blended CPL | Gives clients the headline number fast |
| Channel CPL | Shows where budget is working or slipping |
| Cost per SQL | Connects marketing output to sales quality |
| Trend line | Keeps the conversation focused on direction, not one snapshot |
| Notes panel | Prevents lead-definition confusion |
Keep commentary short. If a client needs a paragraph to understand the metric, the dashboard layout is doing too much.
Set targets and keep commentary tight
Once the formulas are in place, add goals to the metric set.
Targets help account managers frame performance without hand-writing the same explanation every month. If a client's target CPL is tied to their economics, the dashboard can show whether the current period is within range, above range, or improving toward range.
For agencies standardizing this across many accounts, reusable dashboard frameworks matter more than flashy customization. The cleaner approach is to keep one branded structure, one naming system, one commentary style, and one delivery rhythm. If you want examples of how agencies organize that visually, these marketing dashboard examples for agencies are worth reviewing.
Automating CPL Reporting for Every Client
A good CPL calculation still creates operational drag if your team has to package it manually for every account.
That's where agencies usually hit the wall. One client needs a branded PDF. Another wants a link. Another wants a monthly email summary with current numbers. If the reporting process depends on someone exporting, cleaning, screenshotting, and reformatting data every month, the agency eventually pays for that in labor and inconsistency.
Templates beat one-off reports
Agencies scaling across multiple clients need repeatable delivery, not custom report production every cycle.
The simplest setup is to create one white-label reporting template for lead generation accounts, then adapt it by client type or service mix. Your team keeps the same CPL widgets, same commentary prompts, same visual order, and same delivery schedule. That consistency cuts confusion internally and gives clients a familiar reporting experience.
This matters even more in B2B accounts because CPL expectations vary so widely. The global average CPL across industries is approximately $198 as of 2026, but B2B benchmarks range from $420 to $3,080, according to LanderLab's CPL benchmark overview. That kind of spread means agencies need contextualized reporting, not generic scorecards.
White-label delivery matters more than agencies admit
Clients notice the delivery layer.
If the report arrives from a generic platform address, uses mixed branding, or sends them to a dashboard URL that doesn't match your agency identity, it weakens the experience. A clean white-label setup fixes that. Branded dashboards, automated delivery, custom domain support, and custom email sender options make recurring client reporting feel like part of your service, not an add-on assembled from disconnected tools.
That matters when client-success teams are trying to reinforce confidence month after month. “Agency reporting that finally feels simple” isn't a slogan problem. It's an operations problem.
Balanced tool comparison
Most agencies looking at this workflow compare the same group of tools. AgencyAnalytics, Whatagraph, Swydo, and Looker Studio all come up for good reason. Each can fit certain teams.
A balanced view looks like this:
- Looker Studio: Flexible and familiar, but many agencies outgrow the manual upkeep and report sprawl.
- AgencyAnalytics: Agency-focused and established, especially for recurring client dashboards.
- Whatagraph: Strong presentation layer for agencies that care a lot about polished visuals.
- Swydo: Common in PPC-heavy reporting workflows and scheduled client delivery.
The trade-off usually comes down to how much setup complexity, template maintenance, white-label control, and pricing friction your team is willing to carry as client count grows. Agencies tend to prefer tools that support multi-client reporting, branded dashboards, automated delivery, and pricing that scales by client count instead of pushing extra cost into users, reports, or feature tiers.
If your current process still relies on hand-built exports or scattered Looker Studio files, reviewing automated marketing reports for agencies is a sensible next step.
Answering Is Our CPL Good
A client sees CPL jump 18% month over month and asks, "Is this a problem?" If your team has to scramble through ad platforms, CRM stages, and last month's notes before answering, the issue is bigger than one metric. The underlying problem is inconsistency. Across a large client roster, "good CPL" has to be answered the same way every time, with room for each client's economics and sales process.
Use context before judgment
The strongest answer starts with a framework, not an opinion.
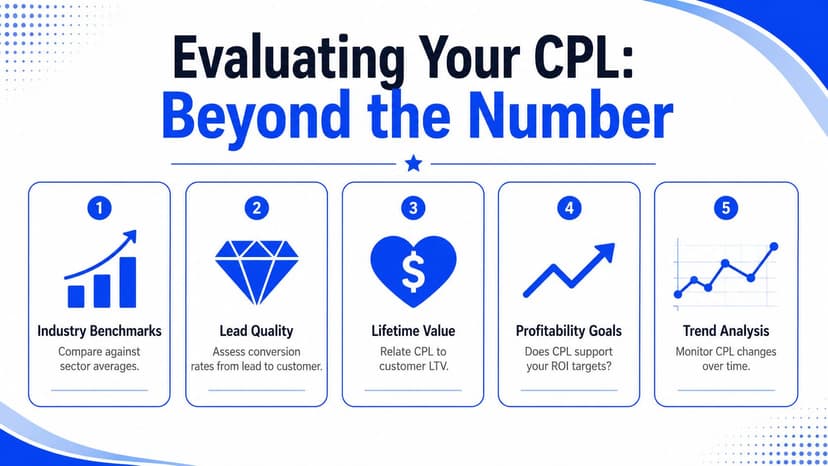
Start with the client's own baseline. Compare current CPL to the trailing average, recent trend, and the period before any major budget, offer, or channel changes. Then explain what changed. If paid search spend increased, sales tightened lead qualification, or Meta started driving more top-of-funnel volume, say that plainly.
Raw CPL rarely answers the full question on its own. Focus on leads that progress, as cheap leads that stall offer no value. A higher CPL can still be healthy if lead-to-opportunity movement improves or the client is buying into a channel that produces better downstream revenue.
A useful client-facing line sounds like this: "CPL is up this month, but the increase came from channels generating stronger sales conversations, so the cost is still within an acceptable range."
Tie CPL back to business reality
Clients are not really asking about the formula. They are asking whether the number supports growth.
Answer that by tying CPL to what the business can afford. Look at close rate, average deal value, margin, sales capacity, and payback expectations. A CPL that works for a high-ticket B2B service will look expensive in a lower-margin model. The same number can be fine for one client and a clear warning sign for another.
This is the part many agency teams skip because it takes more setup. It also makes the conversation better. Instead of defending media performance in isolation, you are showing whether acquisition costs fit the client's actual operating model.
A solid answer usually includes:
- Trend: How current CPL compares with the client's recent history
- Lead progression: Whether leads are turning into the stages that matter for that client
- Driver: Which channel, campaign, or operational change moved the number
- Economic fit: Whether the client can profitably support that acquisition cost
That structure helps account managers answer the same question across 50 clients without giving a vague, case-by-case response. It also makes dashboards more useful. The dashboard shows the number. Your commentary explains whether action is needed, where to look first, and how confident the client should feel about performance.
If your agency is tired of spreadsheet-heavy monthly reporting, Oviond gives you white-label client reporting built for multi-client delivery. You can pull data from 70+ integrations into branded dashboards, use calculated metrics for CPL, automate delivery, run everything on a custom domain, and keep unlimited reports, dashboards, and users in one plan priced by client count. It's the simpler, agency-native alternative to spreadsheet sprawl and Looker Studio chaos. Agency reporting that finally feels simple.
Related articles
Simplify marketing reporting today
Stop juggling multiple tools. Start presenting clear, automated reports your clients will love