
Oviond Blog
Seo Report Template Word
Seo report template word. Build a branded SEO report template in Word, choose the right KPIs, automate delivery, and connect live Oviond dashboards

Your SEO report is due tomorrow. Search Console is open in one tab, Analytics in another, Ahrefs is exporting backlink data, and the local rank tracker is still loading. Meanwhile, account managers are asking where the client PDFs are, and every report seems to have a different layout, date range, and explanation.
A Word document can fix the presentation problem, but it won't fix a fragmented reporting process on its own. The practical approach is to use an SEO report template in Word as the client-ready narrative layer, then connect it to a repeatable system for KPI evidence, live dashboards, branded delivery, and next actions.
Table of Contents
- Why Agencies Need a Repeatable SEO Report Template
- Build the Document Structure and Brand System
- Choose SEO KPIs for Better Client Decisions
- Turn Data Into a Client-Ready Report
- Export and Distribute the Finished Report
- Compare Word Reports and Live Dashboards
- Automate Agency Reporting With Oviond
Why Agencies Need a Repeatable SEO Report Template
At the start of a reporting cycle, the work rarely begins with analysis. It begins with hunting for the latest exports, checking whether each account uses the same metric definitions, and copying charts into documents that have slowly drifted away from the agency's brand standards.
One account manager may lead with rankings. Another may start with organic sessions. A third may write a long explanation before showing the client what changed. None of these approaches is automatically wrong, but inconsistency creates unnecessary review work and makes the agency look less organized than it is.
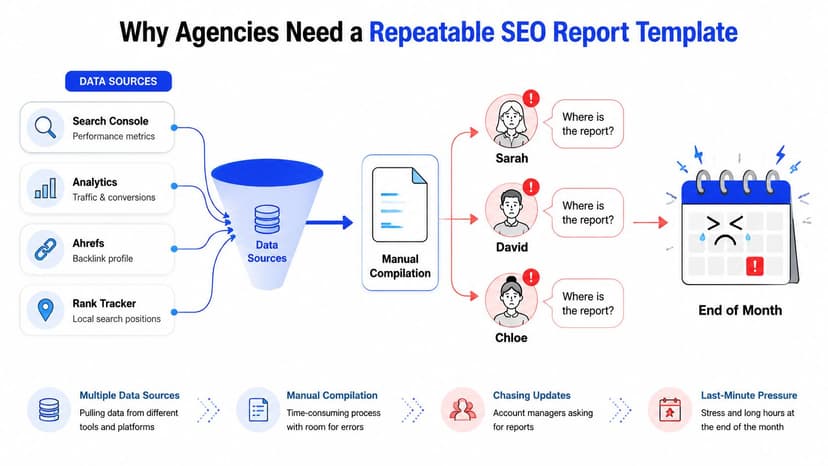
A reusable template gives the team a fixed starting point. It defines the order of the story, the location of the evidence, and the space reserved for recommendations. Microsoft's Word guidance confirms that users can browse free report templates, replace placeholder text, customize fonts and branding, then share by link or export to PDF through Word for the web](https://word.cloud.microsoft/create/en/papers-and-reports/). That browser-based workflow matters for agencies with account managers, analysts, and client-success staff working in the same document.
Standardization is more valuable than decoration
A strong template doesn't just make a PDF look polished. It establishes:
- A common narrative: Every report opens with the same type of executive summary and explains performance before listing tasks.
- Defined evidence: Each KPI has a named source, reporting period, and agreed interpretation.
- Clear ownership: Recommendations identify what the agency will do, what the client needs to approve, and what happens next.
- Reusable formatting: Headings, charts, captions, page breaks, and appendix sections behave consistently.
The template ecosystem reflects this operational need. Template.net lists dedicated SEO report templates in Word and other editable formats, while Business-in-a-Box provides a Word SEO audit framework for findings, severity ratings, and prioritized fixes](https://www.template.net/reports/seo). Agencies can also review a small business agency buyer's guide when assessing how reporting fits into a broader client-service model.
The document should become the stable layer around your process, not another monthly project. A useful reference for structuring the wider story is this guide to the power of a good digital marketing report. Once the structure is fixed, the team can spend its time explaining performance instead of rebuilding pages.
Build the Document Structure and Brand System
Start with a blank Word document, but don't start by typing client commentary. Build the master layout first, then save it as the agency template that every account manager uses.
The document needs three clear zones. The cover should include the client logo, reporting period, prepared-by line, and a narrow color bar drawn from the agency palette. The executive narrative should give the client a concise interpretation of performance. The evidence section should hold charts, KPI tables, technical findings, content observations, and supporting screenshots.
Set styles before adding content
Create Word styles for the title, major headings, subheadings, body copy, captions, tables, and callouts. Consistent styles keep the report readable and help Word generate a clean table of contents and usable PDF bookmarks.
Use a dedicated Caption style beneath every chart. A caption should identify the metric, date range, and source without forcing the reader to guess what the visual represents. Set default paragraph spacing, line spacing, margins, and page breaks in the master file rather than asking each account manager to format them manually.

Build reusable report blocks
Save common components as Quick Parts or equivalent reusable building blocks in a shared agency template:
- Executive Summary: A short explanation of the most important movement and its business meaning.
- KPI Snapshot: A compact table with current performance, comparison period, and status.
- Performance Versus Goals: A view of progress against agreed targets.
- Work Completed: Technical, content, link, and strategic work delivered during the period.
- Next 30 Days: Specific tasks, owners, dependencies, and expected business purpose.
- Appendix: Raw data, screenshots, definitions, and notes that support the main narrative.
Keep branding controlled in the header and footer. Store the logo, color palette, page numbering, and agency contact details in the template, then restrict editing where appropriate so imported screenshots don't change the document's structure.
Microsoft's template model supports reusable report layouts for business, academic, and project needs, which is useful context for agencies adapting Word to recurring client work. Independent libraries also show that these assets are available in editable and print-friendly formats across Word, Google Docs, and Apple Pages](https://www.template.net/reports/seo). The design should serve the reporting logic, not compete with it.
Choose SEO KPIs for Better Client Decisions
A client doesn't need every metric your tools can export. They need the measurements that connect their business objective to the part of the funnel SEO is influencing.
A lead-generation client may care about organic sessions, form fills, qualified leads, and conversion rate. A local-services client may need visibility in local results, calls, and direction requests. A SaaS client may focus on organic content that contributes to trial signups and pipeline. The report should reflect that difference instead of giving every account the same dashboard.
Organize metrics by decision area
A practical Word report can group KPIs into four sections:
- Visibility: Impressions, average position, and share of voice help explain whether the site is appearing for relevant searches.
- Traffic: Organic sessions and landing-page distribution show where visits are coming from and which pages attract attention.
- Engagement: Bounce rate, time on page, and scroll depth help the team assess whether important landing pages satisfy visitors.
- Conversion: Goals, form fills, revenue, and qualified leads connect organic performance to business outcomes.
Every KPI should include its definition, source, comparison period, and interpretation. A ranking movement might be useful evidence, but it doesn't automatically represent commercial progress. A conversion change may deserve more attention even when visibility appears stable.
Practical rule: If a metric doesn't influence a decision, move it to the appendix or remove it from the client-facing report.
Match the report to the account
| Client Type | Primary Objective | Recommended KPI Sections | Key Data Sources |
|---|---|---|---|
| Lead-generation business | Generate qualified enquiries | Traffic, Engagement, Conversion | Google Analytics, Search Console, CRM |
| Local-services business | Increase local discovery and enquiries | Visibility, Traffic, Conversion | Search Console, Analytics, local rank tracker |
| SaaS business | Support trials and pipeline | Visibility, Traffic, Conversion | Search Console, Analytics, CRM |
| Content-led publisher | Grow relevant organic reach | Visibility, Traffic, Engagement | Search Console, Analytics |
Technical SEO belongs in its own health section, even when the client's main goal is revenue. Indexing problems, broken links, speed issues, and template errors can explain why otherwise strong content isn't performing. For teams that need a practical reference on how to measure site speed, the measurement process should feed into the technical section rather than appear as an isolated score.
Use the important SEO metrics to keep track of as a starting point, then remove anything that doesn't support the client's agreed objective. A shorter report with clear evidence is more useful than a longer document full of disconnected numbers.
Turn Data Into a Client-Ready Report
A finished report should read like a business review, not a folder of screenshots. Each section needs a takeaway, evidence, and a decision.
Consider a local-services client whose organic visibility improved for service pages while the pages receiving visits produced few enquiries. The executive summary shouldn't say only that rankings increased. It should explain that visibility improved, identify which pages attracted the traffic, show what happened to enquiry actions, and recommend improving the conversion path on the pages with commercial intent.
Use a consistent evidence pattern
Lead each major section with one sentence that tells the reader what the data means. Follow it with a clearly labeled chart or table from Search Console, Analytics, a rank tracker, or another approved source. Close with two or three actions tied to an outcome, such as improving a service page, correcting an indexing issue, or testing a stronger enquiry path.
The document should separate three layers:
- Narrative: What changed and why it matters.
- Evidence: The chart, table, or screenshot that supports the statement.
- Action: What the agency or client should do next, with an owner where possible.
A KPI without interpretation creates work for the client. A recommendation without evidence creates doubt. The report earns trust when those elements reinforce each other. Guidance on data visualization for your report is useful when deciding whether a chart, table, or annotated screenshot communicates the point clearly.
Run a pre-send quality check
Before exporting, check:
- Title clarity: Does the heading state the subject and reporting period?
- Chart labels: Can a client understand the axes, units, legend, and date range?
- Source attribution: Does every visual identify where its data came from?
- Date consistency: Do the summary, KPI table, charts, and appendix use the same comparison logic?
- Next-step ownership: Does each recommendation identify the responsible person or team?
- Link behavior: Do dashboard links open for the intended client users?
- Brand consistency: Are logos, colors, fonts, and page breaks correct?
That final review catches the problems that make a technically accurate report feel unreliable.
Export and Distribute the Finished Report
Word is useful when the client needs a formal, portable record. Save the final document as a PDF when formatting must remain stable across devices, particularly for executive reviews, approvals, or offline sharing. Keep the editable Word file in the agency workspace, not as the default client attachment, unless the client needs to add comments or collaborate on the document.
Before exporting, update the table of contents, check page breaks, confirm that charts haven't been compressed, and open the PDF independently. Add live dashboard links where deeper exploration is useful. The PDF can provide the narrative and monthly record, while the link gives the client access to current supporting detail.
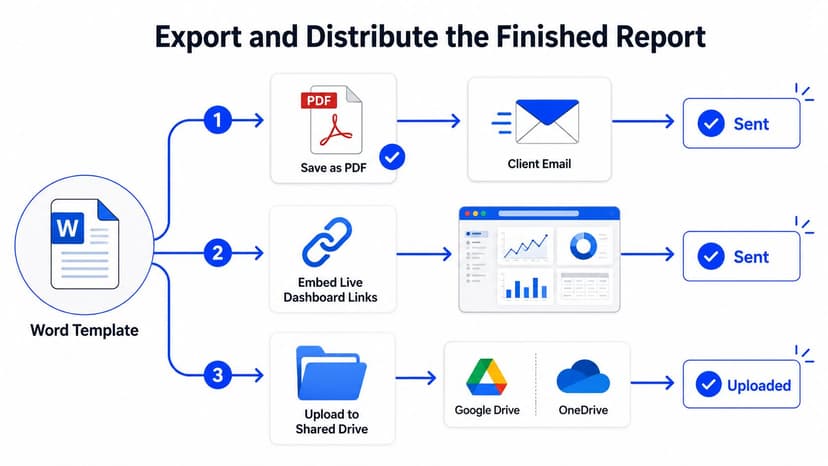
Use a simple delivery sequence:
- Finalize: Complete the narrative, evidence, and action owners in Word.
- Protect: Apply password protection or Restrict Editing when the file contains sensitive information. Add a watermark only when it serves a clear purpose.
- Export: Save the approved version as PDF.
- Store: Upload it to the client portal, shared drive, or approved cloud folder.
- Notify: Send a short email with the report link and one sentence summarizing the main decision.
Use a consistent file name containing the client, reporting period, and document status. That prevents draft and final versions from being confused across account teams. Microsoft confirms that Word for the web supports sharing by link and exporting reports as PDFs, making this workflow workable without relying solely on desktop software](https://word.cloud.microsoft/create/en/papers-and-reports/).
Compare Word Reports and Live Dashboards
Word and live dashboards solve different client problems. A Word report is strong at narrative, formal presentation, offline review, and one-off audits. It gives the agency control over the order of the story and creates a stable record that can be discussed in a meeting.
Its weakness is freshness. Screenshots become dated, manual updates create version risk, and a client who wants to investigate a metric must ask for another export. A live dashboard is stronger for trend exploration, current KPI checks, and recurring access, but it may not provide the same concise explanation or formal sign-off record.
| Tool | Best For | Limits |
|---|---|---|
| Word report | Formal monthly narrative, executive review, one-off audits | Manual updates, static evidence, version control |
| Spreadsheets | Flexible calculations and internal working files | Fragile formatting, scattered sources, difficult client presentation |
| Looker Studio | Custom dashboards and familiar Google data workflows | Requires careful setup, maintenance, and consistent sharing controls |
| AgencyAnalytics | Agency reporting across connected marketing sources | Scope, pricing, and dashboard preferences vary by agency |
| Whatagraph | Visual multi-channel client reporting | Workflow fit depends on required sources and report complexity |
| Swydo | Branded reporting and scheduled agency delivery | Teams should assess integrations, customization, and pricing for each account |
| Oviond | White-label dashboards and scheduled multi-channel client reporting | Requires an initial system setup and agreed KPI structure |
Swydo describes white-label reporting as client delivery under the agency's brand, including agency logos, custom domains, and agency email addresses](https://www.swydo.com/blog/best-white-label-reporting-tools/). That standard is useful when comparing platforms, because white-labeling should cover the client experience rather than just a logo on a PDF.
The sensible choice isn't one format for every account. Use Word for the explanation and formal record. Use a live dashboard for ongoing access and deeper detail. Keep spreadsheets for controlled internal analysis, not as the client-facing system.
Automate Agency Reporting With Oviond
The Word file should sit on top of the reporting workflow, not carry the whole workflow by itself. If the agency still exports every chart, pastes every screenshot, checks every date range, and emails every client manually, a polished template has only improved the last mile.
A practical system separates three layers:
- KPI evidence: Approved metrics pulled from Search Console, Analytics, advertising platforms, CRM tools, and other sources.
- Client narrative: The executive summary, interpretation, work completed, and recommendations written for the account.
- Next actions: Prioritized tasks with owners, dependencies, and a business reason.
Oviond is designed for agency client reporting, with live dashboards, scheduled branded reports, white-label delivery, custom domains, and connections across search, analytics, advertising, social, email, CRM, and e-commerce. Its product information lists 60+ integrations, unlimited reports, unlimited dashboards, unlimited users, custom data imports, calculated metrics, goals, and AI-assisted setup through an MCP server](https://www.oviond.com/marketing-reporting-software/).
Map the system to the Word template
Start by defining the master document before connecting accounts. Write down the approved KPI definitions, reporting periods, brand rules, dashboard names, delivery schedule, and source notes. Then map each dashboard component to a location in the document.
For example, the executive summary may reference the KPI snapshot, while the organic-performance page draws from Search Console and Analytics views. The technical section can hold the agency's findings and screenshots, while the live dashboard provides the client with an always-current view after the PDF has been delivered.
Oviond's white-label controls support branded dashboards and reports, custom domains, and custom email senders. That lets the agency present a consistent client experience across the dashboard, report link, and scheduled delivery instead of sending clients through a vendor-branded portal.
Use automation for repeatable delivery
Scheduled automation can handle the mechanical sequence of data refresh, transformation, report generation, and email delivery. One source describes scheduled reports in formats including PNG, JPEG, PDF, and CSV](https://www.cyfe.com/white-label-dashboard/). Another explains the workflow as data refresh, transformation, report generation, and delivery running in sequence without manual steps](https://www.cyfe.com/white-label-dashboard/).
Because an external URL may be used only once, the operational principle matters more than the repeated citation. Set a standard refresh schedule, check exceptions before sending, and keep a clear owner for report approval. Automation should remove repetitive handling, not remove quality control.
A white-label setup should also include the agency's color palette, custom domain, and sender identity. ClicData describes these controls as extending beyond logos to custom colors, domains such as reports.youragency.com, and delivery from the agency's email domain](https://www.clicdata.com/blog/white-label-reporting/). Those details affect whether the report feels like part of your service or a file generated by a third party.
Roll out the process in stages
Don't migrate every client at once. Use a controlled rollout:
- Document the standard: Finalize the Word template, KPI dictionary, brand rules, page structure, and delivery process.
- Create account variants: Change only the client logo, goals, priorities, recipients, data notes, and relevant dashboard views.
- Test selected accounts: Ask account managers and clients where the narrative, links, or evidence create friction.
- Train the delivery team: Make it clear who updates commentary, who checks charts, who approves the report, and who owns next actions.
- Review monthly: Check source changes, metric definitions, access permissions, dashboard links, and recipient lists.
The resulting hybrid process is more useful than a static file alone. The client receives a clear Word or PDF overview, the account team maintains a consistent narrative, and the client can open a branded dashboard when the monthly record doesn't contain enough detail.
Agency reporting should finally feel simple, but simplicity comes from removing repeated decisions. A Word template gives the team a dependable client-ready layer. Oviond adds live data connections, white-label dashboards, scheduled distribution, pricing by client count, all features in one plan, and support for unlimited reports, dashboards, and users. Visit Oviond to see how your agency can connect the reporting system behind the template and deliver a cleaner experience across every client account.
Related articles
Simplify marketing reporting today
Stop juggling multiple tools. Start presenting clear, automated reports your clients will love