
Oviond Blog
SEO Report Template for Agencies That Actually Scales
Build an agency-ready SEO report template fast. Covers KPI selection, data connections, automation, white-label delivery, and troubleshooting tips that scale.

Monday morning starts with ten SEO reports due before noon. Three connectors are throwing errors, a Google Search Console token expired over the weekend, and one client is waiting on a deck that still uses last quarter's KPIs. Someone opens a Google Sheet, someone else checks GA4, and the account manager starts copying numbers into slides. By the time the first report is ready, nobody is confident the figures, date ranges, or commentary match.
That's where an SEO report template earns its place. It shouldn't be a document your team rebuilds each month. It should be the operating layer that keeps sources, KPIs, commentary, branding, and delivery consistent across 5 to 50+ client accounts. Modern SEO templates have moved beyond simple monthly review decks into structured systems covering organic traffic, conversions, keyword coverage, landing pages, backlinks, and technical health, as reflected in the Smart Insights SEO reporting template.
Table of Contents
- When Monthly SEO Reporting Starts to Break
- Picking KPIs by Client Type
- Connecting the Data Sources
- Building the Template Structure
- White-Label and Scheduling the Delivery
- Automating Recurring Reports
- Troubleshooting the Template at Scale
When Monthly SEO Reporting Starts to Break
An SEO spreadsheet can work for a small agency. Each account manager knows which tabs to use, which formulas to copy, and whether a client expects a PDF or dashboard. Problems appear when several retainers run on slightly different versions of the same file.
The process usually starts failing as the client roster grows. The underlying issue is memory. One report uses sessions, another uses users, and a third still treats an outdated conversion event as a lead. A copied chart may retain the wrong date range, while a manually edited summary can mention a landing page that no longer contributes meaningful results.
Operational rule: If a report depends on someone remembering what to update, it is a monthly checklist disguised as a template.
The recurring failures are operational:
- Source reliability: Search Console, GA4, rank tracking, backlink, call tracking, and CRM data need assigned ownership and visible connection status.
- Repeatable structure: Clients should find performance, completed work, risks, and next actions in consistent locations.
- Consistent narrative: Every chart needs commentary that explains what changed, why it matters, and what the team recommends.
- Scheduled delivery: Reports should reach the right stakeholders without an account manager exporting and emailing each file manually.
An agency-ready template standardizes how clients read the report while letting the KPI layer change by business model. The agency-focused SEO report template organizes reporting into sections covering SEO performance, commercial performance, organic traffic and conversions, keyword coverage, landing page performance, and link earning reports. That structure turns the report into a recurring management record rather than a one-off audit sheet.
The operating model also needs clear ownership. Someone must verify source connections, another person must review the narrative, and the account lead must confirm that recommendations match the client's current priorities. Without those checks, a polished template can still deliver inconsistent numbers and weak decisions.
Picking KPIs by Client Type
A generic KPI checklist creates bloated reports. An agency-ready template starts with the client's business model, then selects metrics that can change a decision.
Google Search Console gives every account a reliable search-performance foundation: clicks, impressions, CTR, and average position. Google defines CTR as clicks divided by impressions, and average position as the average position of the topmost result. The Google Search Console performance documentation also supports breakdowns by pages, queries, countries, devices, and search appearance.
Those metrics still need context. A local client may care more about calls and direction requests than broad website sessions. An ecommerce client needs organic revenue and category performance. A B2B account may need qualified form fills and pipeline influence, while a SaaS client may judge SEO by trials, PQLs, and product-led keyword coverage.
Match the report to the commercial decision
For local businesses, include map pack visibility, Google Business Profile interactions, branded search movement, calls, and citation consistency. For ecommerce, use organic revenue, non-brand landing page sessions, category-level indexation, and product schema coverage. B2B reports should connect organic sessions with qualified form fills, pipeline-influenced visits, and movement across topic clusters. SaaS reports can center on trial signups, PQLs, and the breadth of the product-led keyword footprint.
| Client Type | Primary KPIs | Secondary KPIs | Drop From Template |
|---|---|---|---|
| Local business | Map pack visibility, calls, Google Business Profile interactions | Branded search lift, direction requests, citation consistency | Raw keyword count, broad impressions without local context |
| Ecommerce | Organic revenue, non-brand landing page sessions | Category indexation, product schema coverage, organic conversion rate | Domain authority as a standalone success measure |
| B2B | Qualified organic form fills, pipeline-influenced sessions | Topic cluster movement, assisted conversions, landing page quality | Total traffic without lead-quality context |
| SaaS | Trial signups, PQLs, product-led keyword footprint | Feature-page performance, assisted conversions, branded versus non-brand clicks | Ranking totals disconnected from product intent |
The metrics your team drops early matter as much as the ones it keeps. Total impressions, raw keyword count, and Domain Authority can create activity without showing whether the client is getting useful visibility or commercial outcomes. The important SEO metrics guide from Oviond is useful when trimming a dashboard because it keeps the discussion closer to action than collection.
Every KPI also needs a reporting frequency. Search Console performance can sit in the monthly summary, while technical alerts may need a weekly check for high-touch retainers. Offline outcomes may arrive through a CRM or sales review rather than the same schedule as search visibility. For clients measuring event-led demand, the discussion around experiential marketing revenue attribution offers a helpful reminder that the report should distinguish activity from revenue influence.
Connecting the Data Sources
A reliable SEO report doesn't need every available connector. It needs the right source assigned to the right question.
Google Search Console feeds query and landing-page performance, including clicks, impressions, CTR, and average position. GA4 adds session quality, landing-page behavior, and conversion paths. A rank tracker shows movement for the curated keyword set, rather than forcing clients to interpret an unfiltered export.
Backlink tools support referring-domain and link-health views. A call-tracking platform or CRM export closes the gap between online activity and offline outcomes, especially for local and B2B clients. The agency's SEO data source library can help teams map the available connections before designing the dashboard.
Map every connection to a reporting job
Don't add a source because it's available. Define the output first:
- Search Console: Query table, landing-page table, non-brand click share, and comparison view.
- GA4: Organic sessions, engaged visits, conversion paths, and assisted conversions.
- Rank tracker: Priority cluster movement, position distribution, and win or loss URLs.
- Backlink platform: Referring-domain health, new links, and links to strategic pages.
- Call tracking or CRM: Qualified calls, lead status, opportunity progression, or offline outcomes.
Before a client sees the report, run a short validation pass. Compare sample date ranges across sources, check currency and timezone settings, review property permissions, and confirm that the connector is pulling the expected account. A report can be visually perfect and still be wrong if GA4 uses one timezone while Search Console uses another reporting boundary.
Create a fallback rule for silent failures. If a source returns no data, the template should flag the section instead of displaying an empty chart that looks like zero performance. Store tokens and refresh credentials in an agency-controlled process, not in one employee's personal account. Staff turnover shouldn't break scheduled delivery or force a rebuild of every client connection.
Building the Template Structure
The strongest agency reports use a fixed reading order. The client should learn the flow once, then apply it every month without searching through a new layout.
Start with the executive summary. Put the reporting period, three or four core KPI tiles, a short performance narrative, and the most important decision at the top. The tiles should pull from the same data used in the detail sections below. If an account manager types the headline number manually, version drift is already present.
Use the same question in every section
Place a “What changed since last period?” callout before each section. Keep it directly above the relevant chart or table, and answer three points in plain language: what moved, what likely influenced the movement, and what the agency will do next. Clients shouldn't have to hunt through a trend line to find the point.
The organic traffic section can use a trend line, source split, and landing-page table. Add non-brand click share when brand demand could distort the picture. The keyword section needs curated cluster movement, position distribution, and a short win or loss table. A technical section works better with issue status, affected URL groups, and Core Web Vitals context than with a long audit export.
Backlinks belong after on-page or technical health, because the reader can understand authority work in the context of the pages being improved. Conversions should connect landing pages to outcomes, using assisted conversions where direct last-click attribution doesn't capture the journey. Finish with next actions, each assigned a priority, owner, and expected decision.
| Section | Widget Type | Calculated Metric | Commentary Beat |
|---|---|---|---|
| Executive summary | KPI tiles and text panel | KPI change versus comparison period | State the commercial result and the decision required |
| Organic traffic | Trend line and landing-page table | Non-brand click share | Explain the traffic movement and strongest entry pages |
| Keyword rankings | Position distribution and cluster table | Share of voice | Identify priority wins, losses, and intent gaps |
| On-page health | Issue table and URL view | Affected-page share | Explain which fixes can influence visibility or conversion |
| Backlinks | Referring-domain table and trend | Strategic-page link coverage | Connect earned links to pages and topic priorities |
| Conversions | Funnel or outcome table | Assisted conversions | Show what organic visitors did after arrival |
| Next actions | Prioritized action list | Goal progress | Assign the next work and tie it to the reported finding |
Use effective digital marketing report design elements to keep charts readable, but don't confuse visual polish with useful reporting. A clean chart without commentary is still a data dump. Agency guidance on SEO reporting processes and client narratives supports the tiered flow of executive summary, traffic and visibility, keyword movement, and action items, while warning against large keyword tables with little interpretation.
White-Label and Scheduling the Delivery
White-label reporting has two parts. The first is visual, including logo, colors, typography, and report language. The second is the delivery experience, including the URL, sender, PDF, email, and dashboard access the client sees.
Looker Studio is flexible and free, but agencies usually need to apply branding manually and manage PDF exports with more care. AgencyAnalytics, Whatagraph, Swydo, DashThis, and Semrush My Reports provide more packaged agency workflows, although their pricing, permissions, data coverage, and white-label depth differ. The right choice depends on how much flexibility the team needs and how much operational control it wants to standardize.
| Tool | White-Label Depth | Custom Domain | Scheduling |
|---|---|---|---|
| Looker Studio | Branded theme and customized layouts, with more manual finishing | Not typically the central white-label feature | Possible through connected workflows and exports |
| AgencyAnalytics | Agency branding and client-facing dashboards | Available depending on plan and setup | Automated reports and client delivery |
| Whatagraph | Branded multi-channel reports and dashboards | Available depending on plan and setup | Scheduled delivery for recurring reports |
| Swydo | Branded reports with client sharing controls | Available depending on plan and setup | Scheduling and sharing workflows |
| DashThis | Branded dashboards and reports | Supported in relevant white-label configurations | Scheduled dashboards and PDF delivery |
| Semrush My Reports | Branded report construction inside the Semrush ecosystem | Depends on the selected setup | Scheduled report delivery |
A custom domain matters because the dashboard can live at an agency address such as reports.youragency.com, keeping the software vendor out of the client experience. White-label client reporting guidance makes the same practical distinction, branding is not just a logo.
Paid platforms can reduce repetitive client setup, but agencies should check whether pricing scales by client, user, report, or data volume. Free tools give teams flexibility, yet every new client can become another rebuild. The scale rule is simple: one tool per brand, one branded domain per agency, and one core PDF template shared across clients.
Oviond positions itself as a white-label client reporting and dashboard platform for agencies, with pricing by client count, unlimited reports, dashboards, and users, white-label delivery with custom domains, 60+ integrations, automated delivery, and AI or MCP-assisted setup. Its white-label reporting tool is one option for agencies replacing spreadsheet handoffs and fragmented Looker Studio workflows.
Automating Recurring Reports
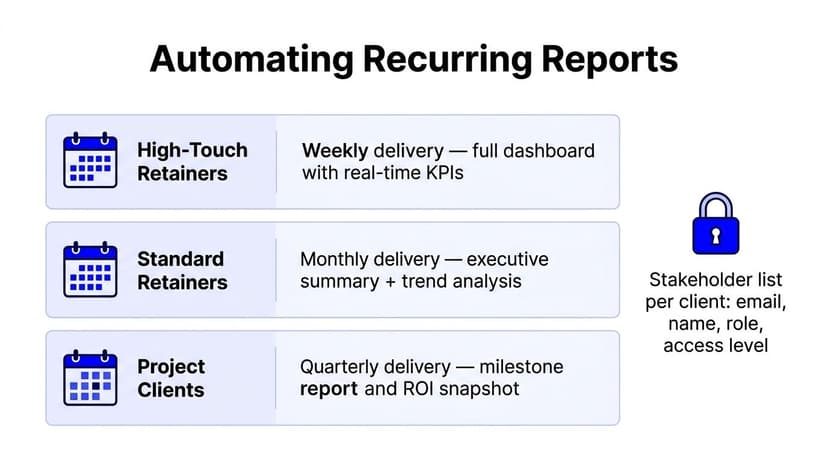
Automation should reflect the retainer, not force every client into the same delivery pattern. High-touch retainers may need weekly dashboards, standard retainers usually need a monthly executive report, and project clients may need a quarterly milestone and outcome review.
Start by locking the delivery rules:
- Set the cadence: Choose weekly, monthly, or quarterly delivery based on the client's engagement and decision cycle.
- Lock stakeholders: Store each recipient's email, name, role, and access level in the client workspace.
- Set local timing: Use timezone-aware send times so a Monday report doesn't arrive at 6 a.m. for the client.
- Add a trigger: Connect email or Slack notifications to the scheduled report and internal review process.
The failure layer matters more than the schedule itself. Run a health-check query against each data source before delivery, flag sections that return zero data, and keep a fallback text summary available if the visual render fails. Clients should receive a clear status message rather than a polished report with missing charts.
A monthly maintenance pass keeps automation from rotting. Review every active report, remove retired clients, repair broken connectors, verify stakeholder access, and confirm that the next send still uses the intended date range. Agencies that treat scheduling as “set and forget” eventually send stale reports with nobody noticing until the client does.
Watch this walkthrough for another practical view of recurring report setup.
Troubleshooting the Template at Scale
Most agencies blame a broken connector when a report goes wrong. That explains a data error, but it doesn't explain a metric error. A connector can work perfectly while branded traffic inflates the organic story, a GA4 property points to the wrong site, or a client ignores a report because the summary never answers what changed.
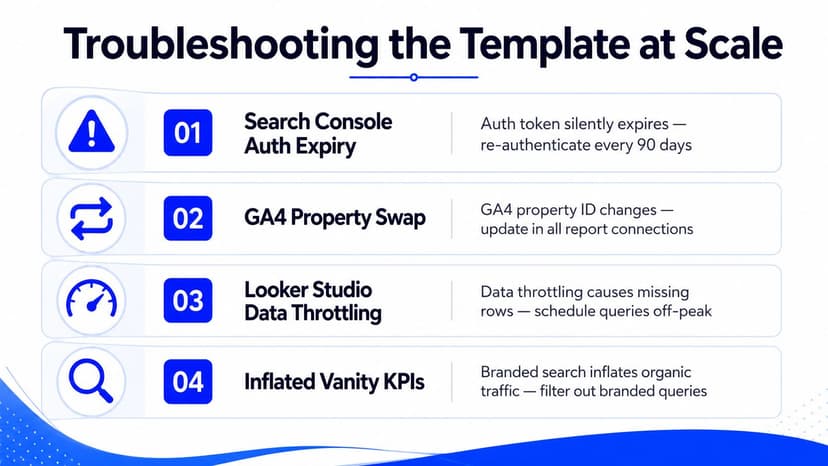
Search Console authentication can expire, so assign connection ownership to the agency rather than an individual account manager. GA4 property swaps can happen during migrations or client reorganizations, so store the property identifier in a controlled account inventory and review it before each reporting cycle. Looker Studio throttling or missing rows need a fallback view and a query schedule that avoids avoidable load.
The dangerous report isn't the one with an obvious error. It's the one that renders cleanly while telling the wrong story.
Use one operational rule for each recurring failure:
- Expired Search Console authentication: Add a connector health check and named owner before delivery.
- Changed GA4 property: Maintain a source register and test the landing-page total against the client's known property.
- Missing or throttled data: Flag zero-data sections instead of converting blanks into zeros.
- Inflated branded KPIs: Separate branded and non-brand queries before writing the executive summary.
- Clients who don't open reports: Review delivery logs and change the format or commentary before adding more charts.
Build the prevention into the template. The Monday triage sequence should be short: verify connectors, lock the date range, compare raw values with rendered values, then route the issue to the right owner. Don't rebuild the dashboard because one source failed. Fix the connection, document the exception, and preserve the shared structure.
Oviond brings SEO client reporting into one agency workflow, with Search Console and other marketing connections, reusable dashboards, white-label delivery, custom domains, scheduled reports, and AI or MCP-assisted setup. Visit Oviond to see how your agency can replace monthly spreadsheet assembly and Looker Studio sprawl with branded reporting that finally feels simple.
Related articles
Simplify marketing reporting today
Stop juggling multiple tools. Start presenting clear, automated reports your clients will love