
Oviond Blog
10 Best Marketing Reporting Tools for Agencies
Compare the best marketing reporting tools for agencies, with features, pricing notes, trade-offs, use cases, and migration tips.

Your reporting stack shouldn't run on spreadsheets. An account manager shouldn't be rebuilding monthly reports from Google Ads, Meta, GA4, LinkedIn, SEO platforms, and CRM exports while a client waits for a branded update. Yet that workflow still shows up across agencies managing recurring reports for multiple accounts.
The right system keeps source data current, standardizes the numbers and naming conventions your team uses, and delivers a polished client experience without another round of manual exports. It also needs to stay manageable as the agency adds accounts, team members, services, and reporting requirements.
Dashboard-based decision-making is now mainstream. One 2026 industry summary reports that 67% of organizations use dashboards for strategic decision-making, up from 55% two years earlier, a 12-point increase over 24 months. The same summary connects dashboard adoption with faster KPI monitoring and more frequent performance reviews, which explains the shift toward live dashboards, automated refreshes, and cross-channel reporting over static spreadsheets (industry dashboard adoption summary).
This list compares the best marketing reporting tools for agencies by multi-client setup, white-label delivery, automated reporting, integrations, pricing structure, client experience, and migration effort. You'll get ten platform reviews, clear use-case recommendations, and practical advice for moving away from spreadsheets or Looker Studio chaos. For broader marketing technology context, see this guide to the best marketing tools for founders.
Table of Contents
- 1. Oviond
- 2. AgencyAnalytics
- 3. DashThis
- 4. Whatagraph
- 5. Databox
- 6. Looker Studio and Looker Studio Pro
- 7. Supermetrics
- 8. TapClicks
- 9. NinjaCat
- 10. Funnel
- Top 10 Marketing Reporting Tools Comparison
- Choose the System Your Agency Can Operate
1. Oviond
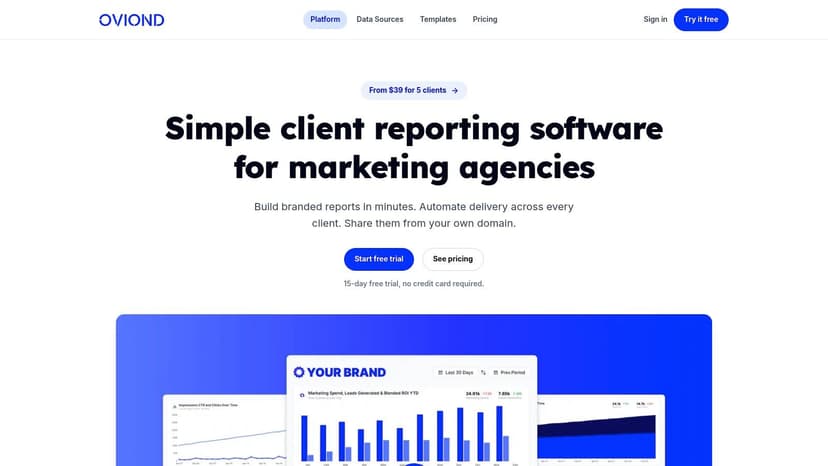
Oviond is the strongest fit for agencies that want agency reporting that finally feels simple. It brings paid media, analytics, SEO, social, email, CRM, and e-commerce data into live dashboards and scheduled, branded reports. The platform supports 60+ marketing data sources, including Google Analytics 4, Google Ads, Facebook and Meta, LinkedIn, Shopify, Mailchimp, YouTube, CSV files, and Google Sheets.
The practical advantage is the agency workflow. You can start with a prebuilt template, duplicate a reusable client structure, or build a dashboard with the drag-and-drop editor. Calculated metrics, blended metrics, goals, custom queries, and custom imports give account managers room to adapt reports without rebuilding the system in spreadsheets.
Why agencies choose Oviond
Oviond puts white-label delivery at the center. Agencies can use custom domains, custom email senders, branded dashboards, report links, scheduled emails, and embeds. Multiple custom domains are supported, with one custom domain allocation per client slot, which helps agencies give each account a more complete client-facing experience.
The commercial model is also easy to understand. All features are included in one plan, pricing scales by client count, and the platform includes unlimited reports, unlimited dashboards, and unlimited team users without per-seat fees. Plans start at $39 per month when billed annually for up to five clients, or $49 month to month, and the 15-day free trial includes all features. These figures come from Oviond's supplied product information.
Practical rule: Choose a platform that charges in a way your account managers can explain to clients and your operations lead can forecast.
Oviond also offers full API access, custom data imports, and an MCP server for AI-assisted setup with assistants such as ChatGPT and Claude. The trade-off is that complex custom reports and heavy cross-source blending can require initial configuration. Users have also reported practical quirks around widget limits, PDF exports, and some blending workflows, so test your most demanding client template during the trial.
Pros
- Agency-native pricing: One plan includes every feature, with pricing based on client count.
- Client-ready delivery: White-label branding, custom domains, and custom email senders remove vendor-facing details.
- Repeatable operations: Templates, scheduled delivery, reusable assets, goals, and calculated metrics support consistent reporting.
- Extensible setup: Full API access and custom imports cover sources outside the native connector set.
- Team-friendly access: Unlimited users support account managers, strategists, analysts, and client-success staff.
Cons
- Advanced setup effort: Specialized reports and complicated data blending take configuration time.
- Export quirks: Some users report occasional PDF or export issues that should be tested with real client deliverables.
Visit Oviond to assess the platform directly.
2. AgencyAnalytics
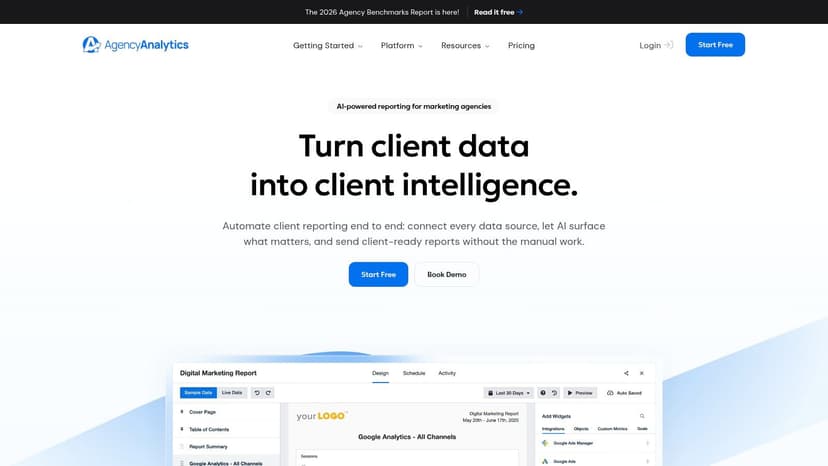
AgencyAnalytics suits agencies that need a repeatable reporting system for common paid media, SEO, analytics, social, and email accounts. Its 80+ native integrations cover a broad channel mix, so teams managing several client types can start with familiar connectors instead of building every source from scratch.
The operational advantage is access management. Paid agency plans include unlimited dashboards and unlimited staff and client users, which makes it easier to give account managers, strategists, and stakeholders the right level of access as the roster grows. White-label portals, custom domains, comments, executive summaries, drag-and-drop report building, and scheduled delivery support recurring client communication without relying on manual spreadsheet updates.
A practical fit for multi-service agencies
AgencyAnalytics makes the most sense when reporting sits alongside rank tracking, site audits, and PPC call tracking. An account manager can keep SEO deliverables, performance views, and client discussion in one platform rather than stitching together separate tools.
The limitation is data depth. Connector coverage does not guarantee access to every dimension or metric a specialist needs, and agencies with unusual sources or complex normalization requirements may outgrow the reporting layer. Confirm the required fields with a representative client account before committing to a migration.
White-label delivery also needs a domain review. The platform has historically had limits around using multiple custom white-label domains within one account, so agencies serving several brands should verify the setup against their actual client structure.
Before modeling costs for a growing roster, review this AgencyAnalytics pricing comparison. Pricing and account limits matter more once reporting expands across many clients, brands, or service lines.
Spreadsheets are relatively easy to replace when they rely on standard channel metrics. A large Looker Studio library requires more work. Templates, permissions, filters, and client views must be recreated, because finished dashboards do not transfer into the new system.
Best fit: Agencies handling standard paid, SEO, analytics, and social reporting that want client delivery and account management in one environment.
Use caution if: Your reports depend on extensive custom data modeling, uncommon connectors, or a complex multi-domain white-label structure.
See the platform at AgencyAnalytics.
3. DashThis
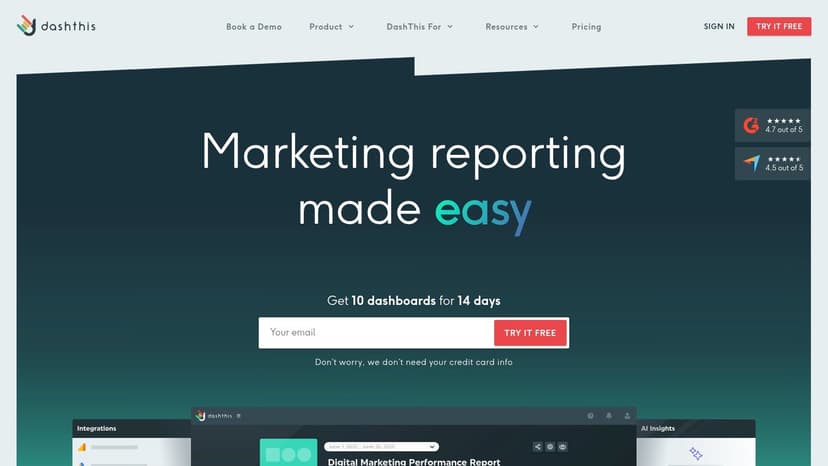
DashThis suits agencies that need a usable client report quickly, without turning every account into a custom reporting project. It connects common sources such as GA4, Google Ads, Meta, and LinkedIn, then combines templates, scheduled delivery, and branded presentation in one dashboard workflow.
The setup is account-based: connect a client's sources, choose a template, adjust the views, and schedule the report. That makes recurring delivery manageable for account managers handling several clients. It also keeps implementation closer to a repeatable checklist than a data-engineering exercise.
A practical fit for dashboard-led agencies
The main trade-off is the pricing model. DashThis charges around the number of dashboards, so costs need review when one client requires separate reports for regions, brands, or service lines. A small roster with consistent reporting can fit the model well. An agency managing many clients and report variations should calculate the total before standardizing on it.
White-label URLs and styling support a client-ready presentation. The optional AI Insights add-on can help turn dashboard changes into natural-language commentary for a monthly update. Account managers still need to explain what changed, why it changed, and what action follows.
Migration effort depends on the current reporting system. Spreadsheets built around standard channel metrics should be relatively straightforward to recreate. Looker Studio reports with intricate blends, custom formulas, and account-specific filters require more testing. Rebuild the hardest client dashboard first, then decide whether the remaining migration is worth the operational gain.
DashThis works best when native connectors already expose the metrics the agency needs. Agencies comparing client-count pricing with dashboard-based pricing can review this DashThis alternative comparison before choosing a reporting model.
Pros
- Fast client setup: Templates and direct connections reduce onboarding work.
- Branded delivery: White-label URLs and styling support agency-owned client reports.
- Commentary support: AI Insights can assist with narrative reporting when enabled.
Cons
- Dashboard-based costs: Expenses can rise as clients and report variations multiply.
- Limited modeling flexibility: Complex cross-source transformations may require another data layer.
View the product at DashThis.
4. Whatagraph
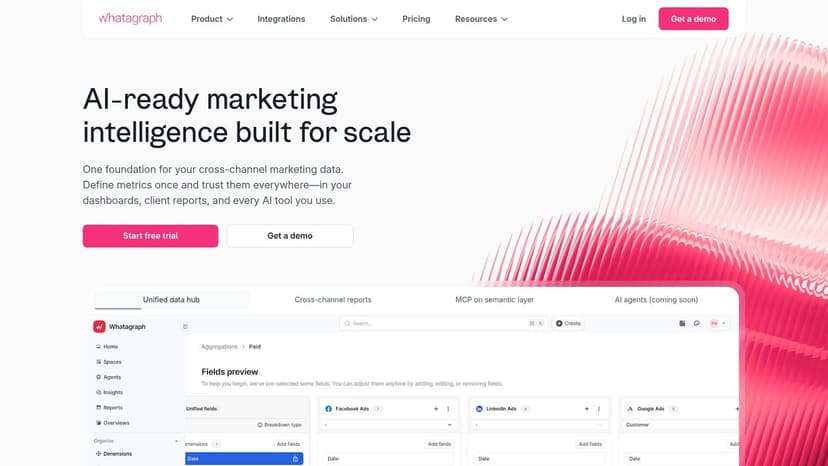
Whatagraph suits agencies that need polished, recurring client reports without rebuilding each design from scratch. It supports 40+ native integrations, plus Google Sheets, a custom API, and BigQuery for additional data sources. That combination covers common paid media, analytics, SEO, and social workflows while leaving room for less standard inputs.
The practical advantage is repeatability. Teams can create a shared visual structure, apply it across accounts, and schedule delivery on a recurring basis. White-label options keep the client experience centered on the agency, which matters when reports go directly to decision-makers.
Whatagraph prioritizes presentation and production speed over advanced data engineering. Account managers can assemble a readable cross-channel summary without asking an analyst to model every source. The result is strongest when clients want clear performance updates rather than highly customized calculations.
Check the source coverage before committing. Some users report limited visibility into social posts and scheduling-related data, and unusual campaign structures or custom metric definitions may require workarounds. Pricing is also positioned toward mid-market teams, so a small agency should model the cost across its full client roster, not just one report.
Migration requires a controlled test. For spreadsheet workflows, recreate one representative client report and verify sources, date ranges, filters, branding, and scheduled delivery before converting other accounts. For Looker Studio, document blends, formulas, and account-specific logic first. A similar layout may not reproduce the same calculations, and complex dashboards will take more testing than standard channel reports.
Agencies comparing this template-led workflow with a client-count pricing model can use this Whatagraph alternative guide.
Pros
- Polished client output: Templates standardize presentation across accounts.
- Cross-channel reporting: Native sources plus Sheets, API, and BigQuery cover common agency requirements.
- Recurring automation: Scheduled delivery reduces monthly report production.
Cons
- Mid-market pricing: Smaller agencies should calculate costs before committing.
- Social visibility limits: Confirm that post-level data matches client expectations.
Explore Whatagraph.
5. Databox
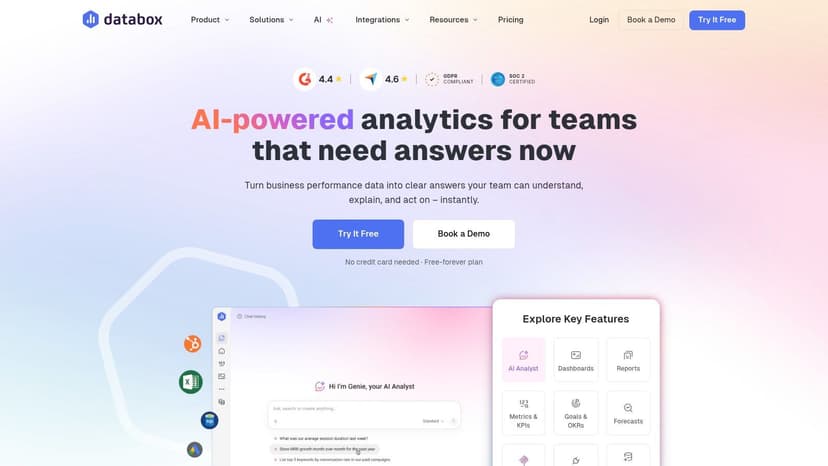
Databox suits agencies that manage ongoing KPI reviews rather than producing highly designed monthly reports. It combines dashboards with goals, OKRs, scheduled snapshots, alerts, anomaly detection, and its AI analyst, Genie. Support for 130+ integrations, databases, warehouses, and custom API ingestion also lets teams bring marketing, sales, and operational data into one reporting setup.
The agency workflow depends on disciplined configuration. Build a focused dashboard for each client, define the metrics tied to business goals, and use alerts to identify changes that need an account manager's explanation. MCP and API options can support AI-assisted reporting, but they do not replace metric definitions, quality checks, or client-facing context.
Model the account-level cost
Databox's breadth creates practical trade-offs. White-label delivery and advanced security may depend on the selected plan, while some tiers can scale with data-source counts. Model those limits across the full roster, especially when clients use different advertising, CRM, analytics, and sales connections. A dashboard that works for five accounts can become harder to forecast and administer at a larger client count.
Client experience improves when the agency hides irrelevant metrics and presents a small set of monitored KPIs. Goals and KPI views help maintain that focus, while recurring snapshots and alerts reduce manual review. The account team still owns the interpretation.
Migration from Looker Studio is manageable for straightforward dashboards. Rebuild complex blends carefully because formulas and source logic may not transfer directly. Spreadsheet migrations need a metric inventory first, followed by a reusable template and a test account. Agencies comparing alternatives should review this Databox alternative comparison before modeling costs across the client roster.
Pros
- Performance management: Goals, OKRs, snapshots, alerts, and anomaly detection add monitoring beyond standard charts.
- AI workflow options: Genie, MCP, and API features support assisted analysis.
- Broad ingestion: Integrations, databases, warehouses, and custom API options cover varied data environments.
Cons
- Plan-dependent white-labeling: Confirm that the required client branding is included.
- Scaling complexity: Data-source-based pricing can make multi-client forecasting difficult.
Compare the platform at Databox.
6. Looker Studio and Looker Studio Pro
Looker Studio remains a common starting point for agency reporting because Google-built connectors for GA4, Google Ads, and Sheets are available without the cost of a dedicated reporting platform. It also offers flexible visualizations, community connectors, third-party connectors, and integration with BigQuery and the wider Google Cloud stack.
For a small set of Google-heavy accounts, that flexibility can be enough. A capable account manager can create a reusable template, connect each client's sources, and adjust filters and branding. One agency tutorial recommends making a copy of the dashboard template, connecting the client's sources, and standardizing naming and client-level views instead of maintaining one oversized shared dashboard (Looker Studio agency workflow guidance).
Why agencies eventually hit friction
The problem isn't the chart builder. It's the operating model. Non-Google sources often require paid third-party connectors, and connector reliability becomes part of your agency's maintenance workload. Each client may also need separate permissions, data credentials, filters, and report copies, which creates version-control problems as the account count grows.
Looker Studio Pro adds team workspaces, asset ownership, and an enterprise SLA through a Google Cloud subscription. Pricing is billed through Google Cloud and isn't published in the supplied documentation, so agencies need to verify current billing details before budgeting.
Looker Studio is flexible. It isn't automatically operationally simple once every client has a different connector mix.
Migration away from Looker Studio can be worthwhile when the agency wants centralized templates, automated delivery, custom domains, and a more controlled client experience. Migration into Looker Studio is still sensible for Google-focused reporting where the team accepts connector maintenance and manual governance.
Use Looker Studio when flexibility and Google integration matter most. Choose another platform when account managers spend more time maintaining report copies than interpreting performance.

7. Supermetrics
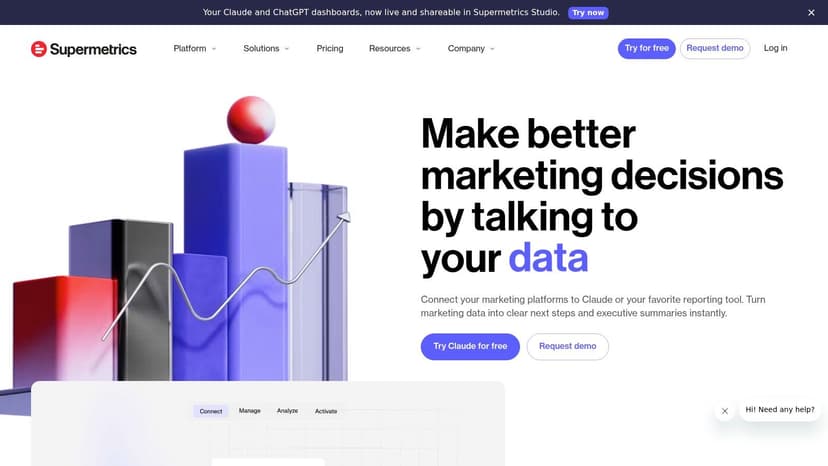
Supermetrics is the plumbing behind a reporting stack, not a complete client reporting destination. It pulls granular data from 150+ sources into destinations such as Google Sheets, Excel, Looker Studio, data warehouses, and BI tools.
That distinction matters for agencies. Supermetrics can replace manual exports and automate data collection while preserving the dashboard environment your team already knows. If your agency has a strong Looker Studio template library and needs dependable source data, this approach can be practical.
Use it when the dashboard layer is already working
Supermetrics offers multiple destination options and a fixed-subscription model based on destination or package. The agency can choose where each data flow lands, then build its own visual layer. This gives technically capable teams control over extraction and reporting architecture.
The cost is operational separation. You still need to create, brand, maintain, and deliver dashboards somewhere else. You also need to manage connector and destination expansion as new clients arrive. A team that buys Supermetrics expecting an all-in-one white-label client portal will end up maintaining more than one system.
The migration from spreadsheets is usually incremental. Start by automating the data pulls that create the most recurring work, then decide whether the spreadsheet remains an internal staging area or whether the agency should move client delivery into a dedicated dashboard platform. Moving from Looker Studio may be less disruptive because Supermetrics can continue feeding the existing reports, but it won't solve dashboard duplication or white-label delivery on its own.
Pros
- Automated extraction: Reduces recurring exports from advertising, analytics, and other platforms.
- Destination flexibility: Supports Sheets, Excel, Looker Studio, warehouses, and BI tools.
- Useful connector layer: Agencies can keep an existing visualization workflow while improving data collection.
Cons
- No complete client portal: You need a separate visualization and delivery system.
- Stack expansion: Multiple destinations and connectors can increase both cost and maintenance.
See Supermetrics when your primary problem is data collection rather than client-facing report production.
8. TapClicks
An agency serving varied platforms, recurring campaigns, and formal client presentations needs more than a dashboard builder. TapClicks combines 250+ native connectors, SmartConnector for custom data ingestion, white-label client portals, automated report delivery, Report Studio, and SmartSlides for branded slide decks.
The platform fits agencies that standardize services across a substantial client base. Dashboards, portals, executive presentations, and operational workflows can sit in one agency-oriented system, reducing the handoffs between reporting and account delivery.
TapClicks earns its place when reporting is tied to service operations. SmartSlides lets account teams turn KPI data into presentation material without rebuilding every chart manually. Portals support client-facing delivery, while recurring automation handles scheduled reports across accounts.
The cost is a heavier buying and setup process. Pricing is quote-based, so budgeting requires a sales conversation, and the feature range may exceed what a smaller agency needs for monthly dashboards. Paid media teams should also test pacing and budget fields against their internal definitions before using those metrics in client commitments.
Migration from spreadsheets needs an operating plan, not just chart recreation. Map service packages, data connections, templates, access rules, and presentation formats before building client workspaces. A move from Looker Studio can add control over delivery and account operations, but it still requires a deliberate implementation project.
For agencies managing many clients, the practical question is whether those operational features will replace enough manual coordination to justify the setup effort.
Best fit: agencies with varied data sources, standardized services, white-label delivery needs, and recurring executive reporting.
Watch-outs: quote-based pricing, implementation effort, and metric validation for pacing or budget data.
9. NinjaCat
An agency with several brands, regions, and reporting owners needs account structure before it needs more charts. NinjaCat is built for that operating model, combining 150+ pre-built connectors, reusable dashboard and report templates, scheduled delivery, AI agents for monitoring and analysis, and a governed Data Cloud based on a managed Snowflake option.
Its strongest differentiator is how reporting accounts are organized. Teams can separate brands, regions, and client portfolios instead of forcing every account into one flat dashboard. Pixel-perfect reports also suit agencies that deliver formal presentations and need layouts to remain consistent across recurring reports.
NinjaCat is a practical choice when governance affects daily delivery. Its Data Cloud and monitoring features support controlled data workflows, pacing checks, anomaly detection, and shared reporting standards across a complex portfolio. Agencies can also reduce spreadsheet-based assembly by centralizing templates and scheduled distribution.
The trade-off is the buying process and implementation effort. Pricing is custom and quote-based, and the product is aimed at mid-market and enterprise agencies. Smaller teams focused mainly on monthly dashboard production may pay for operational depth they will not use.
Migration requires an account architecture plan. Before rebuilding reports from spreadsheets or Looker Studio, define roll-up metrics, client-specific fields, dashboard ownership, permissions, and stakeholder delivery rules. Audit every source and access setting first. A technically correct template still creates problems if the wrong client receives the wrong view.
Best fit: agencies managing complex brands, regions, or large client portfolios that need governed data, white-label presentation, and recurring automation.
Watch-outs: custom pricing, a sales-led setup, migration work, and the risk of overbuying for simpler monthly reporting.
Explore NinjaCat when account complexity and governance justify a larger reporting system.
10. Funnel
Funnel suits agencies whose reporting problems start in the data layer. It supports 600+ connectors, normalizes information across channels, and sends that data to native dashboards, client portals, Looker Studio, Tableau, Power BI, warehouses, and other destinations.
The practical benefit is consistency. Google Ads, Meta, LinkedIn, CRM, and analytics platforms often use different definitions for similar metrics. Funnel gives agencies a central place to map those fields before they appear in recurring client reports, reducing repeated spreadsheet work and report-by-report fixes.
Choose Funnel for data control, not presentation
Funnel includes native dashboards, so an agency can publish reports without adding a separate BI product. Higher tiers also offer measurement features such as marketing mix modeling and incrementality for clients who need analysis beyond channel-level summaries.
Its trade-offs are clear. Pricing is quote-based and may increase as data volume, destinations, and client requirements grow. Creative-level pulls are limited for some advertising platforms, so test the exact ad, asset, and placement fields before committing to a reporting workflow.
White-label delivery is another consideration. Funnel may need an external visualization layer when branded portals, custom domains, or a specific client-facing experience are central to the service. That adds another system to configure and maintain, even if Funnel remains the agency's data foundation.
Migration should start with definitions, not dashboard design. For spreadsheet users, document source fields, naming rules, ownership, and recurring delivery requirements before rebuilding reports. For Looker Studio teams, Funnel can feed the existing front end, or replace it if native dashboards meet the client experience standard. Either route requires testing permissions, refresh schedules, and client-specific filters.
Best for: agencies standardizing data across many sources and client accounts before distributing reports through several destinations.
Watch-outs: quote-based pricing, platform-specific creative limits, and extra setup when full white-label delivery requires another presentation layer.
Funnel is the right evaluation when inconsistent source definitions are slowing recurring reporting more than dashboard design.
Top 10 Marketing Reporting Tools Comparison
| Platform | Core features | UX & Quality | Value / Pricing | Target audience | Unique selling points |
|---|---|---|---|---|---|
| Oviond 🏆 | 60+ connectors, live dashboards, branded reports, drag‑drop, templates, API, MCP/AI | ★4.3/5, polished UI, responsive support | 💰 from $39/mo (ann.) for 5 clients, client-count scaling, 15‑day trial | 👥 Agencies & in‑house marketing teams | ✨ Full white‑label (custom domains/email), unlimited users/reports, MCP AI, full migration support |
| AgencyAnalytics | 80+ integrations, white‑label portals, drag‑drop builder, unlimited dashboards (paid) | ★4.1/5, agency-focused UI | 💰 mid-tier agency pricing, predictable on paid plans | 👥 Agencies managing many clients | ✨ Broad integrations, unlimited users on agency plans |
| DashThis | Live dashboards, white‑label URLs, templates, per‑dashboard pricing, AI add‑on | ★4.0/5, fast setup & onboarding | 💰 per-dashboard model, can rise with scale | 👥 Small–mid agencies & fast onboarding clients | ✨ Quick setup, optional AI Insights for commentary |
| Whatagraph | 40+ integrations, polished templates, scheduled automated reports, white‑label | ★4.0/5, visually polished reports | 💰 mid-market pricing; can be costly for very small teams | 👥 Small–mid marketing teams & agencies | ✨ Polished cross‑channel templates, automation-first delivery |
| Databox | 130+ integrations, AI Genie, goals/OKRs, alerts, MCP/API | ★4.2/5, performance management focus | 💰 tiered plans; white‑label/advanced features may be add‑ons | 👥 SMBs to mid-market teams tracking KPIs | ✨ Built-in AI analyst, anomaly detection, goals/OKR tracking |
| Looker Studio (Pro) | Google connectors (GA4, Ads, Sheets), flexible visualizations, third‑party connectors | ★3.8/5, highly flexible but connector-dependent | 💰 free entry; Pro via Google Cloud (enterprise billing) | 👥 Data-savvy teams, Google Cloud/BigQuery users | ✨ No-cost Google connectors, deep BigQuery integration |
| Supermetrics | 150+ connectors, exports to Sheets/Excel/BI/warehouses, governed data movement | ★4.0/5, connector-first reliability | 💰 fixed-price by destination; costs grow with connectors/destinations | 👥 Analysts & teams needing reliable ETL to BI tools | ✨ Extensive connector catalog, predictable destination pricing |
| TapClicks | 250+ connectors, white‑label portals, Report Studio, SmartSlides for slide decks | ★4.0/5, enterprise-grade platform | 💰 quote-based enterprise pricing | 👥 Large agencies & enterprise clients | ✨ SmartSlides, managed connectors, agency-scale client ops |
| NinjaCat | 150+ connectors, managed Snowflake Data Cloud, AI agents, pixel-perfect reports | ★4.0/5, multi-account & enterprise focus | 💰 quote-based; enterprise contracts | 👥 Mid-market & enterprise agencies with many accounts | ✨ Managed Data Cloud, AI agents for pacing/QA, multi-account reporting |
| Funnel | 600+ connectors, data modeling/normalization, dashboards or exports to BI/warehouses | ★4.0/5, strong ETL & modeling | 💰 quote-based; scales with usage and connectors | 👥 Teams needing standardized marketing data pipelines | ✨ Massive connector set, built-in modeling, measurement add‑ons (MMM) |
Choose the System Your Agency Can Operate
The best marketing reporting tool for your agency isn't the one with the longest feature list. It's the one your account managers can use consistently, your operations lead can forecast, and your clients can understand without asking for a new spreadsheet every month.
Start by sorting your shortlist around the agency's actual workflow. Client count matters because a tool that works for a handful of accounts may become expensive or difficult to govern across a larger portfolio. Connector requirements matter because one missing CRM, ad network, call-tracking source, or e-commerce platform can force manual work back into the process.
White-label expectations should be specific. Decide whether you need a custom domain, branded email sender, client portal, embedded dashboards, or all of these. Independent white-label reporting guidance emphasizes that live dashboards, scheduled delivery, and custom subdomains work together as part of the client experience, not as separate cosmetic features (white-label client reporting guidance). Custom domain setup commonly involves a CNAME record in DNS, and one vendor guide notes that verification can take 15 minutes to 72 hours depending on propagation (custom-domain setup guidance).
Also decide where reporting ownership should sit. A dashboard-first platform is right when account managers are losing time to manual client reports. A normalization-first platform is better when inconsistent fields, definitions, and cross-channel governance cause problem. A pipeline tool may still need a separate client-facing dashboard, while a white-label platform may handle delivery without becoming your agency's full data warehouse.
Pilot before you migrate
Pick one representative client, not the easiest client. Choose an account with the source mix, KPI complexity, branding requirements, and delivery format that reflect the work your agency does.
Document the client's KPI definitions, naming conventions, filters, date ranges, and attribution assumptions. Rebuild one reusable template, connect the historical data you need, compare the numbers with the current report, and schedule the delivery. Have the account manager and client-success lead review the result, not just the person who configured the dashboard.
Migration rule: Don't switch every account until one complete reporting cycle works from data connection to client delivery.
The marketing technology ecosystem is fragmented. The 2023 Marketing Technology Landscape data cited by the University of Hamburg counted 9,932 worldwide solutions, with the ecosystem growing 24% since 2020. The same evidence reported that 44% of companies had strategically adopted marketing automation, while more than half had not deployed it in marketing processes (University of Hamburg marketing technology report). Your reporting platform should reduce that fragmentation, not become another isolated system your team has to maintain.
For most agencies managing recurring multi-channel client reporting, start with Oviond, AgencyAnalytics, Whatagraph, or DashThis when client-facing delivery is the main pain. Choose Funnel, Supermetrics, NinjaCat, or TapClicks when data operations and account complexity require more structure. Choose Looker Studio when your agency is heavily invested in Google and accepts connector maintenance. Choose Databox when goals, alerts, and KPI management matter as much as the report itself.
The right system makes branded, multi-client reporting repeatable. It gives your account managers a reliable template, your clients a clear view, and your operations team a process that can survive growth. That's the standard to use when you make the final decision.
Oviond brings analytics, paid media, SEO, social, email, CRM, and e-commerce data into white-label dashboards and automated client reports, with unlimited users, reports, and dashboards included in one client-count-based plan. Visit Oviond to replace spreadsheet-heavy reporting with a branded workflow your agency can operate as the client roster grows.
Related articles
Simplify marketing reporting today
Stop juggling multiple tools. Start presenting clear, automated reports your clients will love