
Oviond Blog
Marketing Efficiency Ratio: A Guide for Agencies
Learn how to calculate, track, and improve the marketing efficiency ratio (MER) for your clients. A practical guide for agencies on automating MER reporting.

Every agency knows the monthly pattern. Someone exports Google Ads, someone else pulls Shopify or GA4, the account manager opens a spreadsheet that was already messy last month, and the client still wants a clean answer about whether the full marketing spend is working. By the time the report is stitched together, the team has usually spent more energy reconciling numbers than explaining what changed.
That's where Marketing Efficiency Ratio, or MER, earns its place in agency reporting. It gives clients a blunt, top-level answer to the question that matters most, is the entire marketing system producing enough revenue for what it costs? Used well, MER helps agencies stop arguing about isolated channels and start showing the health of the whole mix.
Table of Contents
- The End of Month Scramble Your Agency Knows Too Well
- What Is Marketing Efficiency Ratio and Why Agencies Need It
- How to Calculate Marketing Efficiency Ratio Step by Step
- MER vs ROAS vs ROMI vs LTV CAC
- What Is a Good Marketing Efficiency Ratio
- Automating MER Reporting for All Your Clients with Oviond
- Moving Beyond the Ratio to Drive Client Growth
- Frequently Asked Questions About MER
The End of Month Scramble Your Agency Knows Too Well
The worst part of end-of-month reporting isn't the report itself. It's the scramble before it. One client's paid media lives in Google Ads, another's spend is split across Meta and LinkedIn, a third wants blended revenue from Shopify and CRM data, and every account manager has a slightly different version of what counts as marketing cost.
That's how MER gets missed or misused. The metric is simple, but the process around it is messy when teams are moving between tabs, exports, and spreadsheets for 5 clients or 50. Agencies don't need another vanity number. They need a clean way to answer whether the total marketing investment is pulling its weight.
Practical rule: if the data takes longer to explain than the result, the reporting stack is doing too much work.
MER helps cut through that mess because it sits above the channel chatter. Instead of making every conversation about isolated ROAS swings, it gives the agency a single blended number clients can understand quickly. That makes it useful not just for reporting, but for keeping strategy conversations grounded in the full picture.
What Is Marketing Efficiency Ratio and Why Agencies Need It
A blended metric at the executive level
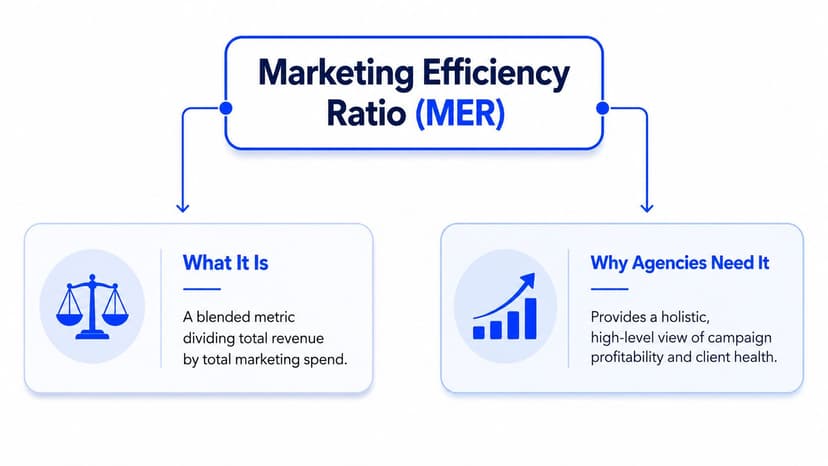
Marketing Efficiency Ratio is a blended, top-down efficiency metric. The standard calculation is total revenue divided by total marketing spend over the same period, and it deliberately avoids channel-level attribution (The Current). That's the key difference from platform metrics that only describe one slice of the system.
Think of MER like the overall profit margin on a business, not the margin on one product line. It doesn't tell you which ad set or keyword carried the weight, but it does tell you whether the whole marketing engine is producing enough revenue relative to what the agency is putting into it. HubSpot frames it as an executive-level view across all channels, and Shopify describes it as high-level performance data rather than individual campaign metrics (HubSpot).
For agencies, that high-level view is useful because clients rarely buy a channel-by-channel argument. They want to know whether the overall marketing mix is healthy, and MER is built for that conversation. It's also why the metric works well in white-label client reporting, where the story needs to be clear, concise, and defensible.
A useful resource for teams comparing measurement approaches is optimizing marketing with AI and data, especially when reporting needs to connect messy inputs into one coherent view.
Why agencies use it in client conversations
MER works well when the client leadership team wants a single answer before they ask for platform detail. It gives account managers a clean opening line, then leaves room to dig into paid, organic, and brand activity later.
That matters because agencies are often translating between different audiences. Performance teams want tactical detail, while founders and operators want the business story. MER gives both sides a stable starting point. It's the metric you use when the question is, “Is the overall system working?” not “Which ad won the auction yesterday?”
How to Calculate Marketing Efficiency Ratio Step by Step
Start with aligned totals
The basic formula is simple, total revenue divided by total marketing spend (Triple Whale). The catch is that the two numbers have to cover the same period and use the same definitions every time. If spend comes from one date range and revenue from another, the result can be distorted fast (Funnel).
For agency reporting, that means you need one rule for what counts as spend and one rule for what counts as revenue. Don't mix platform-reported conversion windows with financial revenue pulled from a different schedule unless the client has explicitly agreed to that setup.
A simple manual example helps. If a client's total marketing spend is entered in one bucket and the same-period revenue is entered in another, the MER calculation is just the revenue total divided by the spend total. The calculation itself is easy. The hard part is getting the inputs right without hand-building the same spreadsheet every month.
Practical rule: normalize the data first, calculate the ratio second. If the inputs aren't aligned, the result is just a tidy-looking error.
Build the same calculation in software
The agency workflow gets cleaner. Teams that want a repeatable MER process usually aggregate spend from every platform into one cost metric, then pair it with business revenue from GA4, Shopify, or CRM data. Funnel's guidance stresses that MER only works when the inputs are normalized into the same reporting frame (Funnel).
That's the point of using a reporting platform with calculated metrics and reusable data models. Oviond can hold the source data in one place, define the MER formula once, and reuse it across clients without rebuilding the logic every month. Its data and measurement workflow is built for that kind of setup, especially when the agency needs one calculation standard across multiple accounts (Oviond data and measurement).
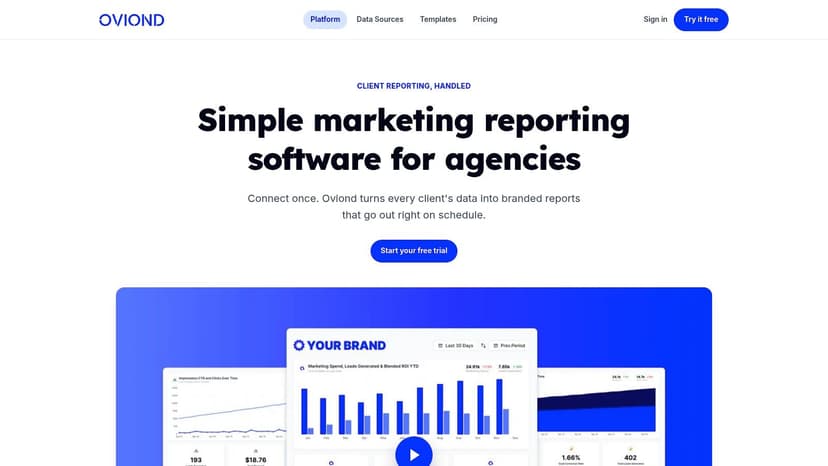
The benefit isn't just speed, it's consistency. Once the metric is defined, the reporting team can stop re-litigating formulas every month and focus on what the movement means for the client.
MER vs ROAS vs ROMI vs LTV CAC
MER gets confused with other acronyms because they all touch efficiency, but they answer different questions. ROAS looks at return from advertising, ROMI looks at marketing investment return, and LTV:CAC frames the relationship between value created and customer acquisition cost. MER sits above them as the blended business-level ratio.
| Metric | What It Measures | Typical Use Case |
|---|---|---|
| MER | Total revenue compared with total marketing spend | Executive reporting, budget conversations, blended channel health |
| ROAS | Revenue attributed to a specific ad effort compared with ad cost | Channel optimization, campaign tweaks, creative testing |
| ROMI | Return relative to marketing investment | Broader finance and marketing efficiency discussions |
| LTV:CAC | Long-term customer value compared with acquisition cost | Retention strategy, unit economics, growth planning |
The cleanest way to think about it is this, ROAS is tactical, MER is strategic. ROAS helps media buyers decide where to push or pull spend inside a channel. MER helps agency leaders talk about the total marketing system and whether the mix is efficient enough to justify the budget.
For deeper budget decisions, MER should not stand alone. WorkMagic recommends geo lift tests across major channels and markets to estimate incremental revenue lift, because a high MER can still sit alongside weak causal impact if brand demand, seasonality, or other non-marketing factors are doing the lifting (WorkMagic). That's important for agencies because clients often want one score to make a big decision, and one score is rarely enough.
If your team already uses lead metrics in reporting, the same thinking applies to calculating cost per lead. MER and CPL serve different layers of the conversation, and both are more useful when they're standardised.
MER is not the replacement for attribution or unit economics. It's the front door to the conversation.
When each metric belongs in the report
Use MER when the client wants a read on the whole system. Use ROAS when the media team needs to optimise a specific channel. Use LTV:CAC when the client cares about the quality of growth, not just the pace of it. Agencies that separate those jobs usually spend less time defending one number as if it can do everything.
What Is a Good Marketing Efficiency Ratio
Why the benchmark depends on the client
A commonly cited benchmark for a “good” MER is 3.0 or higher, which means roughly $3 in revenue for every $1 spent on marketing (Keends). That's a useful starting point, not a universal target. The right level still depends on the business model, margins, and growth goals (Keends).
For agencies, that context matters more than the number itself. A client pushing aggressive growth can accept a different efficiency profile than a client protecting margin. A business with thin contribution margins will also read the same MER differently from one with more breathing room. The ratio tells you how hard the marketing engine is working, but not whether the client wants speed or caution.
That's why agencies should avoid selling a benchmark as if it were a law. A good MER is the one that matches the client's economics and strategic goals, and that's a discussion worth having before the monthly report goes out.
Why spend definitions cause reporting chaos
The ugliest MER disputes usually start with one question, what counts as marketing spend? High-quality guidance doesn't agree. Some definitions include only ad spend, while others include agency fees, creative production, technology, and labor, which can change the ratio significantly for the same brand (Vectoron).
That inconsistency is a real agency problem. If one client's MER includes software and labor while another client's does not, the numbers can't be compared cleanly. The team needs a documented rule for blended spend, then that rule has to stay stable across reporting periods.
SleekPost has a useful take on reporting best practices for keeping recurring client reporting consistent, especially when multiple people touch the same dashboard. The same idea applies here. Standardise the inputs, document the scope, and keep the definition visible in the report.
Automating MER Reporting for All Your Clients with Oviond
A reusable workflow for multi client reporting
The practical answer to MER chaos is a reporting system built for agencies, not a pile of disconnected exports. Oviond brings in live data from sources like analytics, ads, search, social, email, CRM, and e-commerce, then lets the team turn those inputs into branded client reporting and dashboards. It also supports white-label delivery, custom domains, automated scheduling, and 70+ integrations, which matters when each client stack looks a little different.
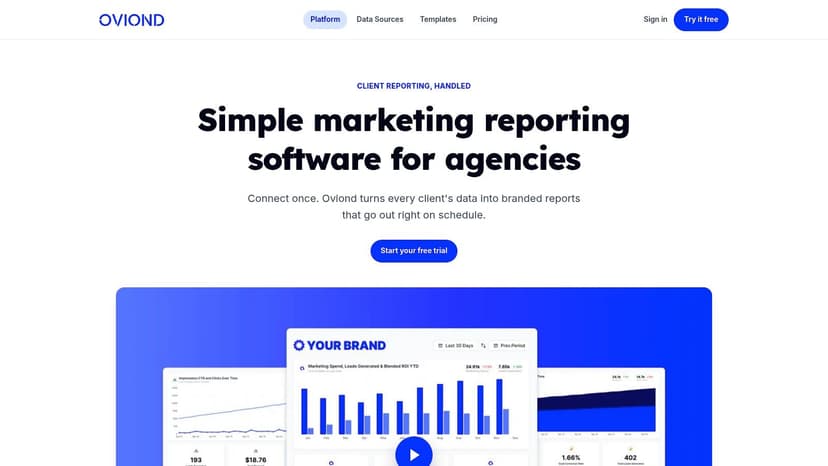
A sane agency workflow looks like this. Connect the client's revenue and spend sources, define the MER calculation once as a calculated metric, then place it into a dashboard template that can be reused across accounts. From there, the same framework can be delivered with branded dashboards and scheduled reports, so nobody has to rebuild the same monthly file from scratch.
The hardest part is still the denominator. As noted earlier, what counts as marketing spend is often the most disputed part of the metric, and agencies need a standardized rule for each client (Vectoron). Once that rule is set, the reporting layer should preserve it, not keep reopening it.
If you want a deeper look at the reporting side, automated marketing reports show why standardising delivery matters once you have more than a few clients.
The platform also includes all features in one plan, pricing by client count, and unlimited reports, dashboards, and users. That matters for agencies because the bottleneck usually isn't ideas, it's the effort required to keep reporting consistent as the client list grows.
A dashboard template makes MER easier to scale because the structure stays the same even when the data sources change. One client might use Shopify and Google Ads, another might need CRM revenue and paid social costs, but the output can still follow the same logic. That's the kind of repeatability agencies need when reporting across many accounts.
Moving Beyond the Ratio to Drive Client Growth
From reporting number to decision tool
MER gets useful when the account team uses it to guide the next conversation, not just close the month. If the trend is drifting down, the question isn't only “what happened,” it's “what changed in spend mix, revenue quality, or client demand?” If the trend improves, that's a cue to ask where the system got cleaner and whether that pattern can be repeated.
A platform like Exerta's AI platform is useful context here because more teams are trying to move from static reporting into guided analysis and summarisation. The agency still owns the judgment, but the workflow gets lighter when the reporting layer helps surface the trend before the meeting starts.
Oviond's efficiency measurement approach also ties MER to adjacent metrics like CPA, CPL, conversion rate, and booked-call cost, which is the right way to keep the ratio grounded in action (Oviond efficiency measurement). MER should point the client to a decision, not sit alone as a scorecard.
Set goals inside the reporting system, watch the trend, and flag major changes automatically. That gives account managers a cleaner way to talk about budget allocation, brand campaigns, and channel testing without drifting back into spreadsheet archaeology.
Frequently Asked Questions About MER
How do I explain MER to a client who only understands ROAS?
Use simple language. ROAS tells them how a specific channel performed, while MER tells them how the whole marketing system performed. That usually lands better with leadership because it connects spend to total revenue, not just one platform.
How often should an agency report MER?
Most agencies report it on the same cadence they use for recurring client reporting, usually monthly, because the metric is more stable when it's reviewed over a consistent period. Some teams check it more often internally, but the client-facing number should stay aligned with the reporting schedule.
Can MER work for lead-gen or B2B clients?
Yes, but the revenue source may be harder to define because sales cycles are longer. In those cases, agencies often pair MER with pipeline or lead-quality metrics so the client sees both the blended efficiency view and the early signals that feed it.
What if the client asks why their MER changed but ROAS didn't?
That usually means the total system moved, not just one channel. The client may have had changes in organic revenue, brand demand, or other costs that sit outside the platform view. MER is meant to catch that broader movement.
If your agency is tired of rebuilding the same MER story in spreadsheets every month, take a look at Oviond. It gives you white-label client reporting, branded dashboards, and automated delivery in one place, so MER can live in a repeatable agency workflow instead of a messy file.
Related articles
Simplify marketing reporting today
Stop juggling multiple tools. Start presenting clear, automated reports your clients will love