
Oviond Blog
Stakeholder Reporting: Agency Guide to Client Reports
Ditch reporting chaos. Plan, build, & automate stakeholder reporting that scales your agency. Essential guide for multi-client marketing agencies.

If you run an agency with a growing client roster, stakeholder reporting usually breaks before delivery does. The first few clients are manageable. Then the stack grows. Google Ads in one tab, GA4 in another, Meta somewhere else, Search Console exports in a folder, and a spreadsheet that everyone is afraid to touch because one bad formula wrecks the whole monthly pack.
That's the point where reporting stops being a simple client task and turns into an ops problem. It drains account managers, creates inconsistent client experiences, and makes your agency look less organized than it is. Research from Smartsheet found that marketing and creative professionals cite disjoined workflows between teams (38%) and lack of access to centralized data (37%) as top challenges when demonstrating business impact, which will feel familiar to any agency juggling recurring reports across multiple tools and people in this research report.
Table of Contents
- The End of Copy-Paste Reporting
- Plan Your Reports Before You Build Them
- Build Reports That Clients Actually Understand
- Automate Delivery and Scale Your Process
- Deliver a Fully Branded Client Experience
- Measure What Matters Proving Your Reporting ROI
The End of Copy-Paste Reporting
Every agency has a version of the same month-end scene. An account manager is chasing missing numbers, someone else is fixing formatting in a spreadsheet, a client asks for one extra chart at the last minute, and now the report that should have taken minutes has swallowed half a day.
That's not just annoying. It creates operational drag. The more clients you manage, the more often your team repeats work that adds no strategic value. Manual reporting also creates version problems, because once PDFs start flying around by email, nobody is completely sure which file the client is looking at.
Practical rule: If your team rebuilds the same report every month, you don't have a reporting process. You have a recurring production problem.
Stakeholder reporting becomes useful not as corporate language, but as a practical agency discipline. It means deciding who needs what, how often they need it, what decisions the report should support, and how your team can deliver that consistently without a fire drill.
For many agencies, that also means moving away from spreadsheet chains and ad hoc dashboard links. The operational difference between manual and automated reporting becomes obvious once client count grows, which is why this breakdown of manual reporting vs automated digital marketing reporting is worth reading before you redesign your process.
A good report should make the next client conversation easier. It should help a client decide whether to increase spend, shift channel mix, fix a landing page, or hold the line. If your report doesn't help that happen, it's decoration.
That's also why review rhythm matters. A solid OKR review meeting strategy is useful here because it shows how reporting and decision-making need to stay connected. Agencies that treat reports as inputs to a working review process tend to get better client engagement than agencies that send a file, hoping someone reads it.
Plan Your Reports Before You Build Them
Most reporting problems start before anyone opens a dashboard builder. Agencies jump straight into layout, widgets, and channel sections. Then the client asks why the report doesn't show sales quality, pipeline impact, lead handling, or progress against the actual goal.
The fix is simple. Plan the reporting system first.
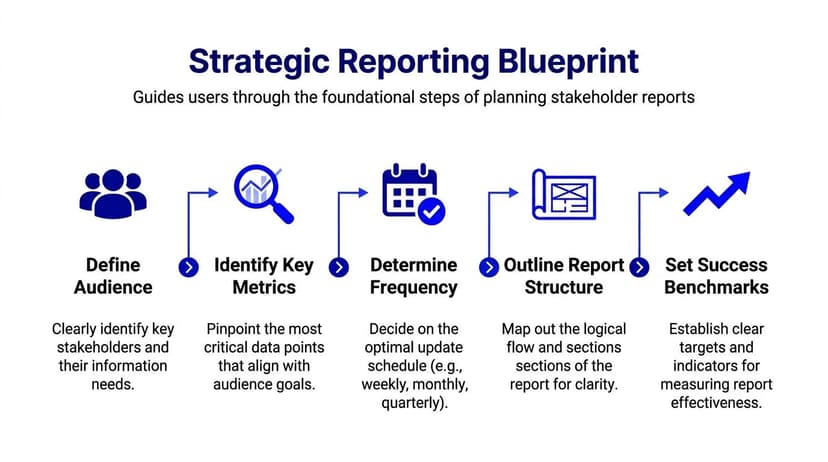
Start with the real audience
A rigorous approach to stakeholder reporting starts with a four-step process: conduct a stakeholder analysis, design unique templates and schedules for each segment, implement a formal communication plan, and include a dedicated risks and issues section, as outlined in this practical stakeholder engagement method.
For agencies, that means your “client” is rarely one person.
The day-to-day contact may care about campaign pacing and channel detail. The owner or CEO may only care about revenue trend, lead quality, and risk. A sales leader may want lead volume, close quality, and source mix. If you send the same report to all of them, at least one group gets too much detail and another gets too little.
Use a basic map like this:
| Stakeholder | What they care about | Report format | Delivery rhythm |
|---|---|---|---|
| Marketing manager | Channel performance, spend, campaign changes | Detailed dashboard | Weekly or monthly |
| CEO or owner | Business outcomes, trend, issues | Summary report | Monthly |
| Sales lead | Lead quality, source contribution, follow-up issues | Focused snapshot | Monthly |
That table doesn't need to be fancy. It just needs to exist.
Build the reporting rules first
Once you know the audience, lock the rules before you build a single template.
- Choose outcome metrics first. Start with the business result the client bought you for. Leads, pipeline contribution, booked calls, qualified traffic, or channel efficiency. Then work backward into supporting metrics.
- Set frequency by decision speed. If a client makes channel adjustments every week, monthly-only reporting is too slow. If the CEO checks in once a month, don't bury them in weekly detail.
- Define what each report must include. Executive summary, KPI snapshot, channel sections, commentary, risks, next actions. Keep the structure repeatable across clients.
- Add a risk section every time. If CPL is rising, tracking is broken, conversion quality dropped, or creative fatigue is showing, say it directly.
A report becomes more useful the moment it includes what's off track, not just what looks good.
A lot of agencies also mix metrics and KPIs without being clear about the difference. That creates bloated reports full of data points that nobody uses. This guide on KPIs vs metrics and what to include in your report is a useful reference when you're tightening templates.
There's also a practical distinction between operational reporting and analytical reporting. Agencies need both. One keeps the client updated on what happened. The other helps explain why it happened and what to do next. Streamkap's practical guide to reporting is helpful if your current reports lean too hard in one direction.
A planning habit that works well is to document one page per client with four fields: audience, goals, delivery cadence, and essential KPIs. When a report needs revision later, your team edits the plan once instead of improvising inside every monthly deck.
Build Reports That Clients Actually Understand
Clients don't struggle with reports because they hate data. They struggle because most reports dump numbers without context. A table full of sessions, CPC, CTR, ROAS, opens, impressions, and conversions can still leave the client asking the only question that matters. Is this good or not?
That's the context gap. It's a common failure in stakeholder reporting, especially when the audience isn't technical.
Answer compared to what
The missing piece is usually comparison. Without targets, historical baselines, forecasts, or peer benchmarks, stakeholders can't draw meaningful conclusions, which creates overload or misinterpretation, as explained in this piece on reports and dashboards for non-technical stakeholders.
In agency terms, don't show this:
- Leads: 64
- Cost per lead: $X
- Conversion rate: Y
Show this instead:
- Leads versus target
- Cost per lead versus last month
- Conversion rate trend across the last reporting periods
- Notes on what changed and why
If a client sees one number in isolation, they have to do the interpretation work themselves. That's where confusion starts.
Use a simple report flow
A report that clients understand usually follows a narrative. Not a dramatic one. Just a clear order that mirrors how people process performance.
- Start with the summary. One screen or section. What improved, what slipped, what needs attention.
- Move into channel detail. Paid search, paid social, SEO, email, CRM, whatever matters for that client.
- Explain the drivers. Budget changes, creative changes, tracking issues, seasonality, sales follow-up lag.
- End with actions. What your agency recommends next.
That structure prevents the common mess where clients scroll through charts for ten minutes before finding the one thing they wanted to know.
A few practical choices help a lot:
- Use annotations. Add short notes directly on charts when spend changed, tracking broke, or a landing page launched.
- Limit visible metrics. Put supporting detail behind secondary sections. Don't lead with every available number from every integration.
- Group by decision. If the next client discussion is about budget allocation, organize around that. Don't force them through a channel-by-channel museum tour.
For layout and readability, this breakdown of design elements for an effective digital marketing report is a good reference point.
Clients usually don't want more charts. They want fewer unanswered questions.
A strong report feels easy to scan because the agency already did the sorting. The client doesn't have to translate marketing data into business meaning. That translation is the work.
Automate Delivery and Scale Your Process
If your agency manages recurring reporting across 5 to 50+ clients, automation stops being a nice extra and becomes part of margin protection. Every manual rebuild eats the same resource you need for strategy, account growth, and retention.
That's why scaling agencies standardize delivery before reporting volume gets painful.
A useful reality check here is market size. The global advertising agencies industry includes approximately 450,000 businesses and grew at a 3.8% CAGR between 2020 and 2025, according to IBISWorld's global industry overview. More agencies competing for more clients usually means more pressure to look organized, consistent, and scalable.
Standardize before you automate
Automation doesn't fix a messy reporting system. It scales it.
Start by creating a small set of repeatable report types:
- Executive monthly report for owners and senior stakeholders
- Channel performance dashboard for marketing contacts
- Campaign check-in report for active accounts with faster review cycles
Once those templates are stable, automate delivery by cadence and audience. Agencies can reduce report creation time by up to 90% with automation tools, shifting effort away from manual data entry and toward strategy, as noted in this agency reporting automation analysis.
That doesn't mean every report should be hands-off. It means the structure, data pulls, branding, and sending shouldn't require fresh labor every single month.
Split delivery by stakeholder
One of the simplest improvements an ops lead can make is to stop treating all report recipients the same.
A practical setup looks like this:
| Recipient | What they receive | Cadence |
|---|---|---|
| Marketing contact | Detailed live dashboard | Weekly and monthly |
| Founder or CEO | Short branded summary | Monthly |
| Internal account team | Full performance dashboard plus notes | Ongoing |
That setup cuts noise. It also prevents the common problem where a senior stakeholder gets buried in campaign detail while the hands-on contact doesn't get enough visibility.
A lot of agencies also need a way to keep reports always current without sending revised PDFs every time data changes. This is one reason live dashboards and automated delivery work better than static exports for recurring client reporting. If you're reworking your process, this guide to automated marketing reports is worth keeping handy.
For a quick product walkthrough of how automated reporting setup can work in practice, this video gives a useful visual reference:
Ops note: The most scalable reporting workflow is the one your team can reuse without asking who built it last time.
When agencies get this right, account managers stop acting like part-time data assemblers. They spend more time on commentary, recommendations, and client conversations. That's where agencies keep accounts healthy.
Deliver a Fully Branded Client Experience
The content of a report matters. So does the wrapper.
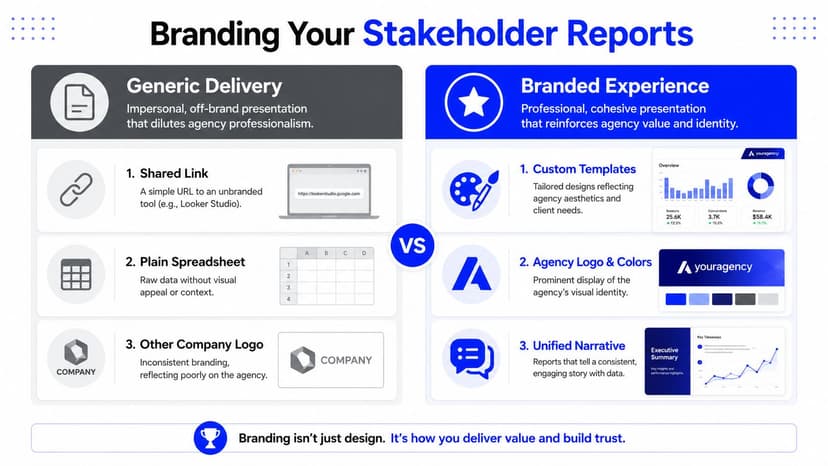
A client can tell the difference between a report that feels like part of your agency and one that feels borrowed from a generic tool. Shared Looker Studio links, spreadsheet exports, and dashboards carrying another platform's branding create friction even when the underlying data is correct. It feels patched together.
What generic delivery signals
Clients don't usually complain about branding directly. They notice it indirectly.
A plain spreadsheet says manual work. A generic dashboard URL says rented system. A report email from another company's sender says your process depends on someone else's interface. None of that destroys trust on its own, but it chips away at the sense that your agency has a polished, repeatable operation.
White-label reporting fixes that by making the experience feel continuous. Your logo. Your colors. Your report style. Your custom domain. Your sender identity. One coherent client-facing system.
A useful parallel is physical brand presentation. If an agency is thoughtful about how it presents branded material in person, the same logic applies to client reporting. The details in this guide on how to select branded corporate gifts show the broader principle well. Presentation affects perceived care, even when the core offer stays the same.
A balanced tool comparison
Different tools handle branding differently, and the trade-offs are real.
| Option | Where it works | Where it gets frustrating |
|---|---|---|
| Spreadsheets | Flexible for custom one-off analysis | Weak client presentation, manual upkeep, not ideal for white-label delivery |
| Looker Studio | Familiar, shareable, flexible for some teams | Can get messy across many clients, branding can feel limited, setup governance matters |
| AgencyAnalytics, Whatagraph, Swydo | Agency-focused reporting workflows | Each has its own strengths, learning curve, and packaging choices |
| Agency-native white-label platform | Better fit for recurring branded client reporting | Requires a cleaner process and template discipline |
This doesn't mean Looker Studio is wrong. Plenty of agencies use it well. AgencyAnalytics, Whatagraph, and Swydo also solve real reporting problems for agency teams. The issue is fit. Once you're managing multi-client reporting at scale, the branded delivery experience becomes part of account management, not just a design preference.
A fully branded setup is especially useful when multiple stakeholders inside the client account view reports. It reduces tool confusion and keeps your agency front and center every time someone opens a dashboard, receives a scheduled update, or shares a report internally.
The more often a client sees your reporting, the more that presentation becomes part of your service.
That's why white-label reporting isn't cosmetic. It reinforces professionalism every single reporting cycle.
Measure What Matters Proving Your Reporting ROI
The easiest reporting metric to track is whether the report was sent. It's also one of the least useful.
A report can leave your system on time every month and still fail completely. The client may not read it. They may skim it and miss the point. They may open it, nod, and do nothing. From an ops view, delivery happened. From a commercial view, the reporting did no real work.

Sent is not success
One of the main pitfalls in stakeholder reporting is failing to validate reception. Success should be measured through outcomes such as decisions made or feedback provided, not just delivery rates, as discussed in this stakeholder engagement reporting article.
For agencies, that changes the scorecard.
Good reporting should help trigger things like:
- Budget decisions: The client approves a shift in spend because the trend is clear.
- Priority changes: The client agrees to fix a landing page, update creative, or improve lead handling.
- Better meetings: Review calls move faster because the report already framed the decisions.
- Stronger trust: Senior stakeholders stop asking for scattered screenshots because they know where to find the current view.
If none of that happens, the report may be technically fine and commercially weak.
Simple ways to prove reporting value
You don't need a complicated measurement framework to check whether reporting is working. Start with a few observable signals.
- Track responses. Did the client reply with questions, approval, or requests tied to the report?
- Log decisions influenced. Note when a report directly supported budget, channel, or strategy changes.
- Watch meeting quality. Are review calls shorter, sharper, and less spent on basic explanation?
- Check repeat usage. Are stakeholders returning to the dashboard between meetings?
A small operational habit helps a lot here. Put a short summary in the delivery email with two or three direct questions. For example:
- Do you want us to keep budget split as is next month?
- Are you comfortable with lead volume versus quality trade-off this period?
- Should we prioritize fixing conversion rate before increasing spend?
That turns stakeholder reporting from passive output into active engagement.
Another useful test is internal. Ask your account managers one question: does this report make the client conversation easier? If the answer is no, the problem usually isn't effort. It's structure, context, or delivery design.
The agencies that get reporting ROI don't treat reports as monthly admin. They treat them as a repeatable client management system. That system needs clear planning, understandable presentation, automated delivery, and branded consistency. Once those pieces are in place, your team spends less energy assembling reports and more energy using them to drive smarter conversations.
If your agency is tired of spreadsheet sprawl, generic dashboard links, and recurring report rebuilds, Oviond gives you agency reporting that finally feels simple. It's built for multi-client reporting with white-label dashboards, branded reports, custom domain options, automated delivery, 70+ integrations, and unlimited reports, dashboards, and users in one plan. If you want a simpler, agency-native alternative to Looker Studio chaos, it's worth a closer look.
Related articles
Simplify marketing reporting today
Stop juggling multiple tools. Start presenting clear, automated reports your clients will love